| Param | Original file | Final file |
|---|---|---|
| Filename | modeM0/AS1A02_106T01_9000000744_05793cztM0_level2.evt | modeM0/AS1A02_106T01_9000000744_05793cztM0_level2_quad_clean.evt |
| Size (bytes) | 489,432,960 | 81,227,520 |
| Size | 466.8 MB | 77.5 MB |
| Events in quadrant A | 3,550,307 | 484,578 |
| Events in quadrant B | 3,751,496 | 494,906 |
| Events in quadrant C | 3,520,550 | 479,722 |
| Events in quadrant D | 3,473,535 | 461,921 |
| Mode M9 | |||
|---|---|---|---|
| Quadrant | BADHDUFLAG | Total packets | Discarded packets |
| A | 0 | 9 | 0 |
| B | 0 | 9 | 0 |
| C | 0 | 9 | 0 |
| D | 0 | 9 | 0 |
| Mode M0 | |||
|---|---|---|---|
| Quadrant | BADHDUFLAG | Total packets | Discarded packets |
| A | 0 | 15978 | 4 |
| B | 0 | 16222 | 3 |
| C | 0 | 15941 | 3 |
| D | 0 | 16037 | 3 |
| Mode SS | |||
|---|---|---|---|
| Quadrant | BADHDUFLAG | Total packets | Discarded packets |
| A | 0 | 160 | 0 |
| B | 0 | 160 | 0 |
| C | 0 | 160 | 0 |
| D | 0 | 160 | 0 |
| Quadrant | Total seconds | Saturated seconds | Saturation percentage |
|---|---|---|---|
| A | 7739 | 256 | 3.307921% |
| B | 7739 | 260 | 3.359607% |
| C | 7739 | 195 | 2.519705% |
| D | 7739 | 188 | 2.429254% |
Noise dominated data is calculated using 1-second bins in cleaned event files. If a bin has >2000 counts, and if more than 50% of those come from <1% of pixels, then it is considered to be noise-dominated and hence unusable.
| Quadrant | # 1 sec bins | Bins with >0 counts | Bins with >2000 counts | High rate bins dominated by noise | Noise dominated (total time) | Noise dominated (detector-on time) | Marked lightcurve |
|---|---|---|---|---|---|---|---|
| A | 8694 | 7744 | 1 | 1 | 0.01% | 0.01% | 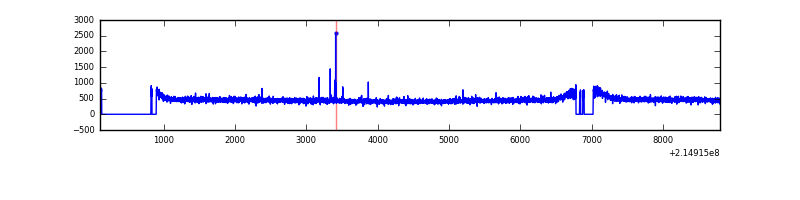 |
| B | 8694 | 7744 | 4 | 4 | 0.05% | 0.05% | 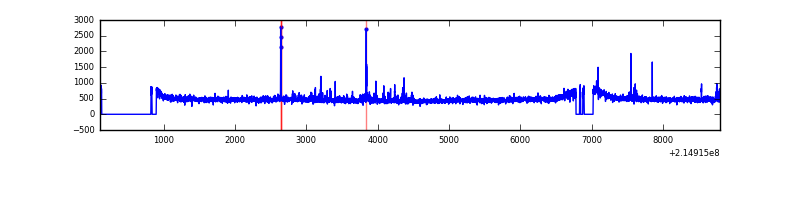 |
| C | 8694 | 7744 | 0 | 0 | 0.00% | 0.00% | 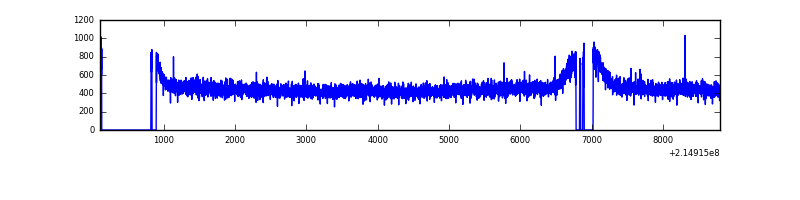 |
| D | 8694 | 7744 | 0 | 0 | 0.00% | 0.00% | 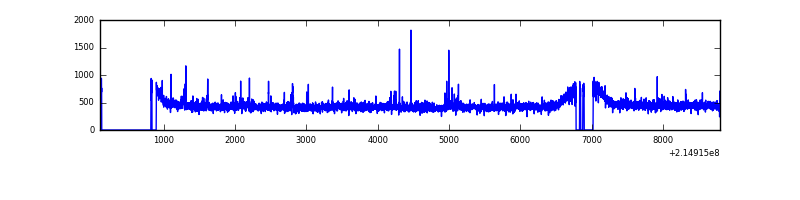 |
Top three noisy pixels from each quadrant. If the there are fewer than three noisy pixels in the level2.evt file, extra rows are filled as -1
| Pixel properties | Quadrant properties | ||||||
|---|---|---|---|---|---|---|---|
| Quadrant | DetID | PixID | Counts | Sigma | Mean | Median | Sigma |
| A | 7 | 16 | 17134 | 86.62 | 917 | 895 | 187.5 |
| A | 0 | 226 | 8950 | 42.97 | 917 | 895 | 187.5 |
| A | 12 | 194 | 8887 | 42.63 | 917 | 895 | 187.5 |
| B | 4 | 81 | 68907 | 379.07 | 928 | 903 | 179.4 |
| B | 15 | 204 | 39186 | 213.4 | 928 | 903 | 179.4 |
| B | 0 | 219 | 28977 | 156.49 | 928 | 903 | 179.4 |
| C | 8 | 128 | 16761 | 76.96 | 894 | 895 | 206.2 |
| C | 8 | 112 | 7956 | 34.25 | 894 | 895 | 206.2 |
| C | 13 | 61 | 7250 | 30.82 | 894 | 895 | 206.2 |
| D | 8 | 195 | 35618 | 159.61 | 890 | 860 | 217.8 |
| D | 12 | 233 | 23462 | 103.79 | 890 | 860 | 217.8 |
| D | 12 | 227 | 12830 | 54.97 | 890 | 860 | 217.8 |
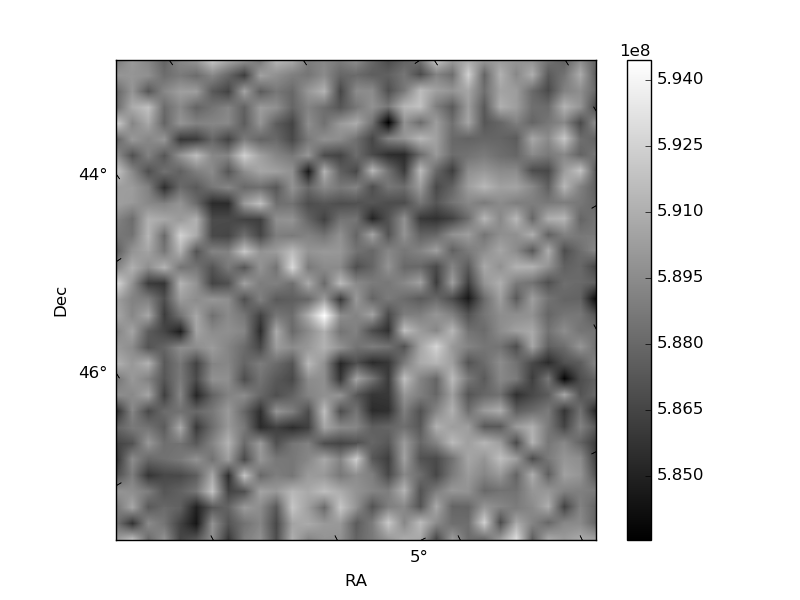
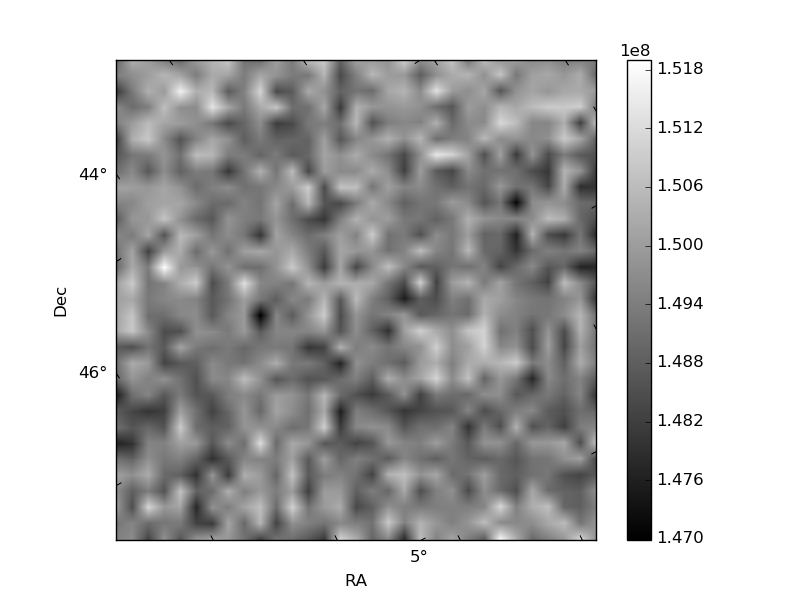
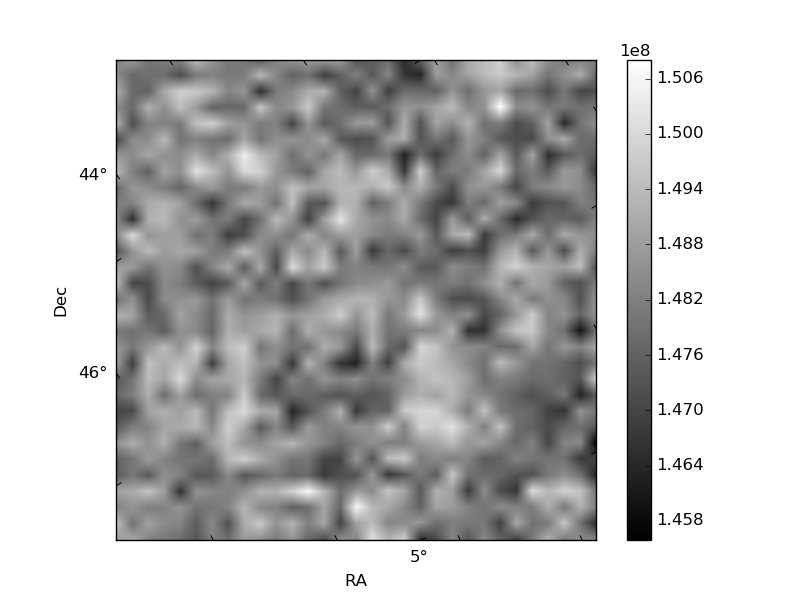
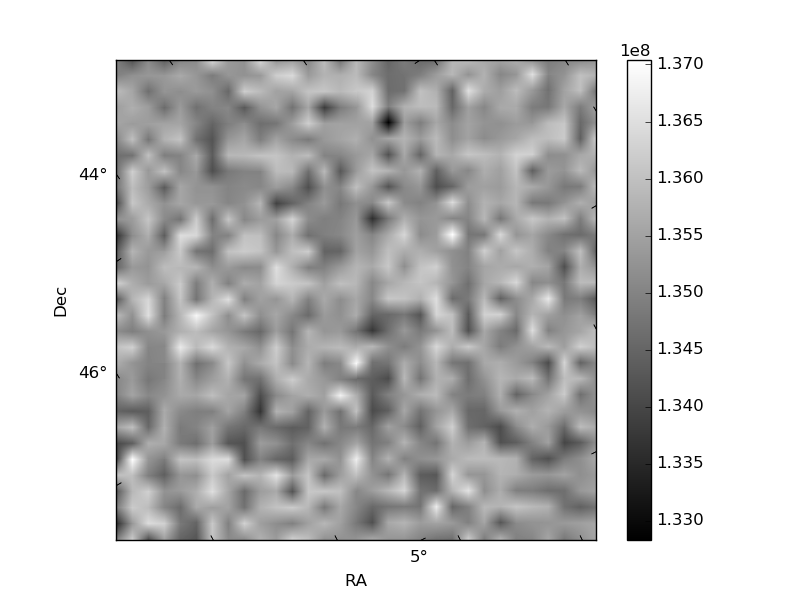
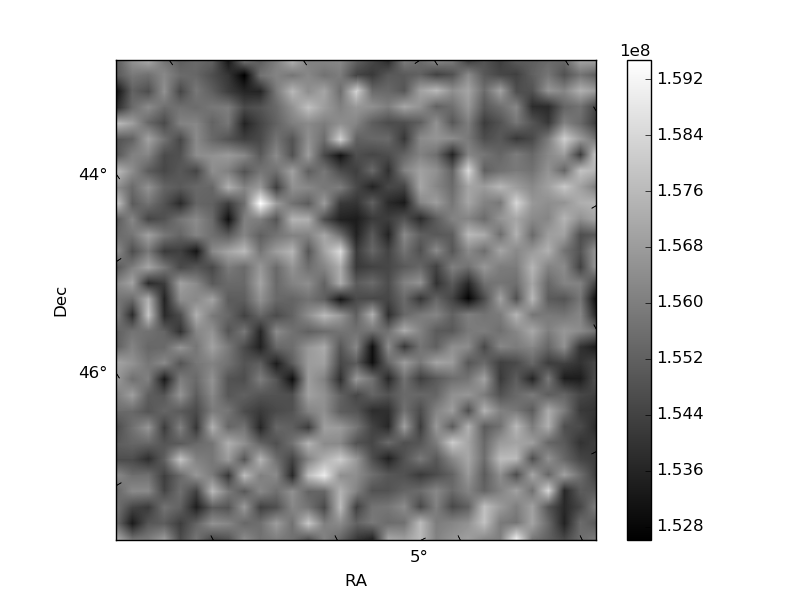
Histogram calculated using DETX and DETY for each event in the final _common_clean file
| Quadrant A | 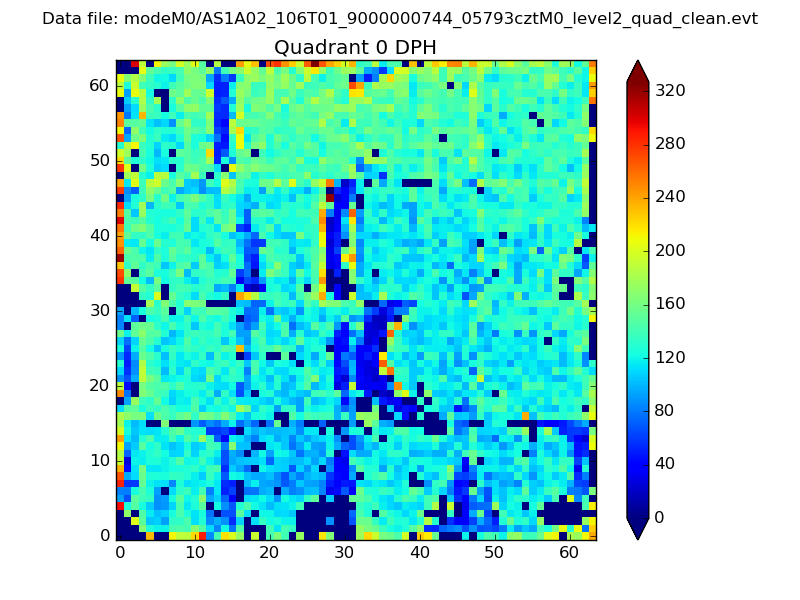 |
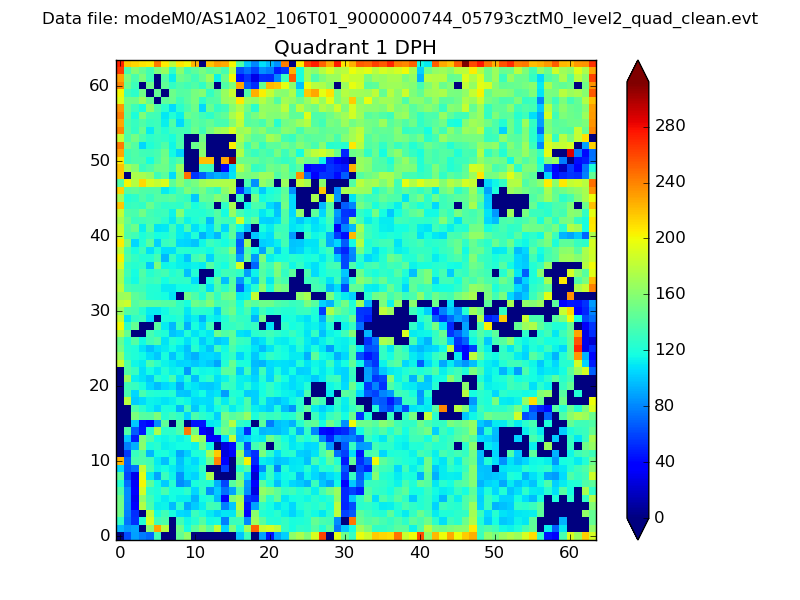 |
Quadrant B |
|---|---|---|---|
| Quadrant D | 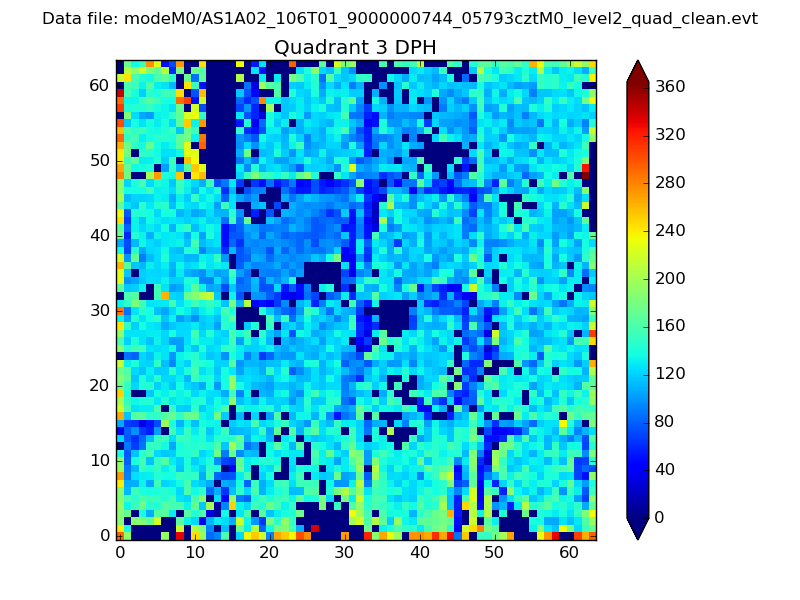 |
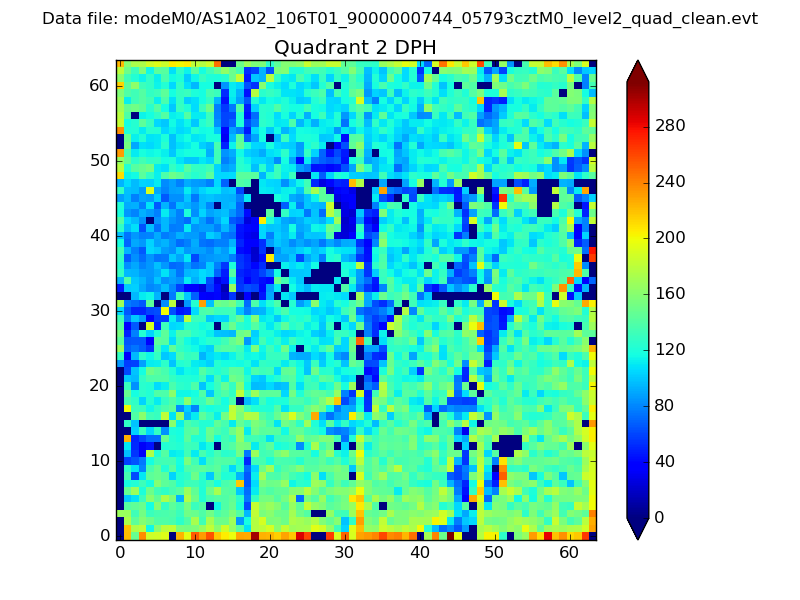 |
Quadrant C |
| Plot type | Count rate plots | Images |
|---|---|---|
| Comparison with Poisson distribution Blue bars denote a histogram of data divided into 1 sec bins. Red curve is a Poisson curve with rate = median count rate of data. |
 |
 |
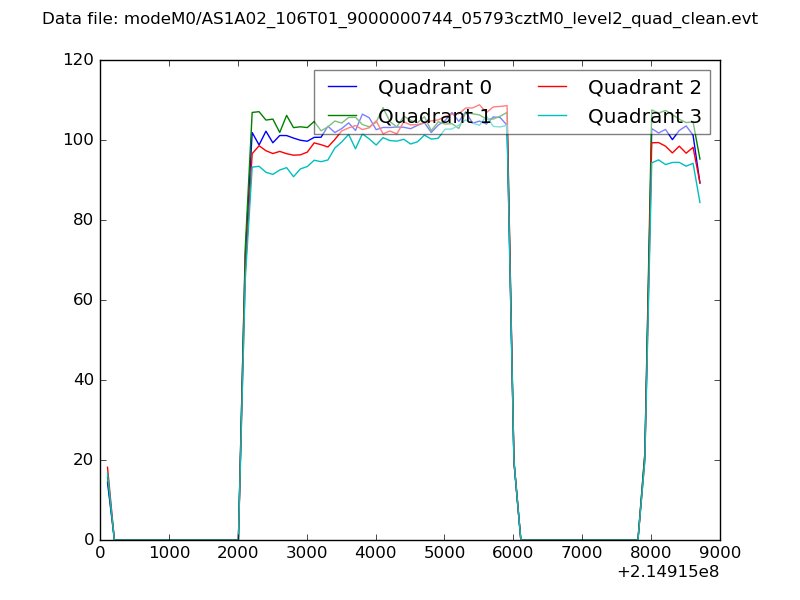
| Quadrant-wise count rates Data is divided into 100 sec bins |
 |
|
| Module-wise count rates for Quadrant A Data is divided into 100 sec bins |
 |
 |
| Module-wise count rates for Quadrant B Data is divided into 100 sec bins |
 |
 |
| Module-wise count rates for Quadrant C Data is divided into 100 sec bins |
 |
 |
| Module-wise count rates for Quadrant D Data is divided into 100 sec bins |
 |
 |
| Parameter | Plot |
|---|---|
| CZT HV Monitor |  |
| D_VDD | 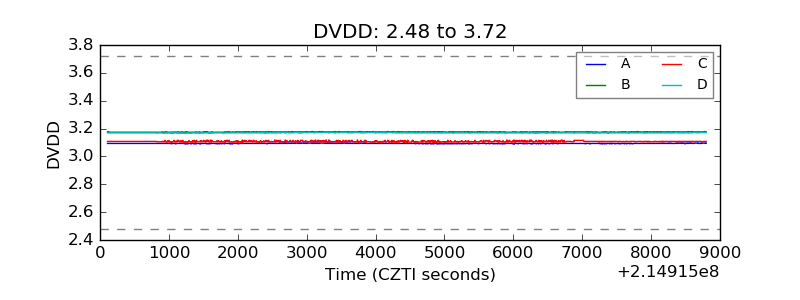 |
| Temperature 1 | 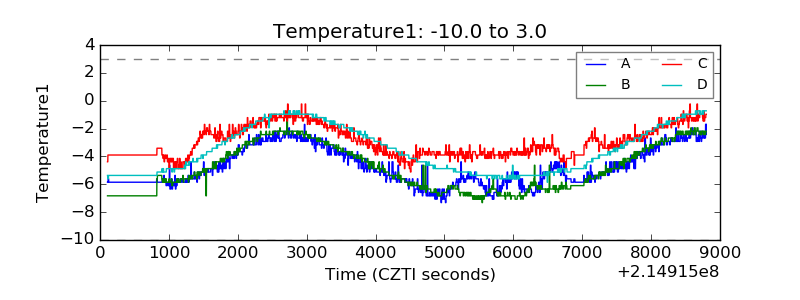 |
| Veto HV Monitor | 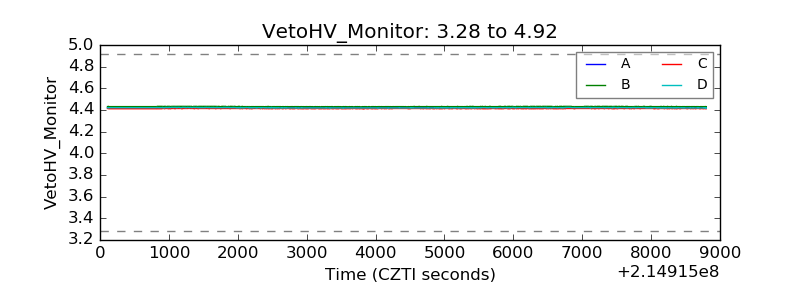 |
| Veto LLD | 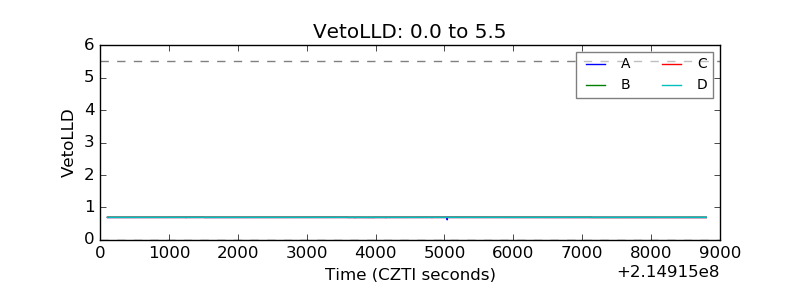 |
| Alpha Counter | 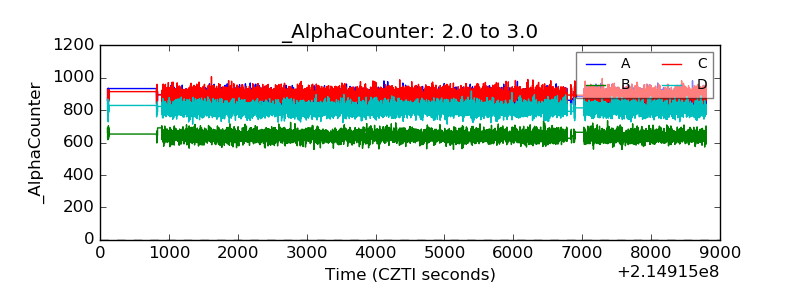 |
| _CPM_Rate | 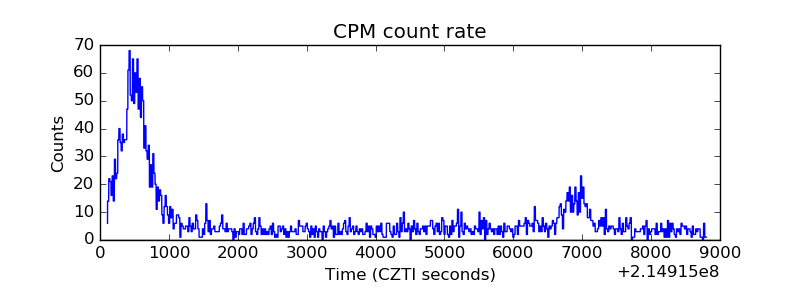 |
| CZT Counter | 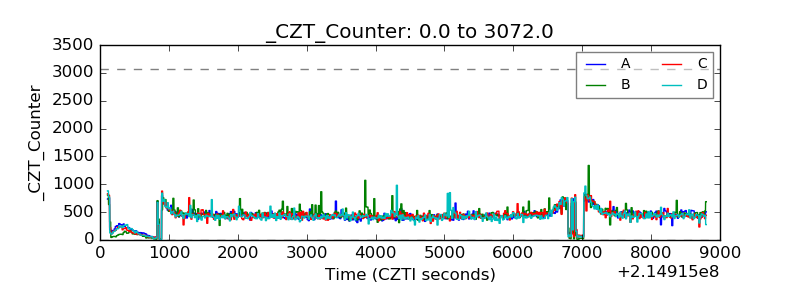 |
| +2.5 Volts monitor |  |
| +5 Volts monitor | 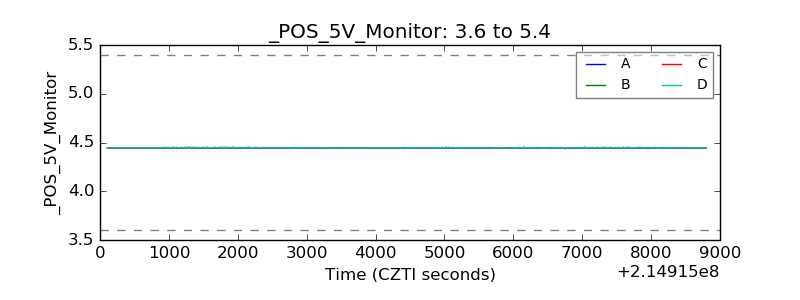 |
| _ROLL_ROT | 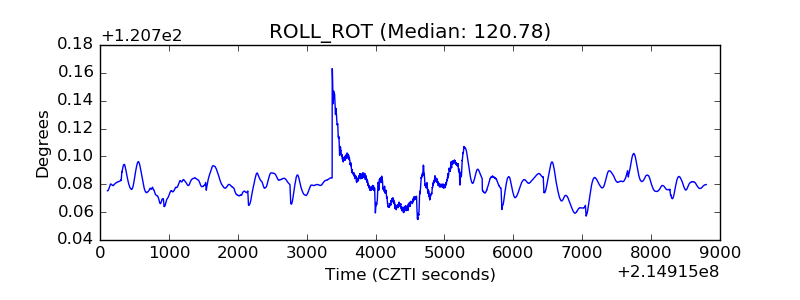 |
| _Roll_DEC | 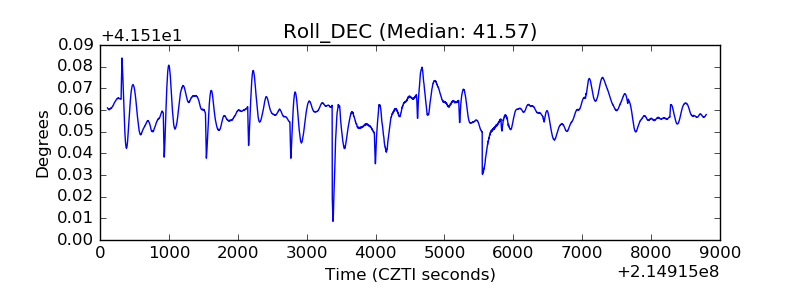 |
| _Roll_RA | 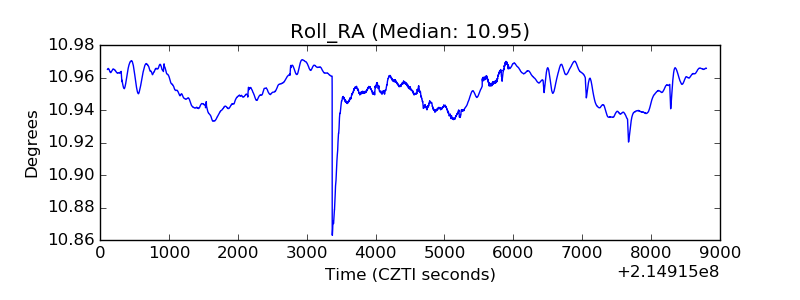 |
| Veto Counter |  |