| Param | Original file | Final file |
|---|---|---|
| Filename | modeM0/AS1A02_106T01_9000000744_05794cztM0_level2.evt | modeM0/AS1A02_106T01_9000000744_05794cztM0_level2_quad_clean.evt |
| Size (bytes) | 463,389,120 | 83,908,800 |
| Size | 441.9 MB | 80.0 MB |
| Events in quadrant A | 3,322,363 | 513,898 |
| Events in quadrant B | 3,589,247 | 522,619 |
| Events in quadrant C | 3,279,487 | 506,823 |
| Events in quadrant D | 3,346,016 | 489,098 |
| Mode M0 | |||
|---|---|---|---|
| Quadrant | BADHDUFLAG | Total packets | Discarded packets |
| A | 0 | 15046 | 7 |
| B | 0 | 15516 | 6 |
| C | 0 | 15032 | 6 |
| D | 0 | 15275 | 6 |
| Mode SS | |||
|---|---|---|---|
| Quadrant | BADHDUFLAG | Total packets | Discarded packets |
| A | 0 | 146 | 0 |
| B | 0 | 146 | 0 |
| C | 0 | 146 | 0 |
| D | 0 | 146 | 0 |
| Quadrant | Total seconds | Saturated seconds | Saturation percentage |
|---|---|---|---|
| A | 7303 | 109 | 1.492537% |
| B | 7303 | 125 | 1.711625% |
| C | 7303 | 56 | 0.766808% |
| D | 7303 | 58 | 0.794194% |
Noise dominated data is calculated using 1-second bins in cleaned event files. If a bin has >2000 counts, and if more than 50% of those come from <1% of pixels, then it is considered to be noise-dominated and hence unusable.
| Quadrant | # 1 sec bins | Bins with >0 counts | Bins with >2000 counts | High rate bins dominated by noise | Noise dominated (total time) | Noise dominated (detector-on time) | Marked lightcurve |
|---|---|---|---|---|---|---|---|
| A | 7306 | 7306 | 0 | 0 | 0.00% | 0.00% | 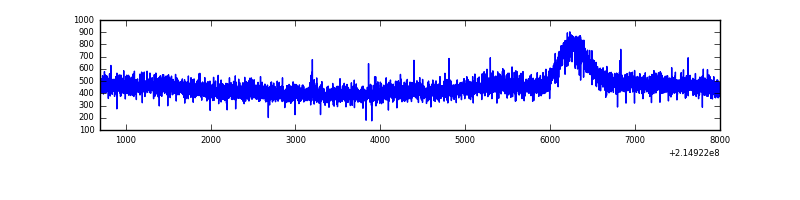 |
| B | 7306 | 7306 | 7 | 7 | 0.10% | 0.10% | 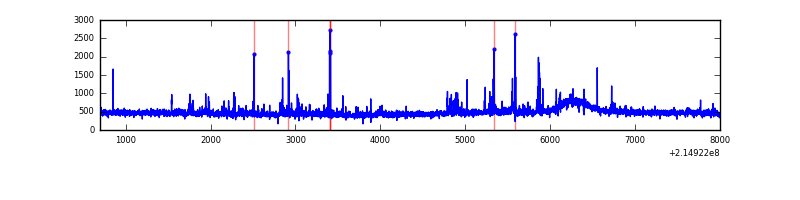 |
| C | 7306 | 7306 | 0 | 0 | 0.00% | 0.00% |  |
| D | 7306 | 7306 | 1 | 1 | 0.01% | 0.01% | 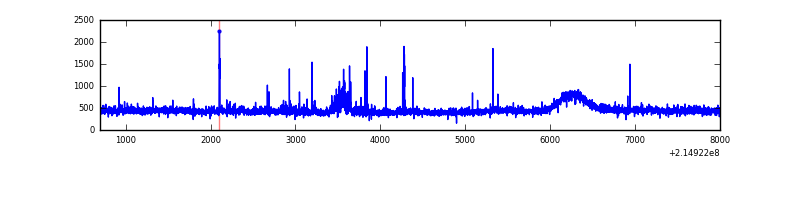 |
Top three noisy pixels from each quadrant. If the there are fewer than three noisy pixels in the level2.evt file, extra rows are filled as -1
| Pixel properties | Quadrant properties | ||||||
|---|---|---|---|---|---|---|---|
| Quadrant | DetID | PixID | Counts | Sigma | Mean | Median | Sigma |
| A | 0 | 226 | 8544 | 43.36 | 861 | 842 | 177.6 |
| A | 12 | 194 | 8396 | 42.53 | 861 | 842 | 177.6 |
| A | 13 | 14 | 4161 | 18.69 | 861 | 842 | 177.6 |
| B | 4 | 81 | 82599 | 486.74 | 870 | 847 | 168.0 |
| B | 15 | 85 | 80535 | 474.45 | 870 | 847 | 168.0 |
| B | 15 | 204 | 30162 | 174.54 | 870 | 847 | 168.0 |
| C | 13 | 61 | 6673 | 30.01 | 840 | 842 | 194.3 |
| C | 1 | 16 | 2696 | 9.54 | 840 | 842 | 194.3 |
| C | 3 | 202 | 2004 | 5.98 | 840 | 842 | 194.3 |
| D | 12 | 233 | 105457 | 504.09 | 840 | 811 | 207.6 |
| D | 8 | 195 | 39051 | 184.2 | 840 | 811 | 207.6 |
| D | 7 | 203 | 14833 | 67.54 | 840 | 811 | 207.6 |
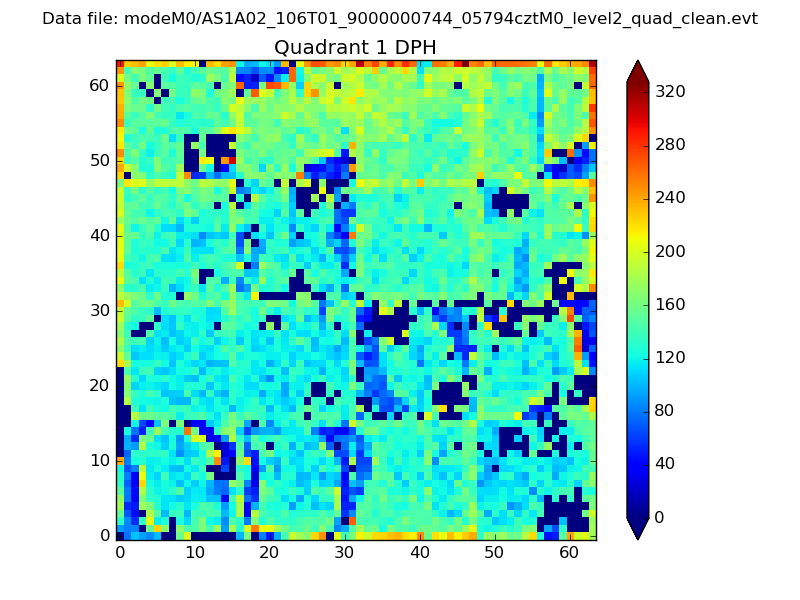
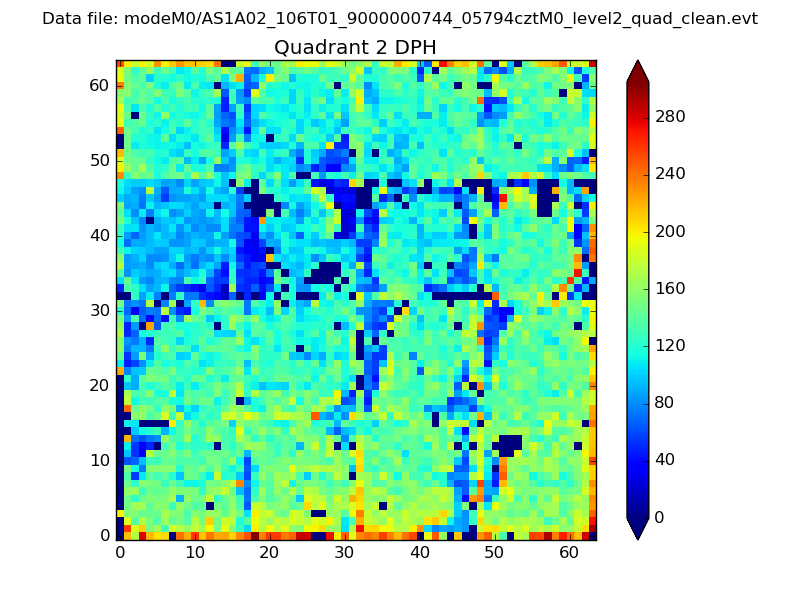
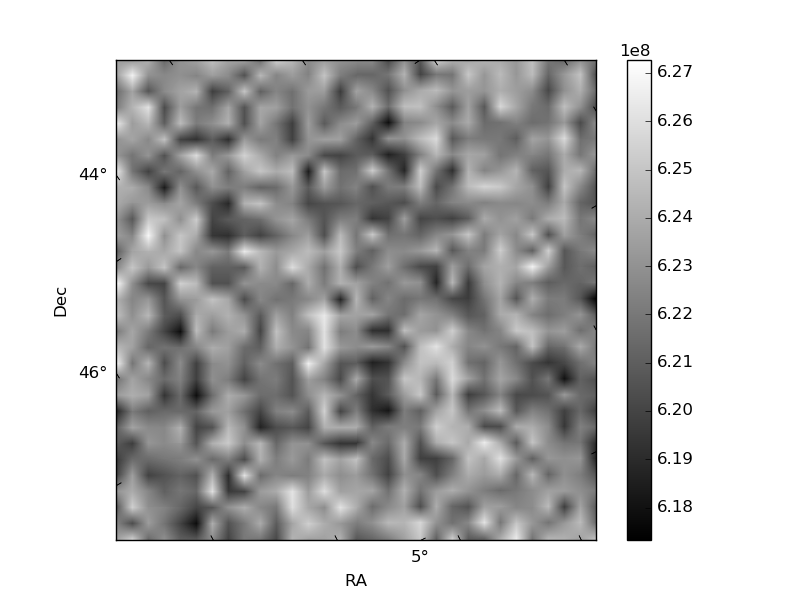
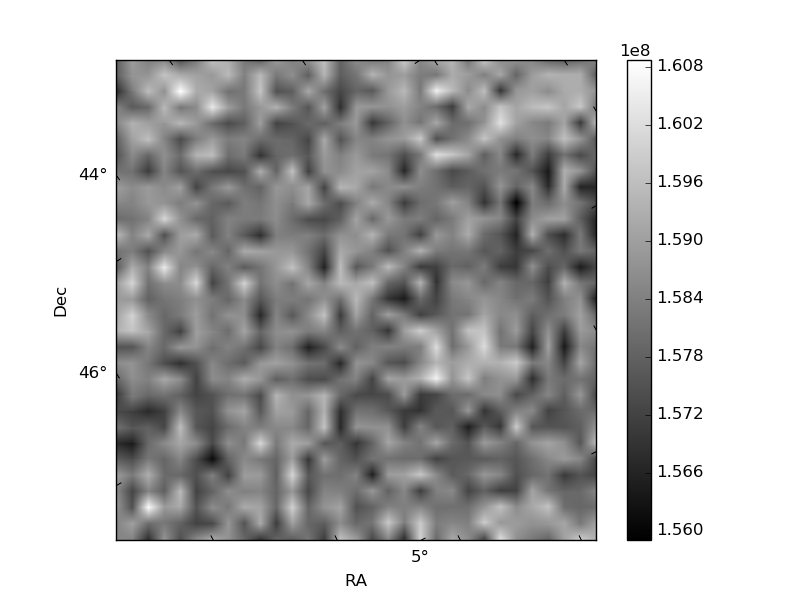
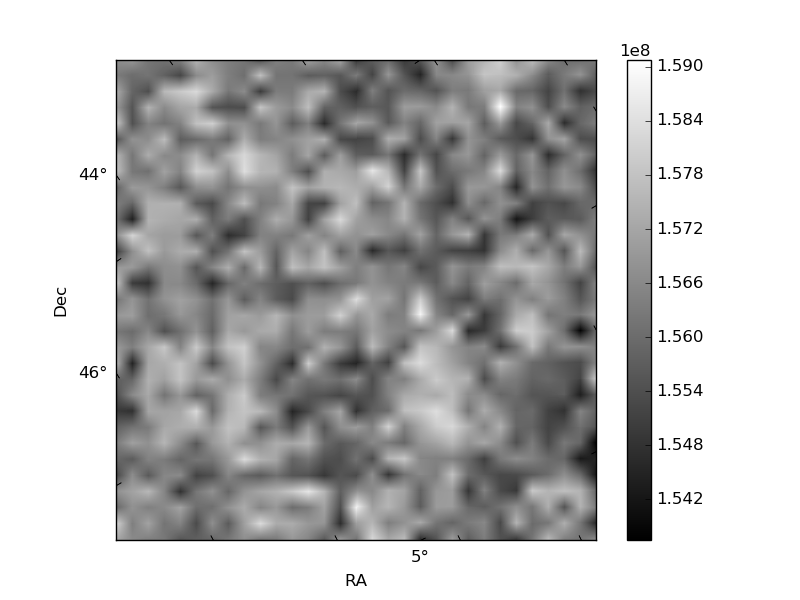
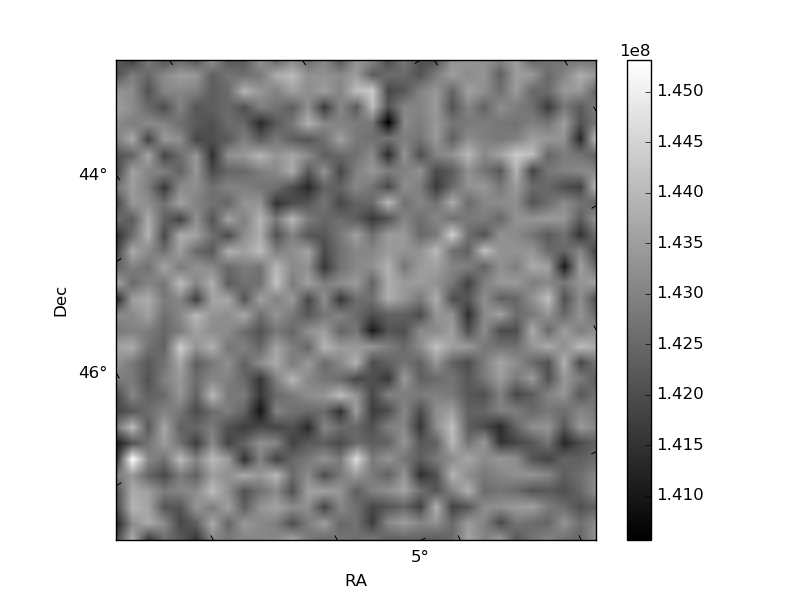
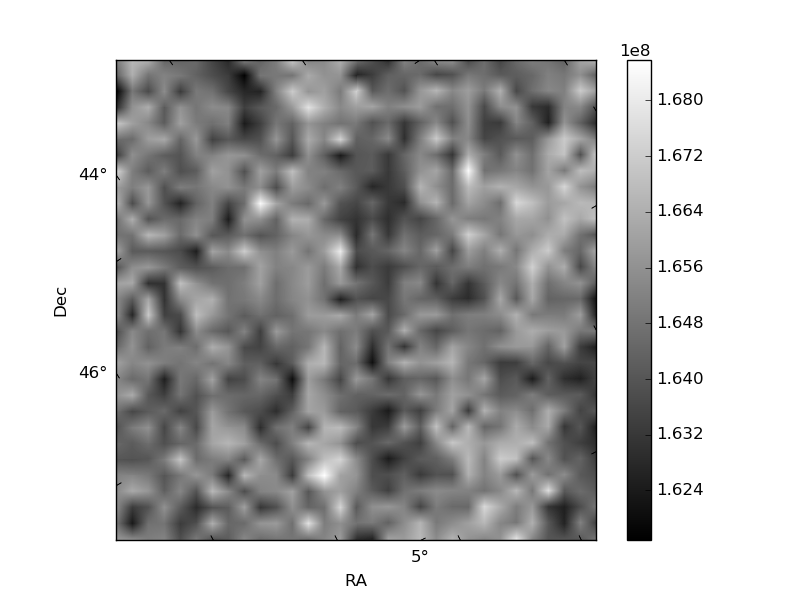
Histogram calculated using DETX and DETY for each event in the final _common_clean file
| Quadrant A | 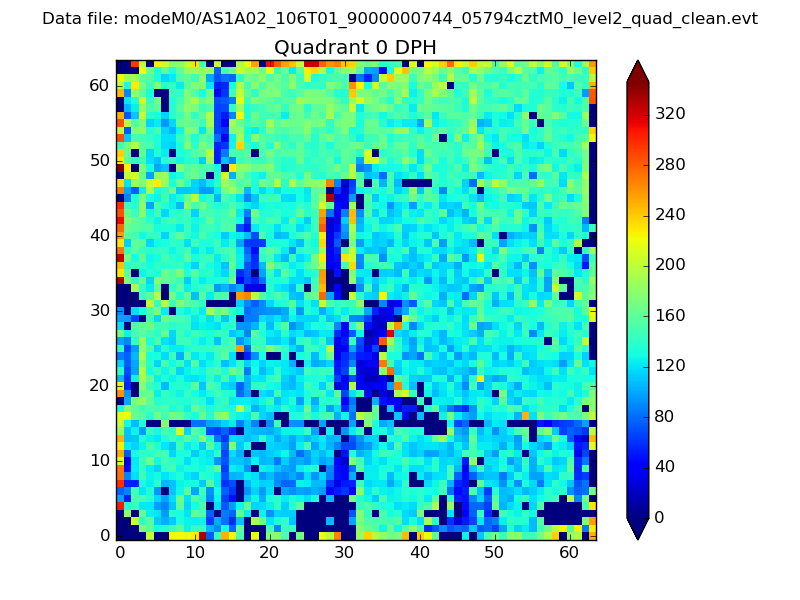 |
 |
Quadrant B |
|---|---|---|---|
| Quadrant D | 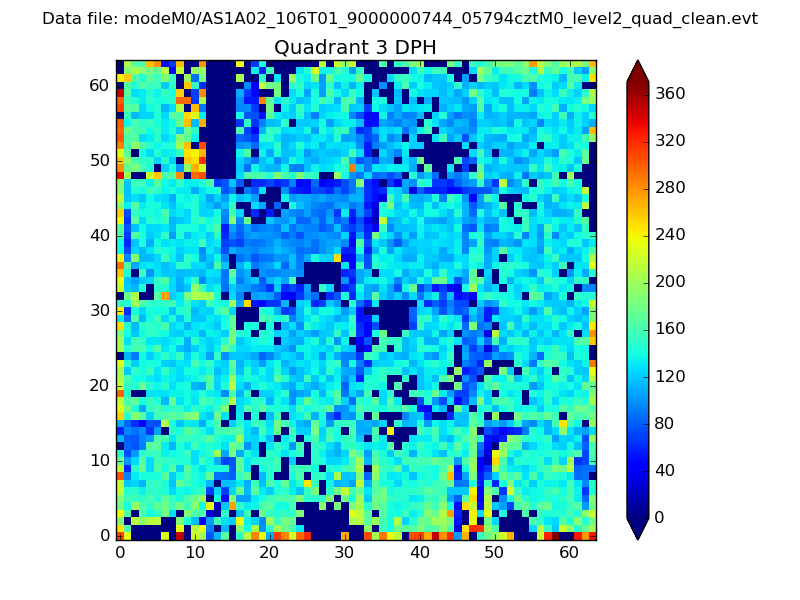 |
 |
Quadrant C |
| Plot type | Count rate plots | Images |
|---|---|---|
| Comparison with Poisson distribution Blue bars denote a histogram of data divided into 1 sec bins. Red curve is a Poisson curve with rate = median count rate of data. |
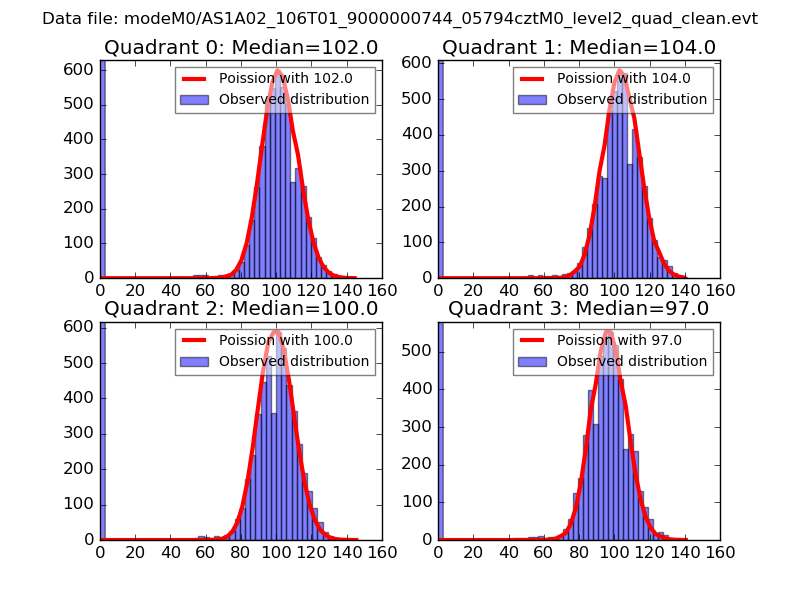 |
 |
| Quadrant-wise count rates Data is divided into 100 sec bins |
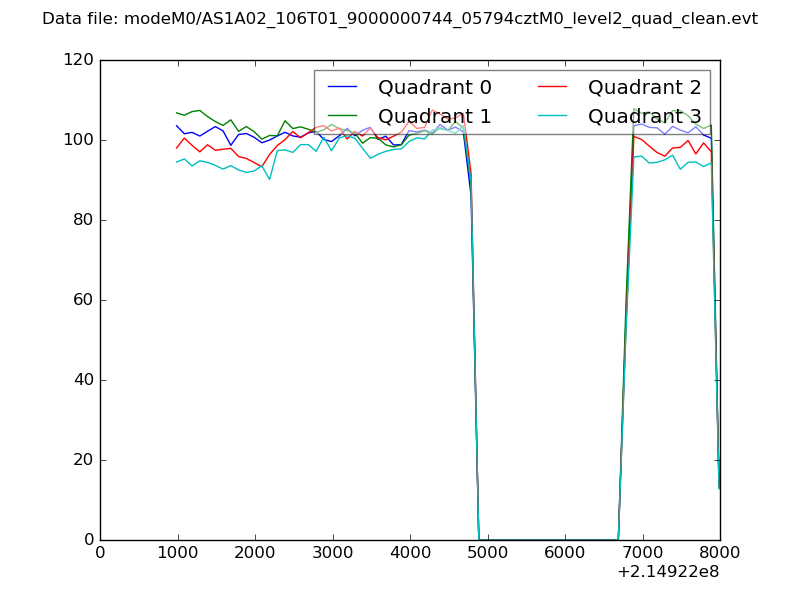 |
|
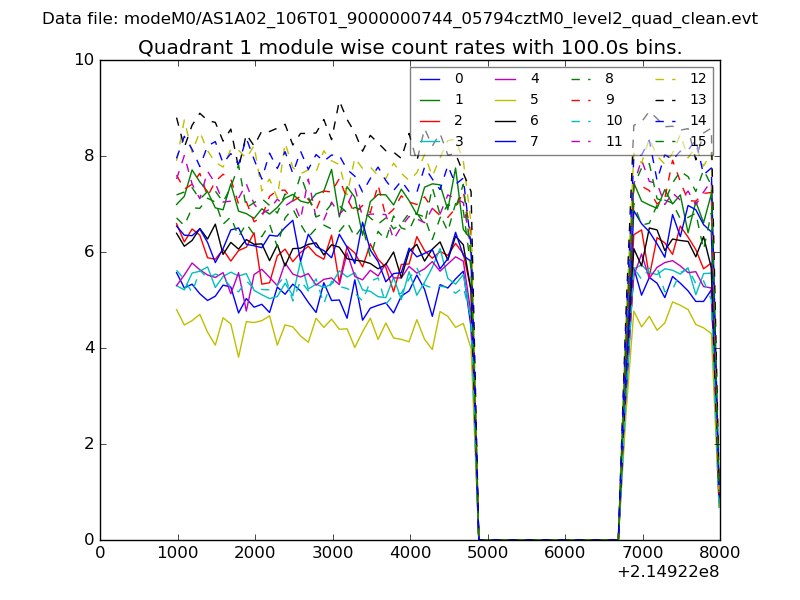
| Module-wise count rates for Quadrant A Data is divided into 100 sec bins |
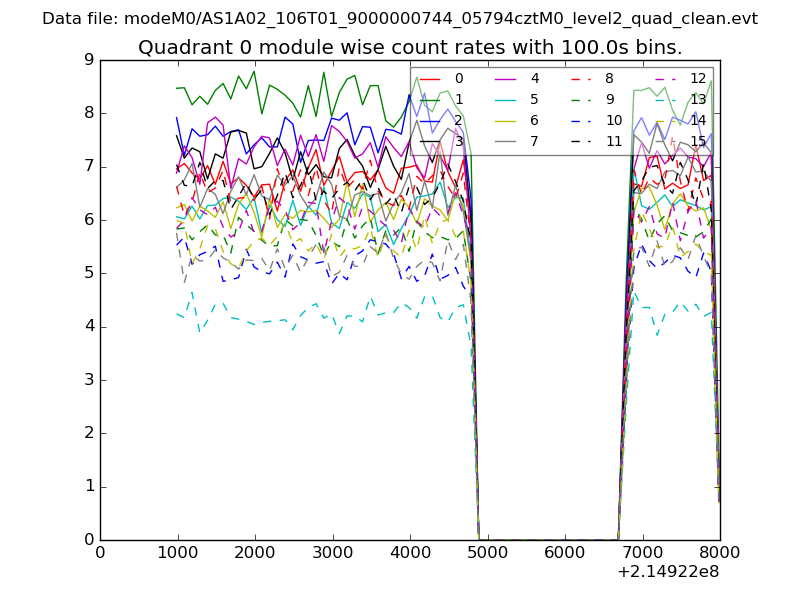 |
 |
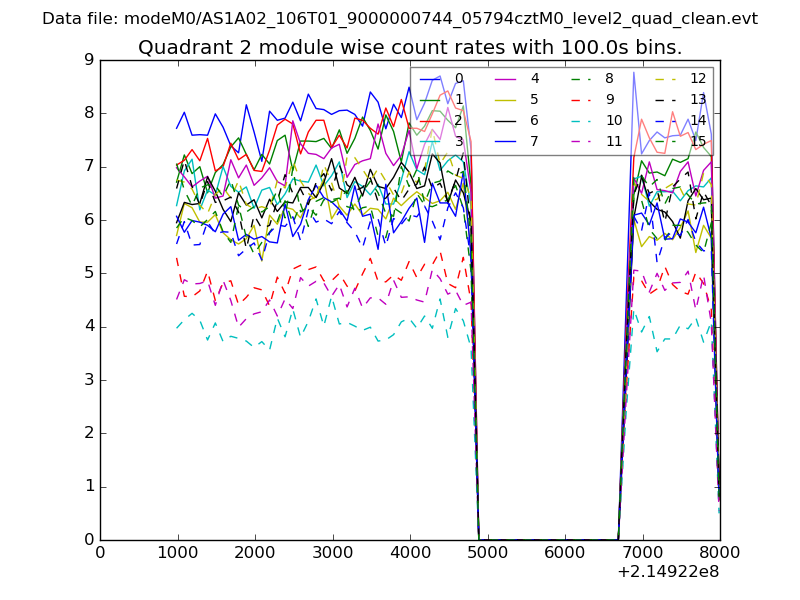
| Module-wise count rates for Quadrant B Data is divided into 100 sec bins |
 |
 |
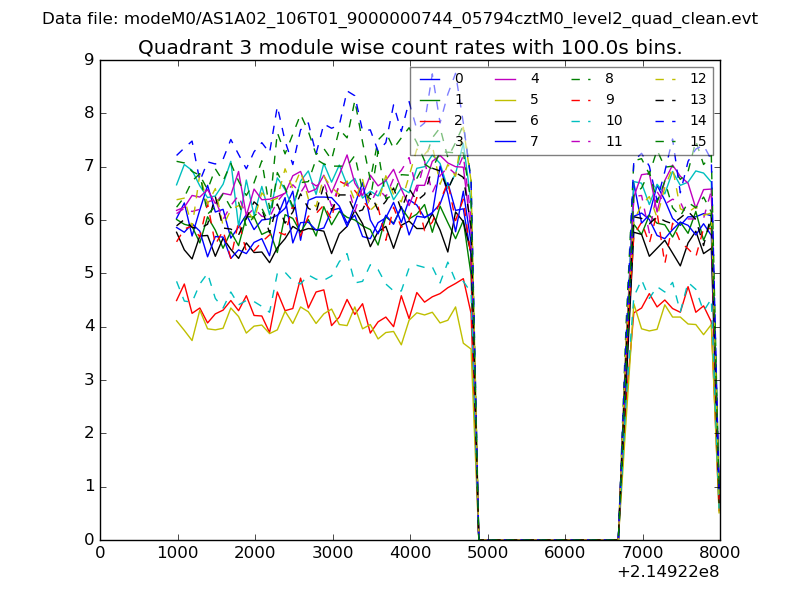
| Module-wise count rates for Quadrant C Data is divided into 100 sec bins |
 |
 |
| Module-wise count rates for Quadrant D Data is divided into 100 sec bins |
 |
 |
| Parameter | Plot |
|---|---|
| CZT HV Monitor | 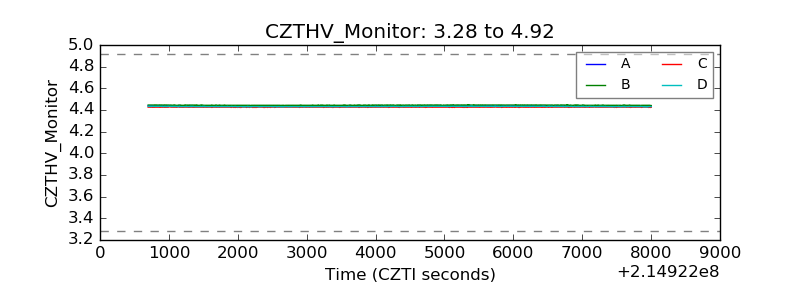 |
| D_VDD | 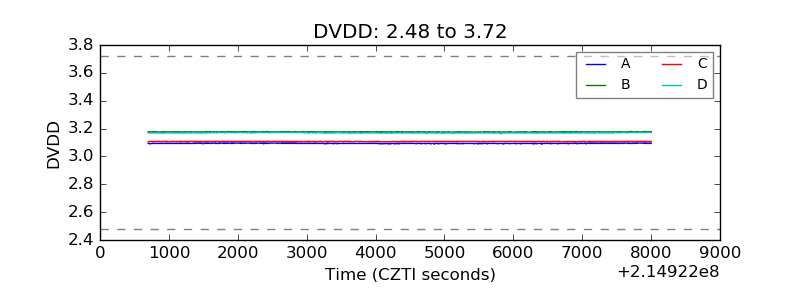 |
| Temperature 1 | 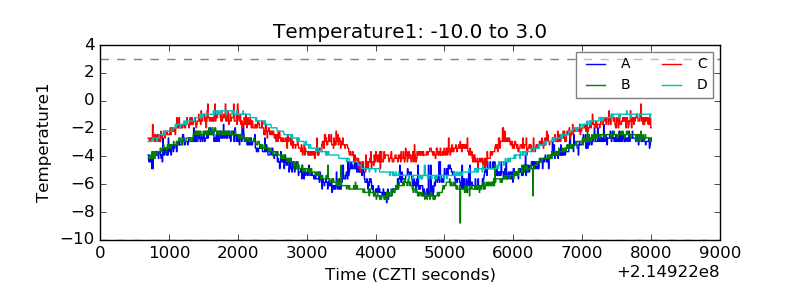 |
| Veto HV Monitor |  |
| Veto LLD | 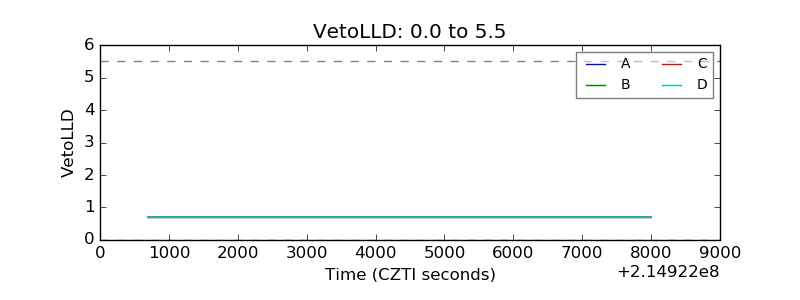 |
| Alpha Counter | 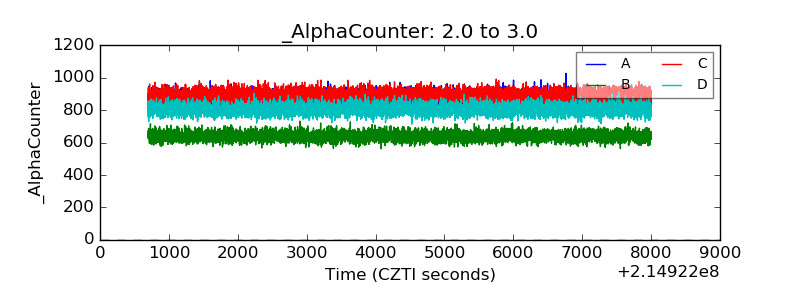 |
| _CPM_Rate | 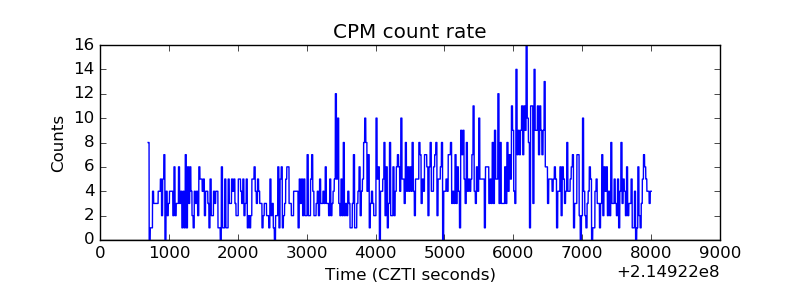 |
| CZT Counter | 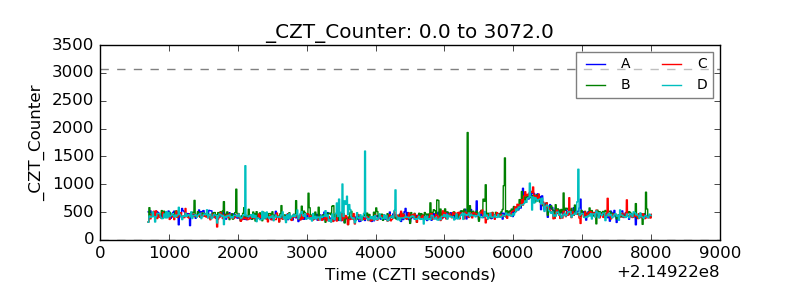 |
| +2.5 Volts monitor |  |
| +5 Volts monitor |  |
| _ROLL_ROT | 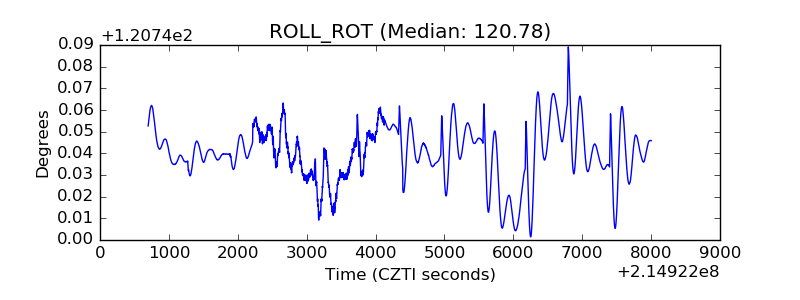 |
| _Roll_DEC | 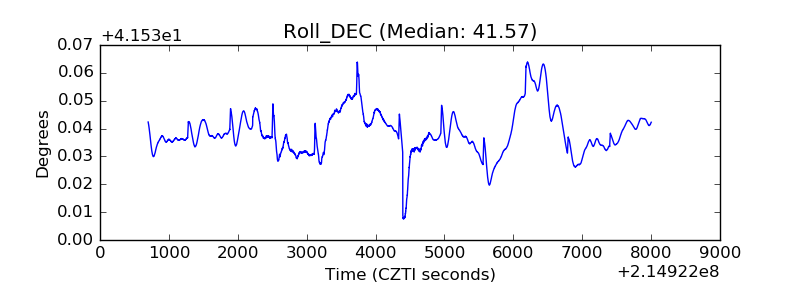 |
| _Roll_RA | 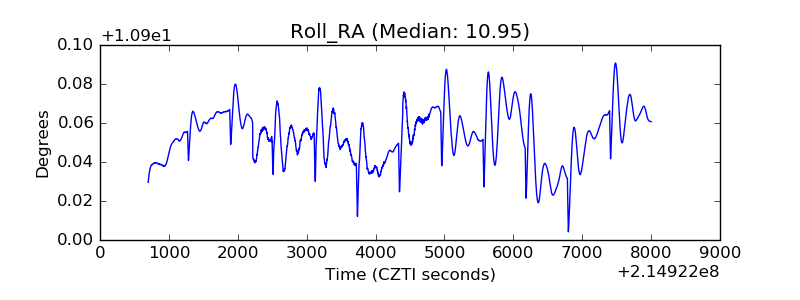 |
| Veto Counter | 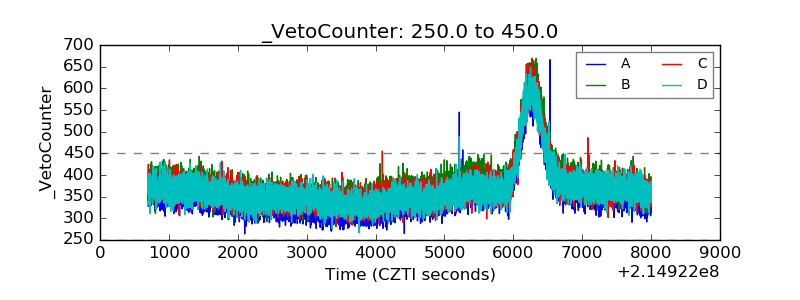 |