| Param | Original file | Final file |
|---|---|---|
| Filename | modeM0/AS1A02_106T01_9000000744_05797cztM0_level2.evt | modeM0/AS1A02_106T01_9000000744_05797cztM0_level2_quad_clean.evt |
| Size (bytes) | 873,869,760 | 149,031,360 |
| Size | 833.4 MB | 142.1 MB |
| Events in quadrant A | 5,757,860 | 912,118 |
| Events in quadrant B | 6,120,646 | 926,882 |
| Events in quadrant C | 5,729,226 | 916,936 |
| Events in quadrant D | 7,978,996 | 861,338 |
| Mode M9 | |||
|---|---|---|---|
| Quadrant | BADHDUFLAG | Total packets | Discarded packets |
| A | 0 | 11 | 0 |
| B | 0 | 11 | 0 |
| C | 0 | 11 | 0 |
| D | 0 | 11 | 0 |
| Mode M0 | |||
|---|---|---|---|
| Quadrant | BADHDUFLAG | Total packets | Discarded packets |
| A | 0 | 26538 | 55 |
| B | 0 | 27086 | 42 |
| C | 0 | 26467 | 42 |
| D | 0 | 33286 | 43 |
| Mode SS | |||
|---|---|---|---|
| Quadrant | BADHDUFLAG | Total packets | Discarded packets |
| A | 0 | 262 | 0 |
| B | 0 | 262 | 0 |
| C | 0 | 262 | 0 |
| D | 0 | 262 | 0 |
| Quadrant | Total seconds | Saturated seconds | Saturation percentage |
|---|---|---|---|
| A | 12962 | 118 | 0.910353% |
| B | 12968 | 125 | 0.963911% |
| C | 12966 | 99 | 0.763535% |
| D | 12975 | 833 | 6.420039% |
Noise dominated data is calculated using 1-second bins in cleaned event files. If a bin has >2000 counts, and if more than 50% of those come from <1% of pixels, then it is considered to be noise-dominated and hence unusable.
| Quadrant | # 1 sec bins | Bins with >0 counts | Bins with >2000 counts | High rate bins dominated by noise | Noise dominated (total time) | Noise dominated (detector-on time) | Marked lightcurve |
|---|---|---|---|---|---|---|---|
| A | 14051 | 12988 | 1 | 1 | 0.01% | 0.01% | 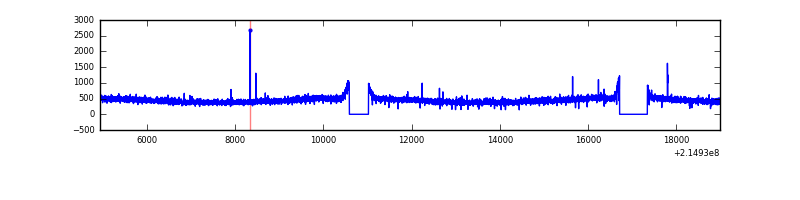 |
| B | 14051 | 12988 | 16 | 16 | 0.11% | 0.12% | 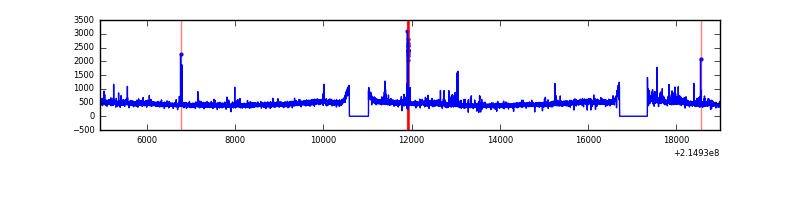 |
| C | 14051 | 12988 | 0 | 0 | 0.00% | 0.00% | 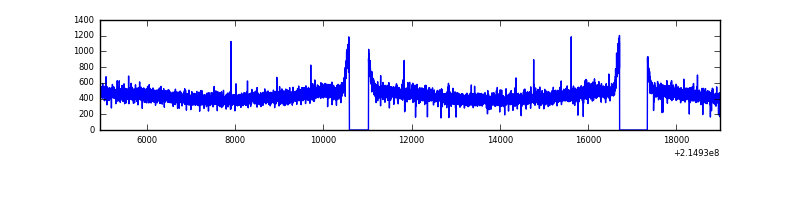 |
| D | 14051 | 12987 | 593 | 593 | 4.22% | 4.57% | 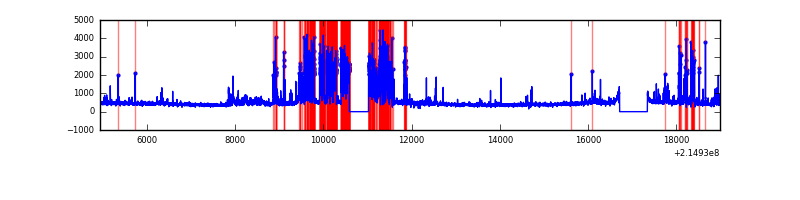 |
Top three noisy pixels from each quadrant. If the there are fewer than three noisy pixels in the level2.evt file, extra rows are filled as -1
| Pixel properties | Quadrant properties | ||||||
|---|---|---|---|---|---|---|---|
| Quadrant | DetID | PixID | Counts | Sigma | Mean | Median | Sigma |
| A | 0 | 226 | 14576 | 43.28 | 1485 | 1451 | 303.3 |
| A | 15 | 79 | 14485 | 42.98 | 1485 | 1451 | 303.3 |
| A | 12 | 194 | 14381 | 42.63 | 1485 | 1451 | 303.3 |
| B | 4 | 81 | 104781 | 358.78 | 1503 | 1465 | 288.0 |
| B | 15 | 204 | 74208 | 252.61 | 1503 | 1465 | 288.0 |
| B | 4 | 239 | 44148 | 148.22 | 1503 | 1465 | 288.0 |
| C | 8 | 128 | 15449 | 41.48 | 1459 | 1463 | 337.1 |
| C | 13 | 61 | 11606 | 30.09 | 1459 | 1463 | 337.1 |
| C | 8 | 112 | 8219 | 20.04 | 1459 | 1463 | 337.1 |
| D | 7 | 203 | 1955972 | 5615.85 | 1407 | 1363 | 348.1 |
| D | 11 | 241 | 375895 | 1076.08 | 1407 | 1363 | 348.1 |
| D | 12 | 110 | 124089 | 352.61 | 1407 | 1363 | 348.1 |
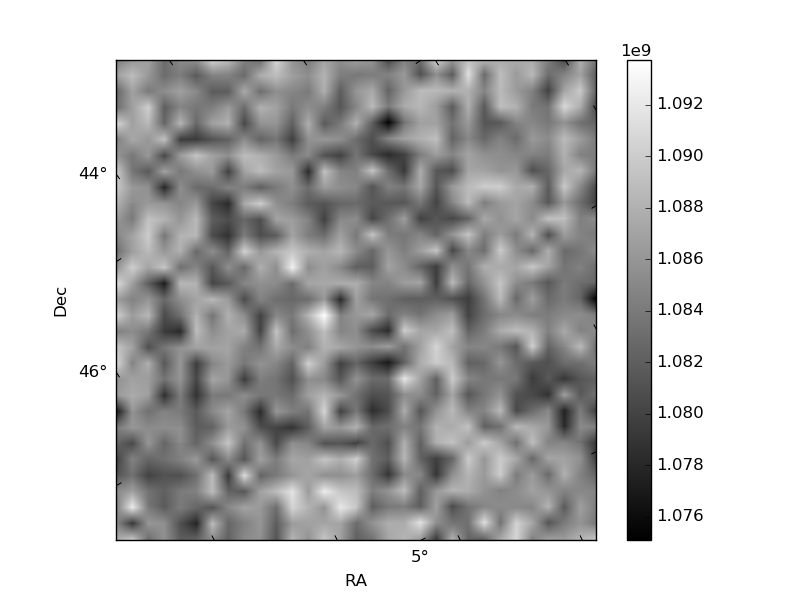
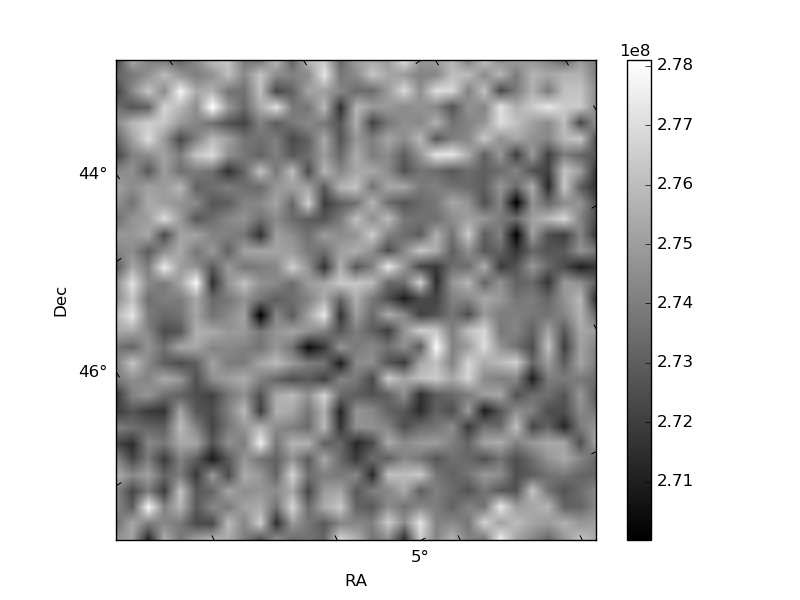
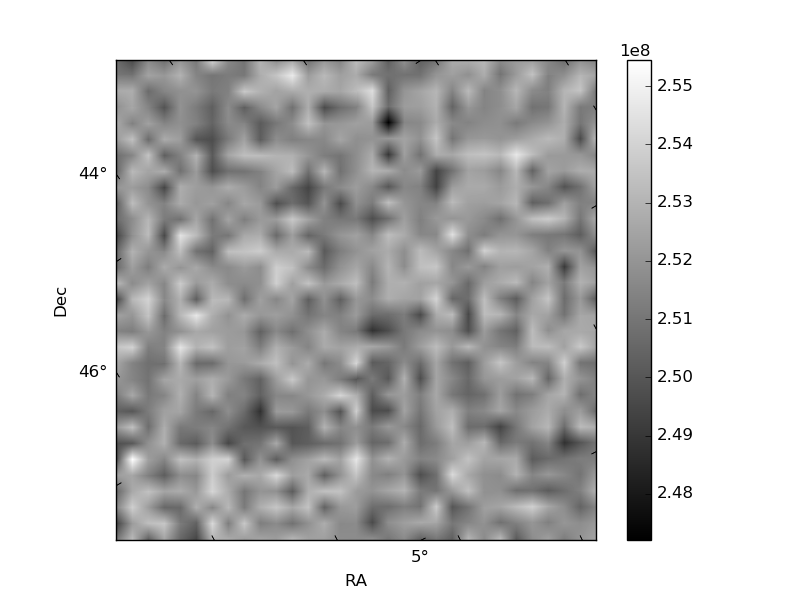
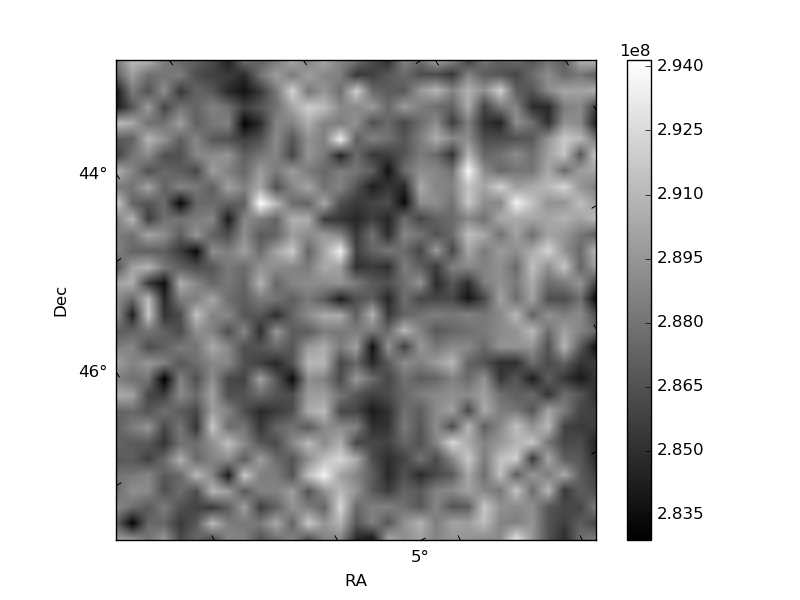
Histogram calculated using DETX and DETY for each event in the final _common_clean file
| Quadrant A | 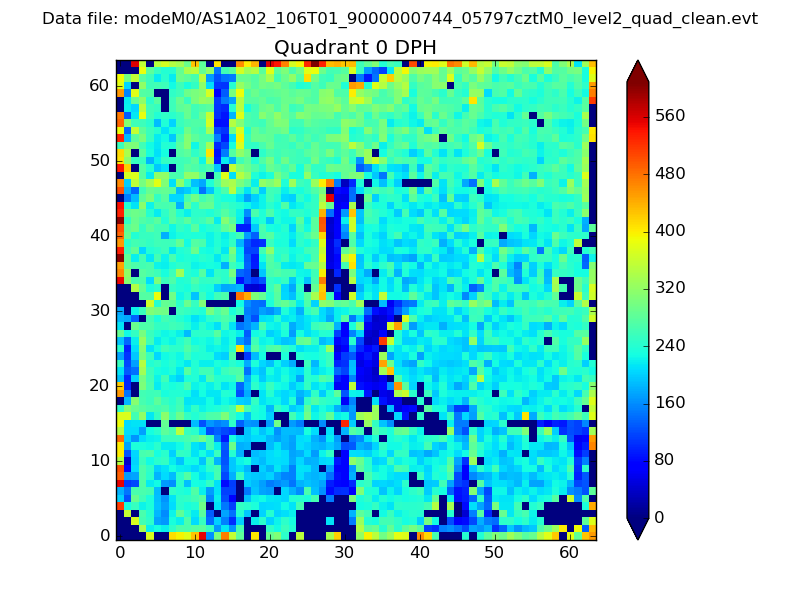 |
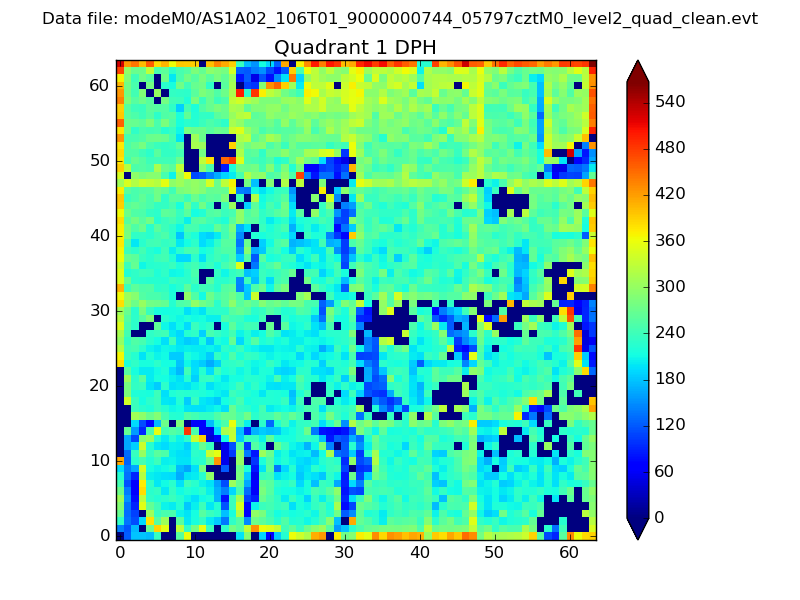 |
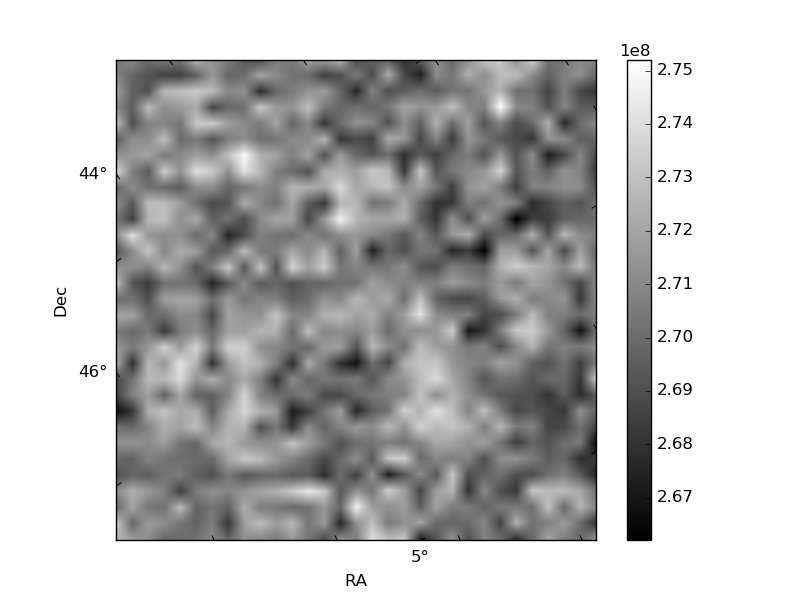
Quadrant B |
|---|---|---|---|
| Quadrant D | 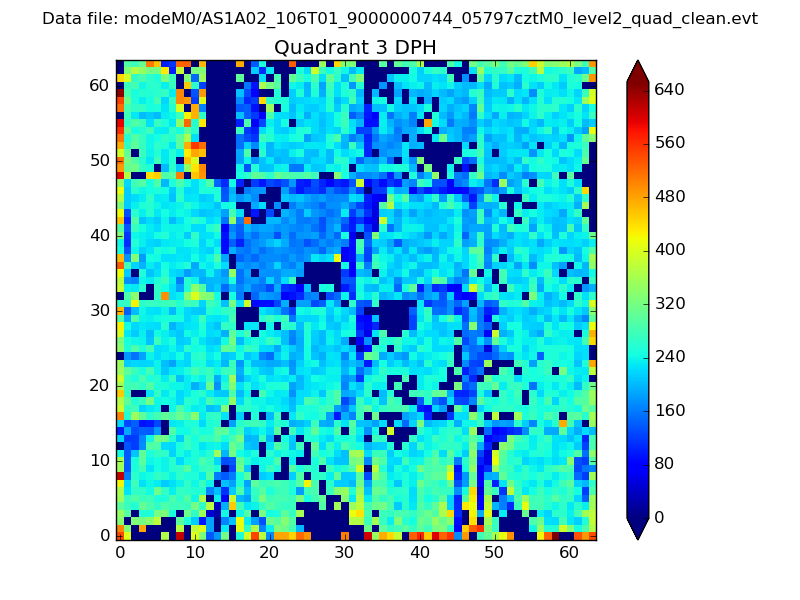 |
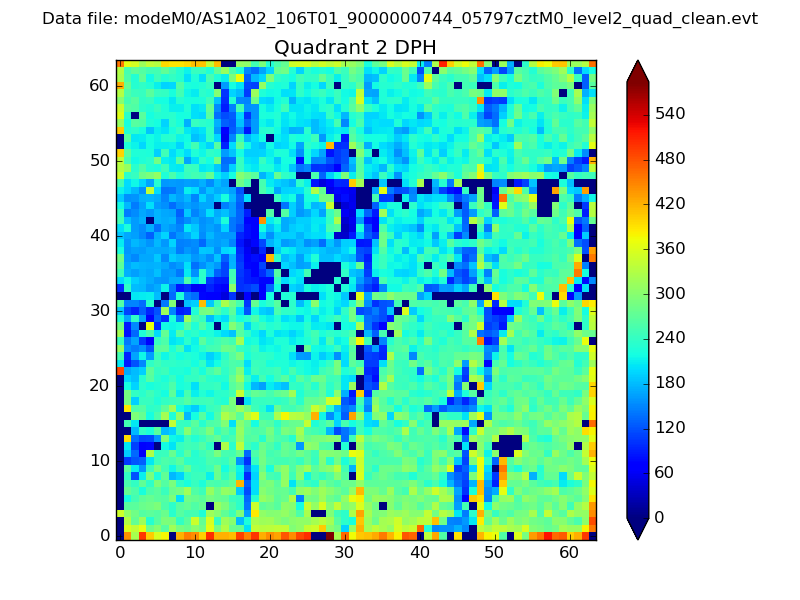 |
Quadrant C |
| Plot type | Count rate plots | Images |
|---|---|---|
| Comparison with Poisson distribution Blue bars denote a histogram of data divided into 1 sec bins. Red curve is a Poisson curve with rate = median count rate of data. |
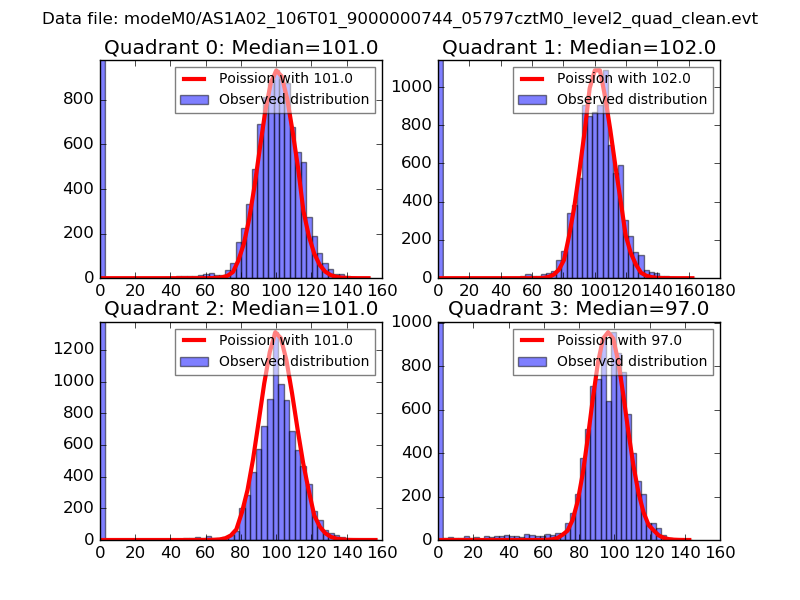 |
 |
| Quadrant-wise count rates Data is divided into 100 sec bins |
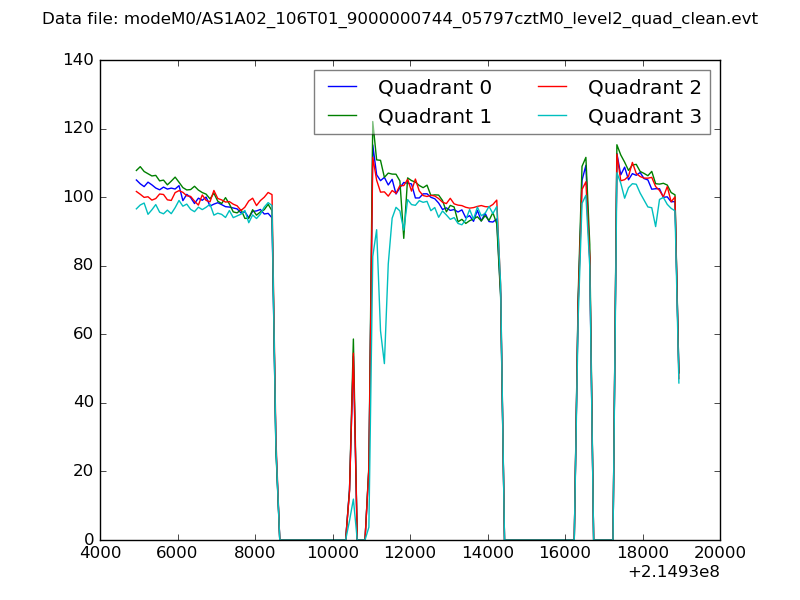 |
|
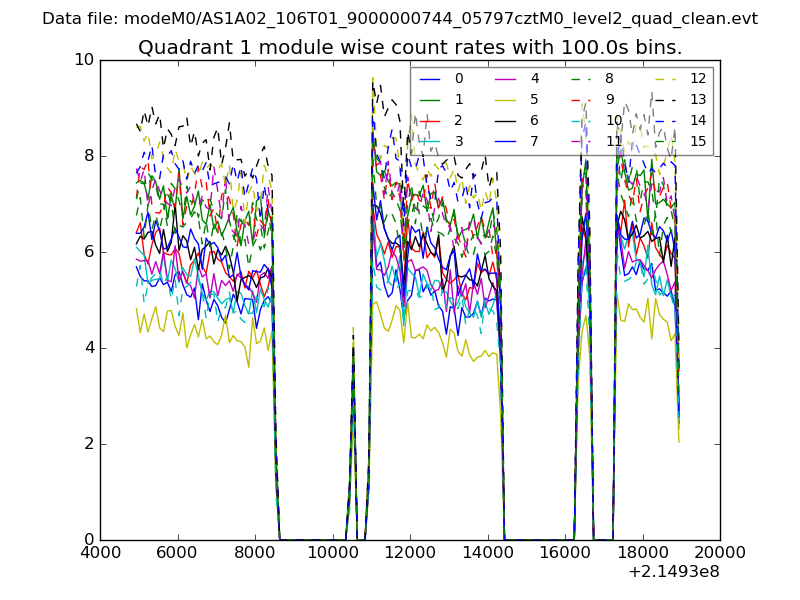
| Module-wise count rates for Quadrant A Data is divided into 100 sec bins |
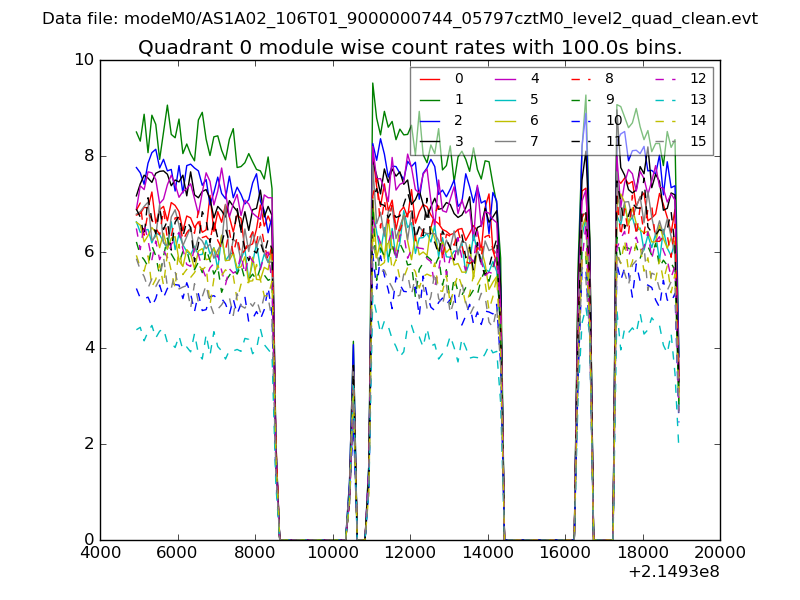 |
 |
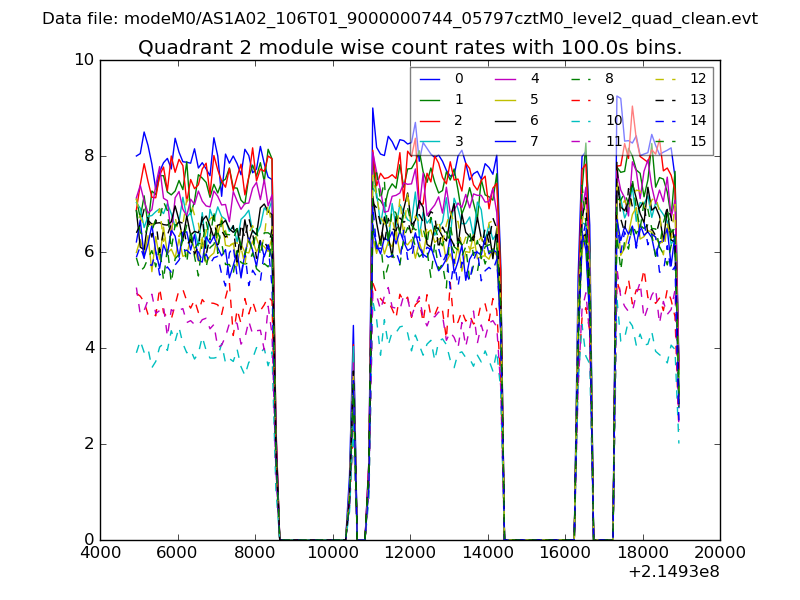
| Module-wise count rates for Quadrant B Data is divided into 100 sec bins |
 |
 |
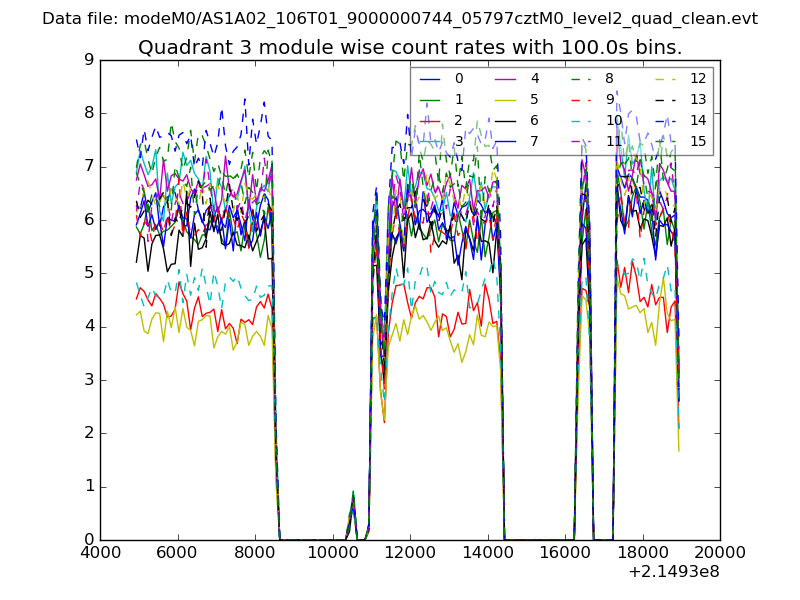
| Module-wise count rates for Quadrant C Data is divided into 100 sec bins |
 |
 |
| Module-wise count rates for Quadrant D Data is divided into 100 sec bins |
 |
 |
| Parameter | Plot |
|---|---|
| CZT HV Monitor | 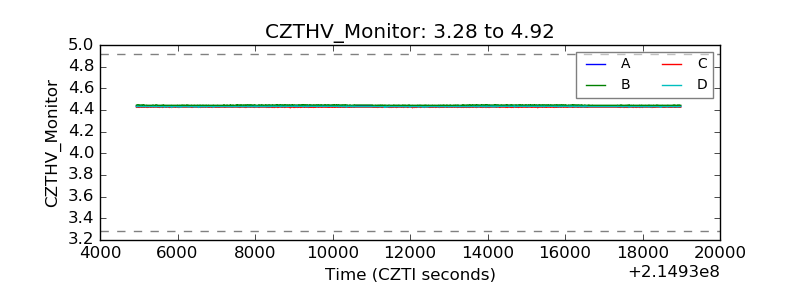 |
| D_VDD | 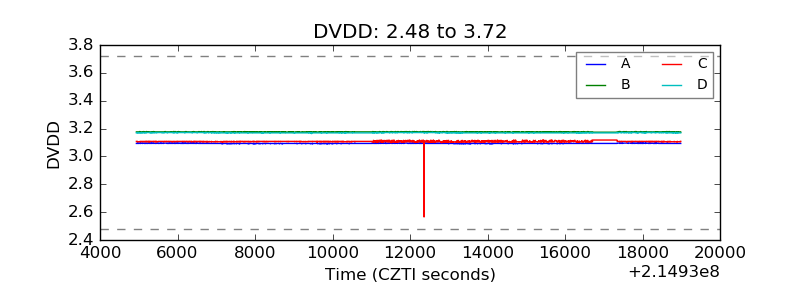 |
| Temperature 1 | 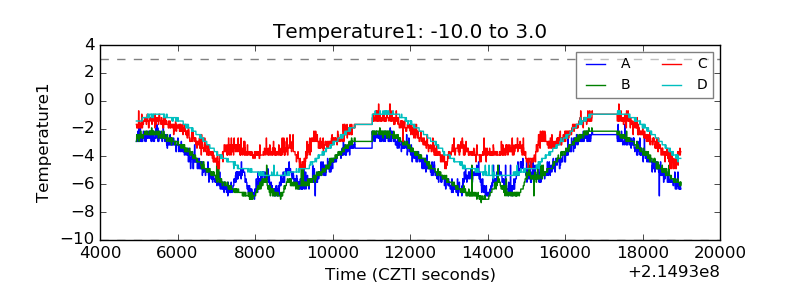 |
| Veto HV Monitor | 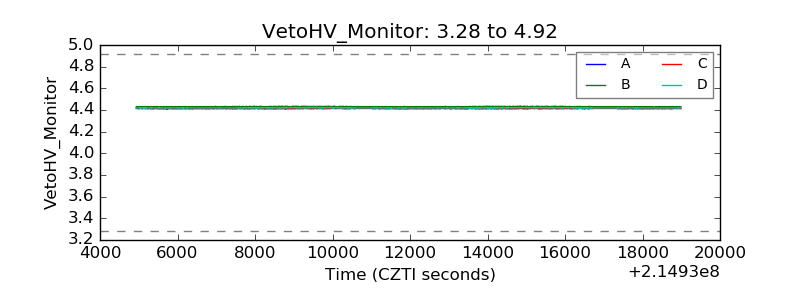 |
| Veto LLD | 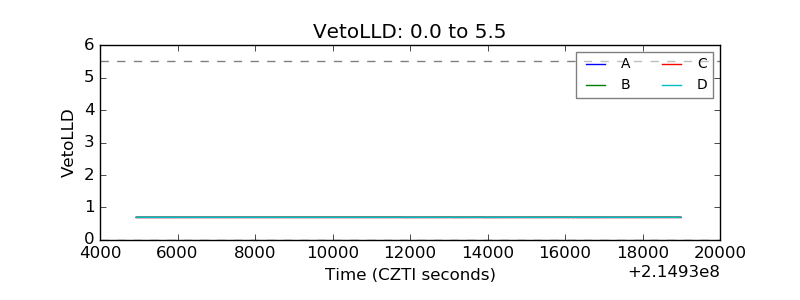 |
| Alpha Counter | 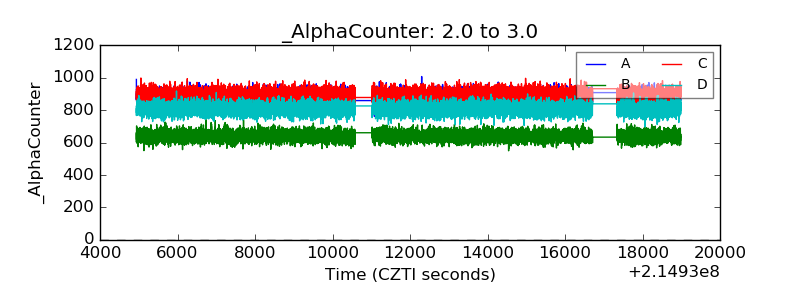 |
| _CPM_Rate | 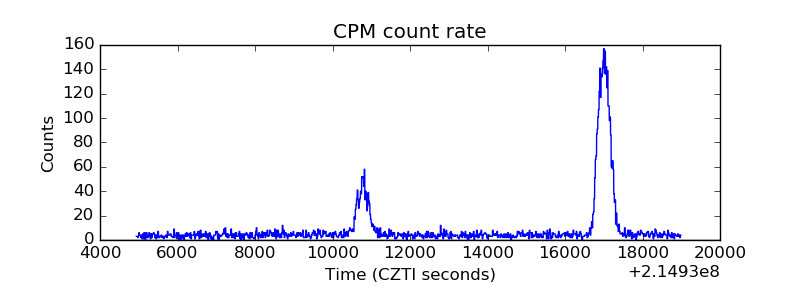 |
| CZT Counter | 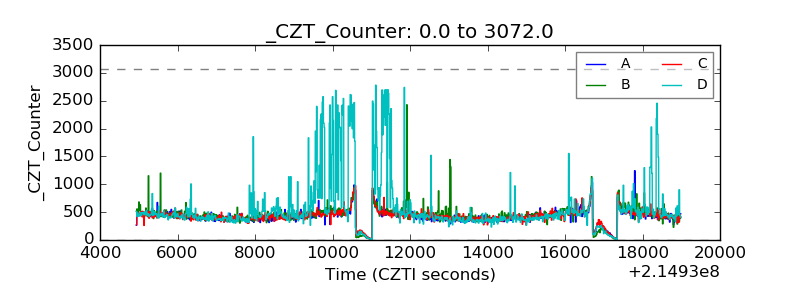 |
| +2.5 Volts monitor |  |
| +5 Volts monitor |  |
| _ROLL_ROT | 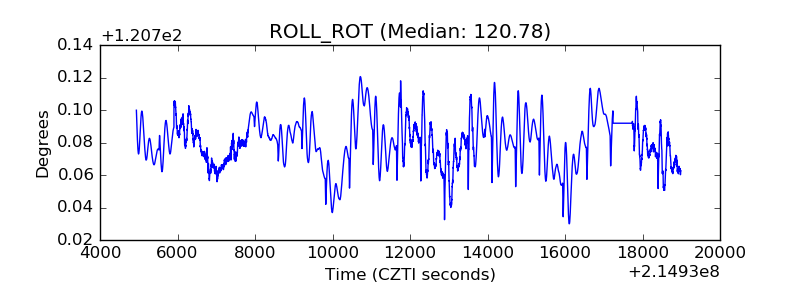 |
| _Roll_DEC | 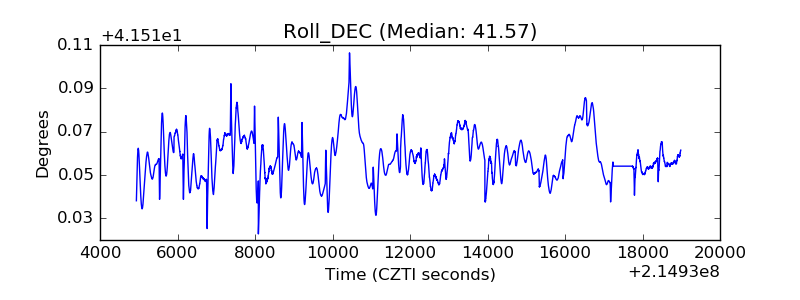 |
| _Roll_RA | 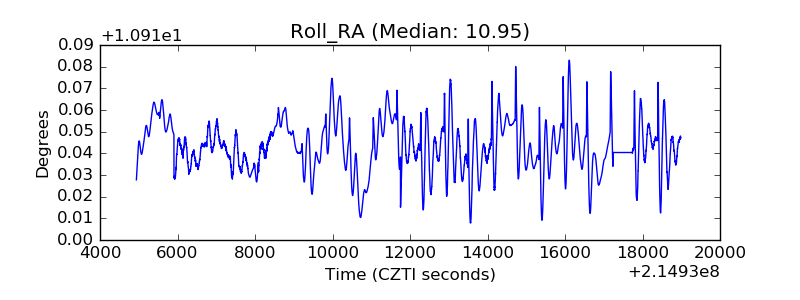 |
| Veto Counter | 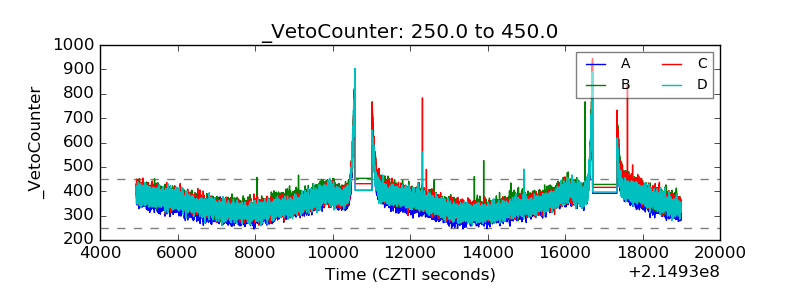 |