| Param | Original file | Final file |
|---|---|---|
| Filename | modeM0/AS1A02_106T01_9000000744_05801cztM0_level2.evt | modeM0/AS1A02_106T01_9000000744_05801cztM0_level2_quad_clean.evt |
| Size (bytes) | 113,520,960 | 28,431,360 |
| Size | 108.3 MB | 27.1 MB |
| Events in quadrant A | 746,603 | 183,435 |
| Events in quadrant B | 819,637 | 187,928 |
| Events in quadrant C | 763,019 | 187,184 |
| Events in quadrant D | 990,148 | 176,947 |
| Mode M9 | |||
|---|---|---|---|
| Quadrant | BADHDUFLAG | Total packets | Discarded packets |
| A | 0 | 3 | 0 |
| B | 0 | 3 | 0 |
| C | 0 | 3 | 0 |
| D | 0 | 4 | 0 |
| Mode M0 | |||
|---|---|---|---|
| Quadrant | BADHDUFLAG | Total packets | Discarded packets |
| A | 0 | 3457 | 1 |
| B | 0 | 3618 | 1 |
| C | 0 | 3457 | 1 |
| D | 0 | 4106 | 1 |
| Mode SS | |||
|---|---|---|---|
| Quadrant | BADHDUFLAG | Total packets | Discarded packets |
| A | 0 | 34 | 0 |
| B | 0 | 34 | 0 |
| C | 0 | 34 | 0 |
| D | 0 | 34 | 0 |
| Quadrant | Total seconds | Saturated seconds | Saturation percentage |
|---|---|---|---|
| A | 1704 | 1 | 0.058685% |
| B | 1704 | 3 | 0.176056% |
| C | 1704 | 2 | 0.117371% |
| D | 1704 | 10 | 0.586854% |
Noise dominated data is calculated using 1-second bins in cleaned event files. If a bin has >2000 counts, and if more than 50% of those come from <1% of pixels, then it is considered to be noise-dominated and hence unusable.
| Quadrant | # 1 sec bins | Bins with >0 counts | Bins with >2000 counts | High rate bins dominated by noise | Noise dominated (total time) | Noise dominated (detector-on time) | Marked lightcurve |
|---|---|---|---|---|---|---|---|
| A | 1704 | 1704 | 0 | 0 | 0.00% | 0.00% | 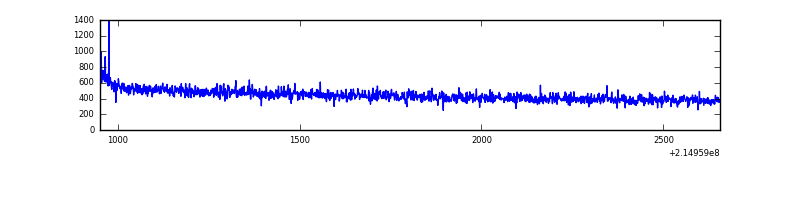 |
| B | 1704 | 1704 | 1 | 1 | 0.06% | 0.06% | 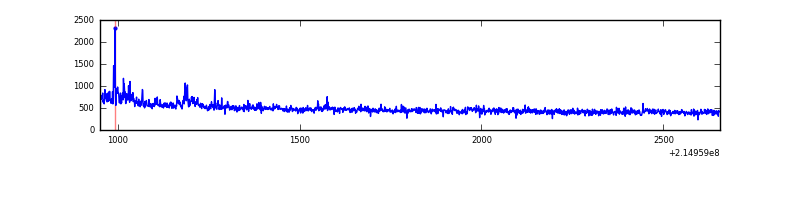 |
| C | 1704 | 1704 | 0 | 0 | 0.00% | 0.00% | 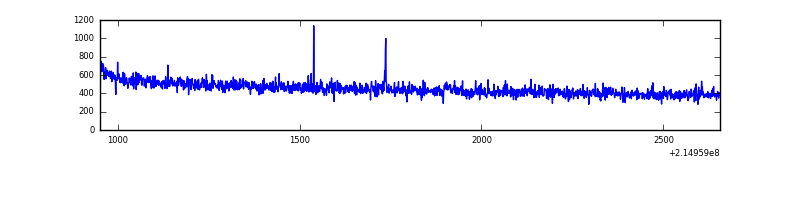 |
| D | 1704 | 1704 | 10 | 10 | 0.59% | 0.59% | 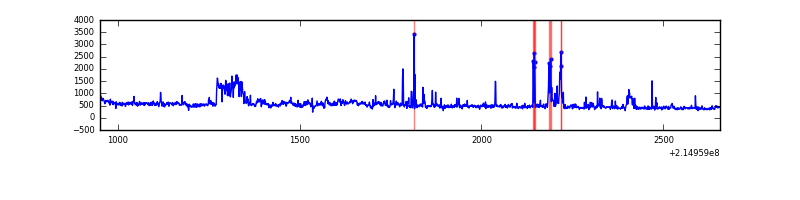 |
Top three noisy pixels from each quadrant. If the there are fewer than three noisy pixels in the level2.evt file, extra rows are filled as -1
| Pixel properties | Quadrant properties | ||||||
|---|---|---|---|---|---|---|---|
| Quadrant | DetID | PixID | Counts | Sigma | Mean | Median | Sigma |
| A | 0 | 31 | 2647 | 60.1 | 192 | 188 | 40.9 |
| A | 12 | 194 | 1826 | 40.04 | 192 | 188 | 40.9 |
| A | 0 | 226 | 1795 | 39.28 | 192 | 188 | 40.9 |
| B | 4 | 81 | 20095 | 502.13 | 198 | 193 | 39.6 |
| B | 15 | 204 | 15667 | 390.41 | 198 | 193 | 39.6 |
| B | 0 | 219 | 8612 | 212.41 | 198 | 193 | 39.6 |
| C | 12 | 4 | 4749 | 98.29 | 194 | 194 | 46.3 |
| C | 13 | 61 | 1562 | 29.52 | 194 | 194 | 46.3 |
| C | 8 | 222 | 613 | 9.04 | 194 | 194 | 46.3 |
| D | 11 | 241 | 158505 | 3316.77 | 190 | 184 | 47.7 |
| D | 7 | 55 | 31681 | 659.85 | 190 | 184 | 47.7 |
| D | 8 | 195 | 26935 | 560.42 | 190 | 184 | 47.7 |
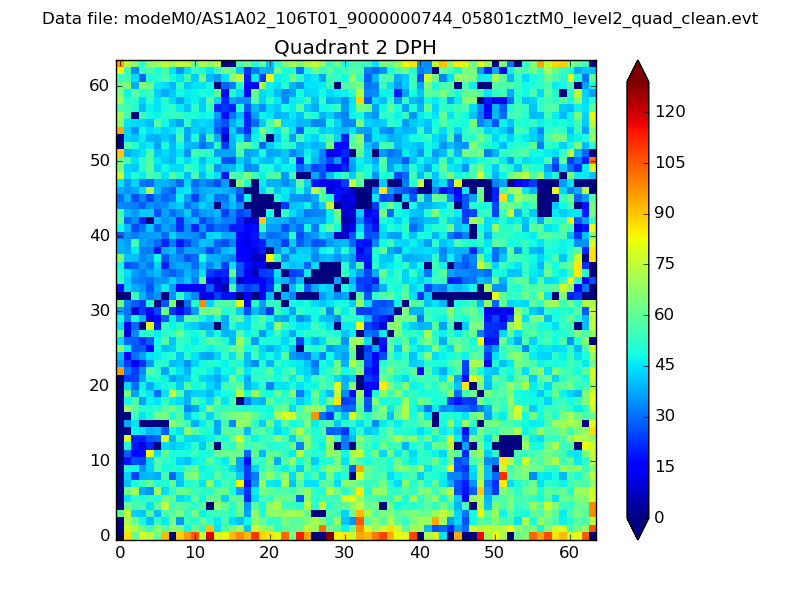
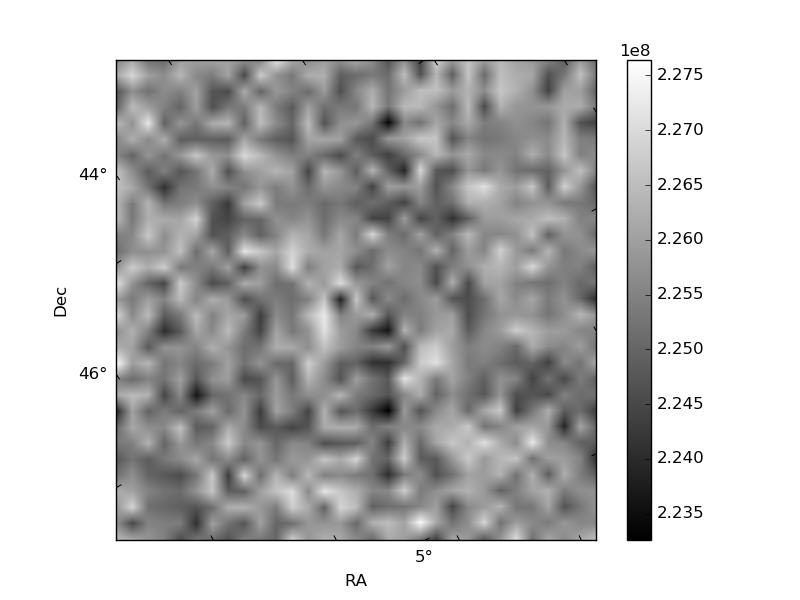
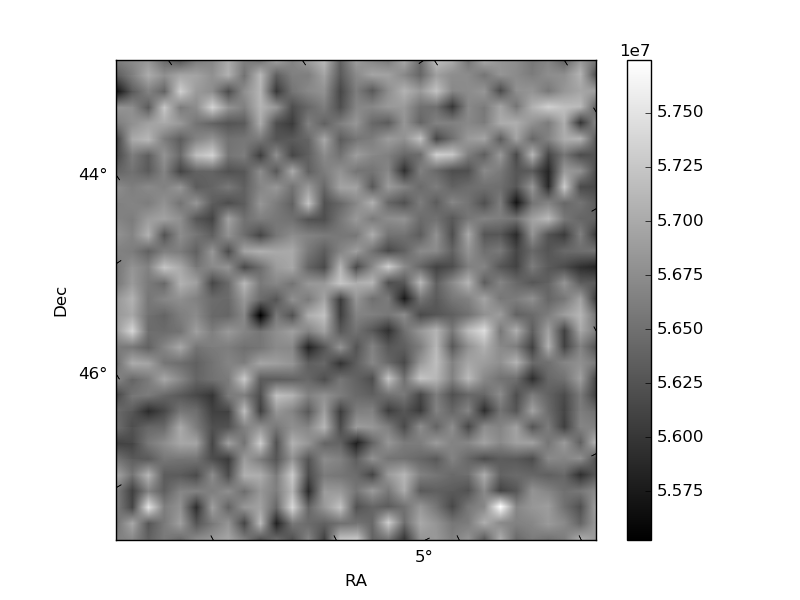
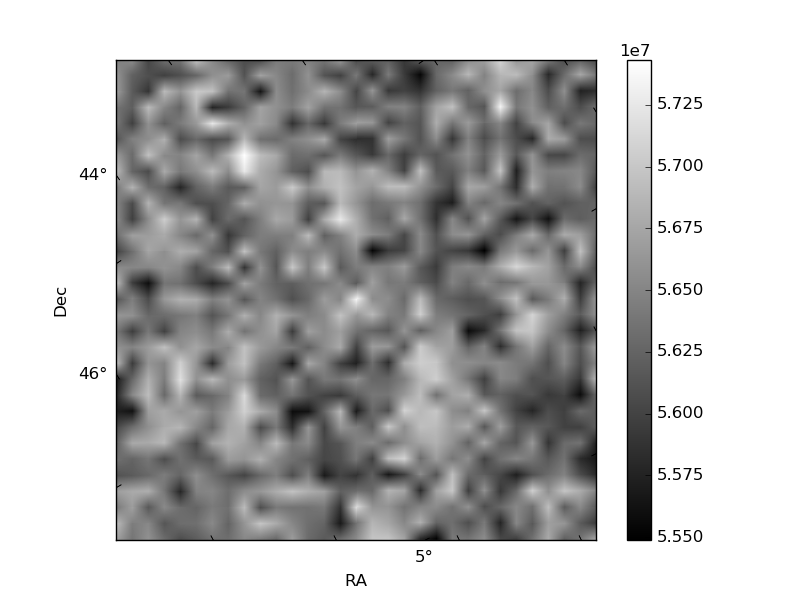
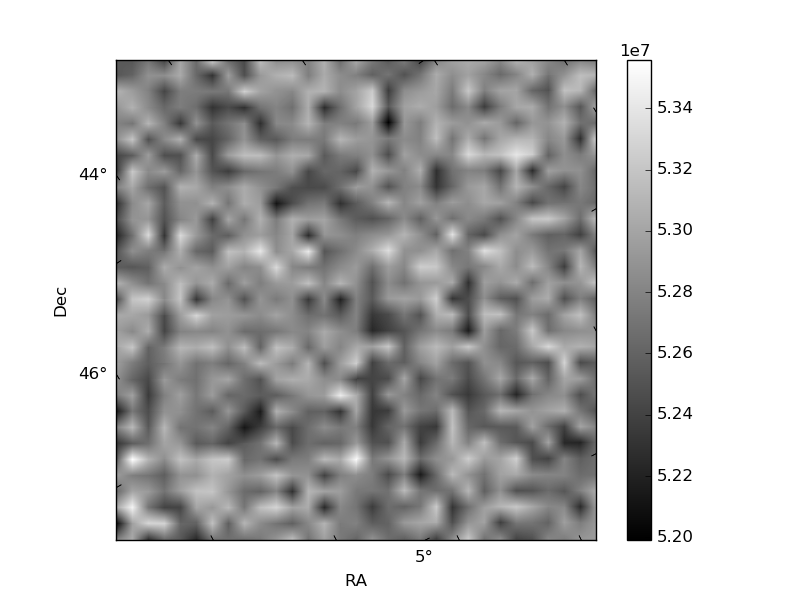
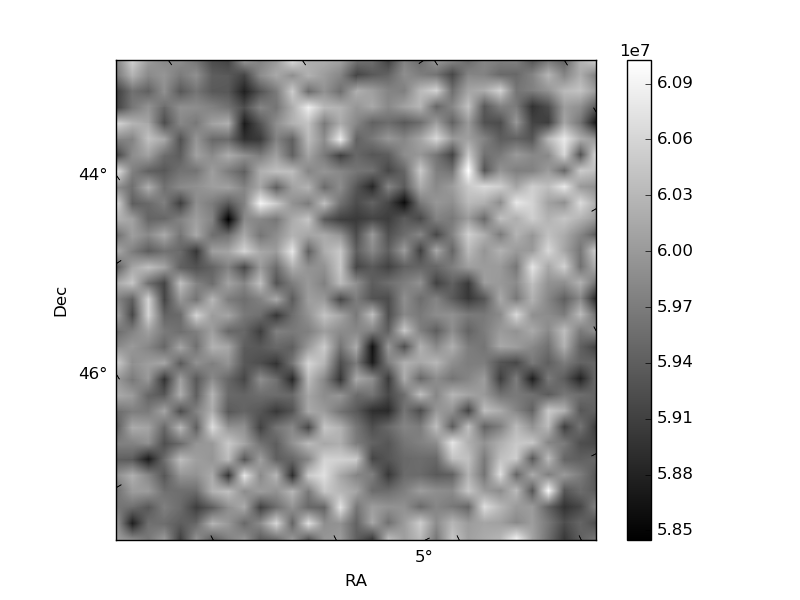
Histogram calculated using DETX and DETY for each event in the final _common_clean file
| Quadrant A | 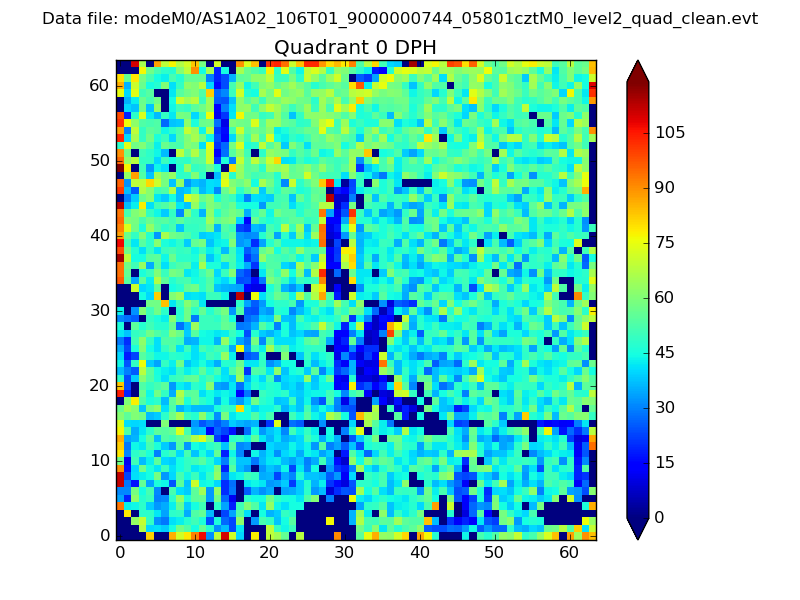 |
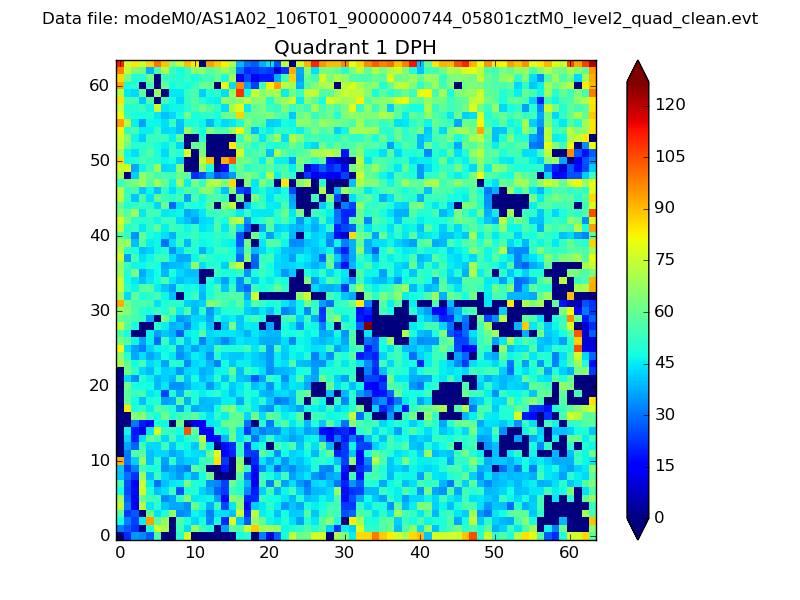 |
Quadrant B |
|---|---|---|---|
| Quadrant D | 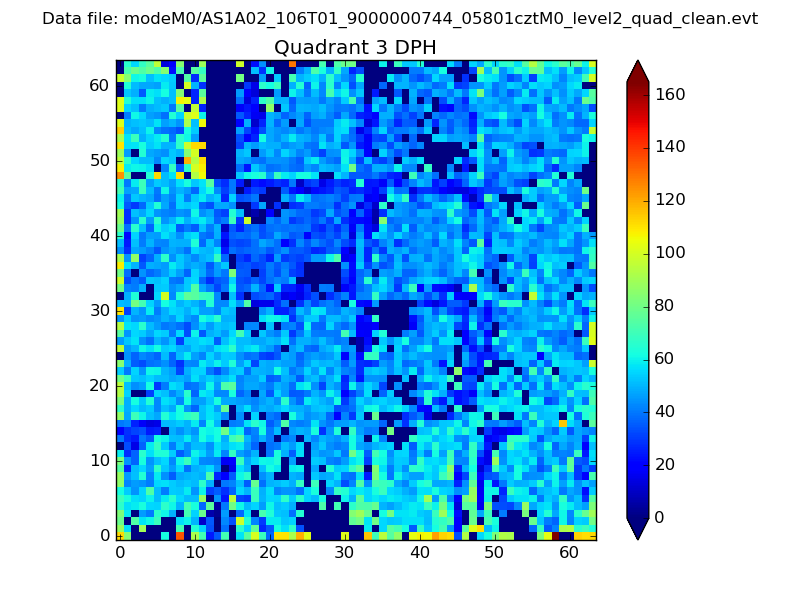 |
 |
Quadrant C |
| Plot type | Count rate plots | Images |
|---|---|---|
| Comparison with Poisson distribution Blue bars denote a histogram of data divided into 1 sec bins. Red curve is a Poisson curve with rate = median count rate of data. |
 |
 |
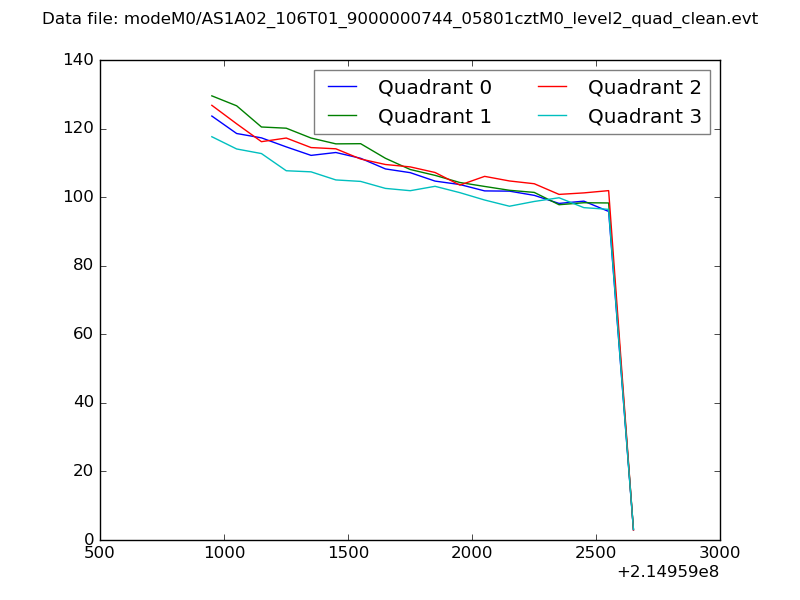
| Quadrant-wise count rates Data is divided into 100 sec bins |
 |
|
| Module-wise count rates for Quadrant A Data is divided into 100 sec bins |
 |
 |
| Module-wise count rates for Quadrant B Data is divided into 100 sec bins |
 |
 |
| Module-wise count rates for Quadrant C Data is divided into 100 sec bins |
 |
 |
| Module-wise count rates for Quadrant D Data is divided into 100 sec bins |
 |
 |
| Parameter | Plot |
|---|---|
| CZT HV Monitor |  |
| D_VDD | 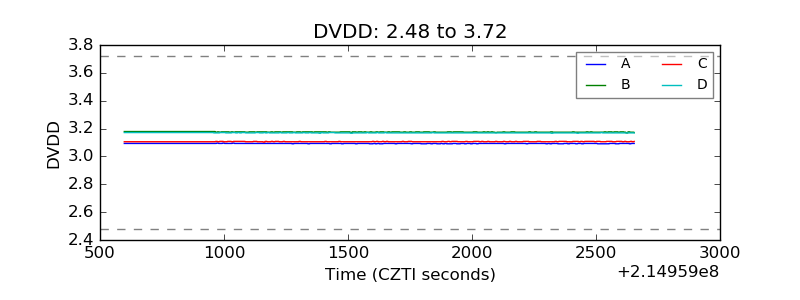 |
| Temperature 1 | 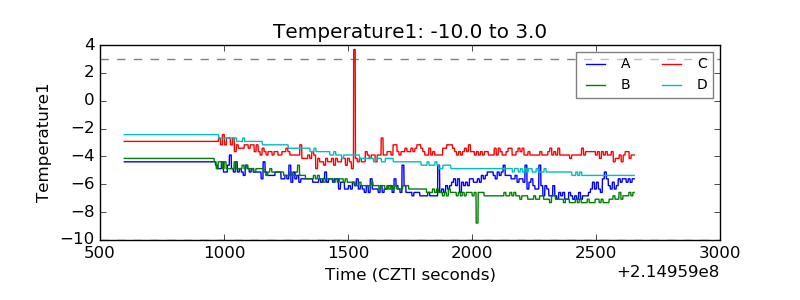 |
| Veto HV Monitor | 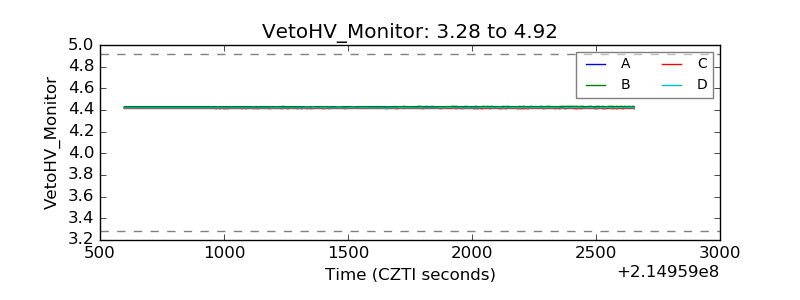 |
| Veto LLD | 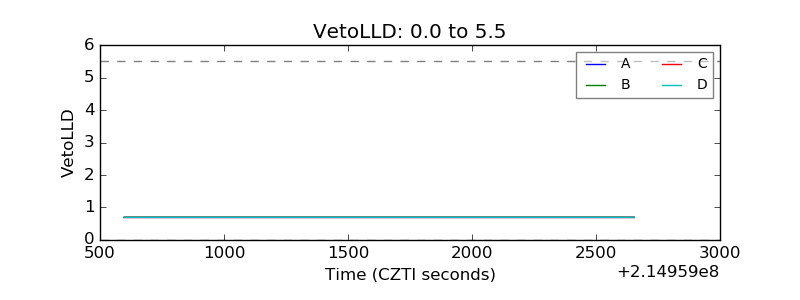 |
| Alpha Counter | 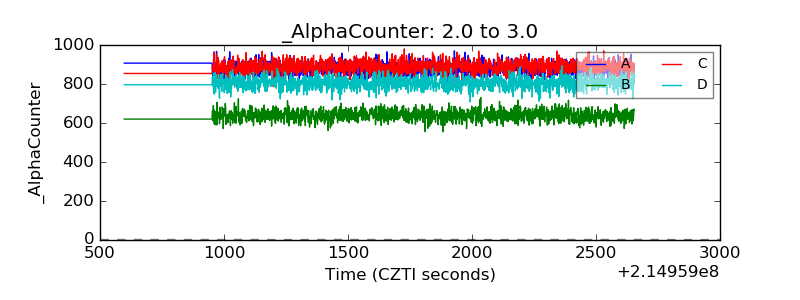 |
| _CPM_Rate | 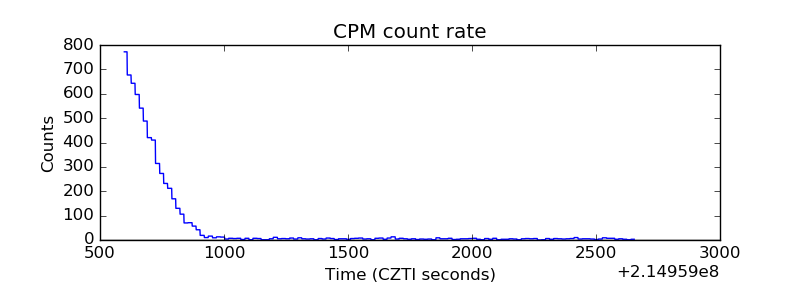 |
| CZT Counter | 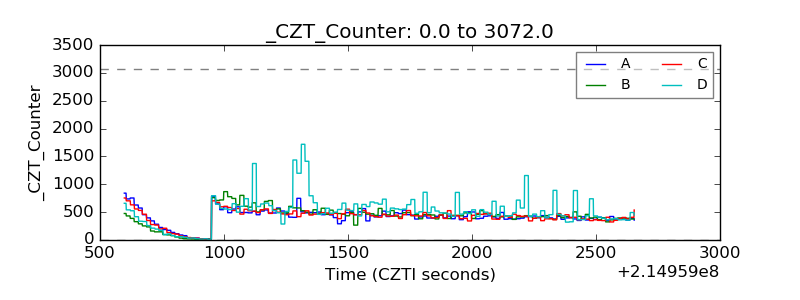 |
| +2.5 Volts monitor |  |
| +5 Volts monitor | 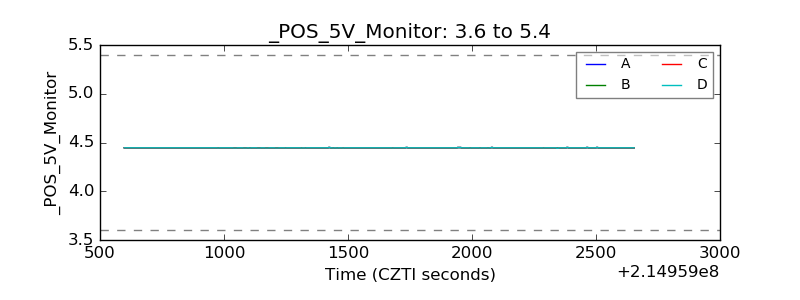 |
| _ROLL_ROT | 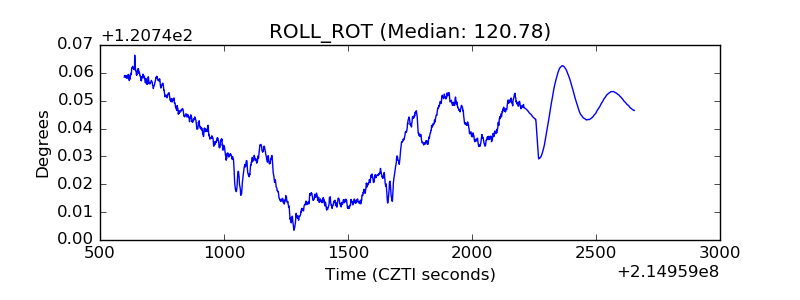 |
| _Roll_DEC | 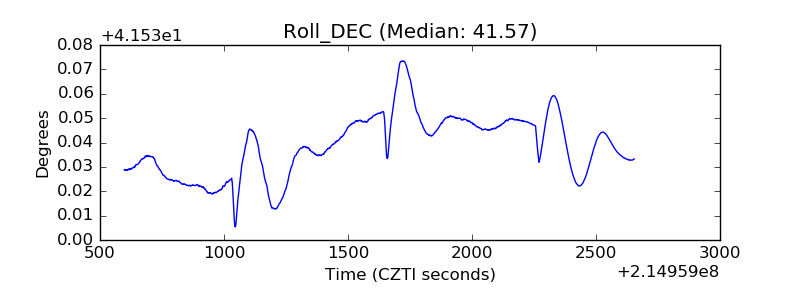 |
| _Roll_RA | 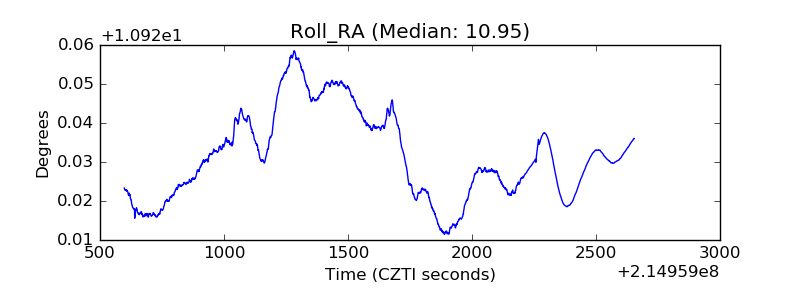 |
| Veto Counter |  |