| Param | Original file | Final file |
|---|---|---|
| Filename | modeM0/AS1G06_089T01_9000000746cztM0_level2.fits | modeM0/AS1G06_089T01_9000000746cztM0_level2_quad_clean.evt |
| Size (bytes) | 551,986,560 | 567,521,280 |
| Size | 526.4 MB | 541.2 MB |
| Events in quadrant A | 3,316,568 | 3,413,255 |
| Events in quadrant B | 3,261,250 | 3,491,350 |
| Events in quadrant C | 3,284,804 | 3,290,022 |
| Events in quadrant D | 2,796,188 | 2,936,438 |
| Mode M9 | |||
|---|---|---|---|
| Quadrant | BADHDUFLAG | Total packets | Discarded packets |
| A | 0 | 84 | 0 |
| B | 0 | 84 | 0 |
| C | 0 | 84 | 0 |
| D | 0 | 84 | 0 |
| Mode M0 | |||
|---|---|---|---|
| Quadrant | BADHDUFLAG | Total packets | Discarded packets |
| A | 0 | 137603 | 0 |
| B | 0 | 124770 | 0 |
| C | 0 | 122140 | 0 |
| D | 0 | 143467 | 0 |
| Mode SS | |||
|---|---|---|---|
| Quadrant | BADHDUFLAG | Total packets | Discarded packets |
| A | 0 | 1206 | 0 |
| B | 0 | 1206 | 0 |
| C | 0 | 1206 | 0 |
| D | 0 | 1206 | 0 |
| Quadrant | Total seconds | Saturated seconds | Saturation percentage |
|---|---|---|---|
| A | 59136 | 1708 | 2.888258% |
| B | 59140 | 1050 | 1.775448% |
| C | 59139 | 561 | 0.948613% |
| D | 59128 | 2236 | 3.781626% |
Noise dominated data is calculated using 1-second bins in cleaned event files. If a bin has >2000 counts, and if more than 50% of those come from <1% of pixels, then it is considered to be noise-dominated and hence unusable.
| Quadrant | # 1 sec bins | Bins with >0 counts | Bins with >2000 counts | High rate bins dominated by noise | Noise dominated (total time) | Noise dominated (detector-on time) | Marked lightcurve |
|---|---|---|---|---|---|---|---|
| A | 67638 | 59148 | 0 | 0 | 0.00% | 0.00% | 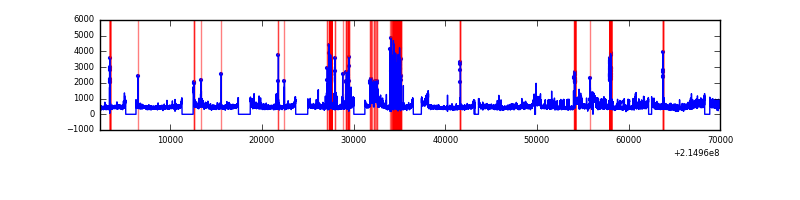 |
| B | 67638 | 59153 | 0 | 0 | 0.00% | 0.00% | 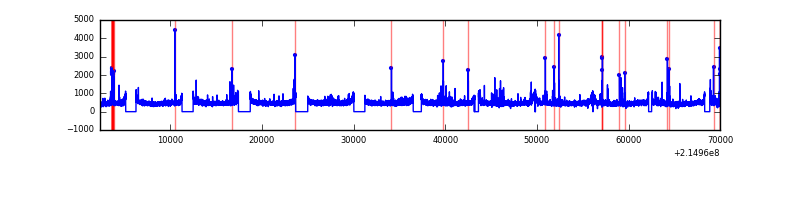 |
| C | 67638 | 59154 | 0 | 0 | 0.00% | 0.00% | 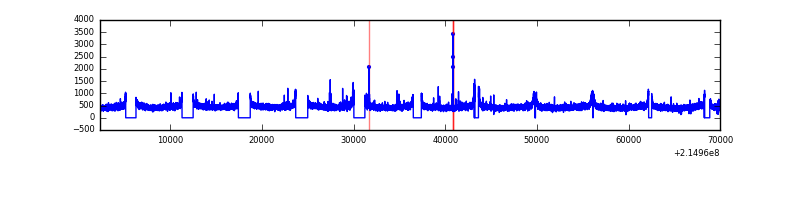 |
| D | 67638 | 59149 | 0 | 0 | 0.00% | 0.00% | 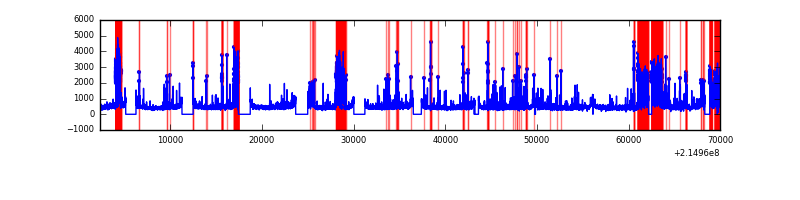 |
Top three noisy pixels from each quadrant. If the there are fewer than three noisy pixels in the level2.evt file, extra rows are filled as -1
| Pixel properties | Quadrant properties | ||||||
|---|---|---|---|---|---|---|---|
| Quadrant | DetID | PixID | Counts | Sigma | Mean | Median | Sigma |
| A | 0 | 29 | 3228 | 10.99 | 864 | 806 | 220.3 |
| A | 7 | 110 | 2848 | 9.27 | 864 | 806 | 220.3 |
| A | 0 | 30 | 2501 | 7.69 | 864 | 806 | 220.3 |
| B | 2 | 9 | 2795 | 11.4 | 860 | 818 | 173.4 |
| B | 12 | 226 | 2269 | 8.37 | 860 | 818 | 173.4 |
| B | 5 | 128 | 2241 | 8.2 | 860 | 818 | 173.4 |
| C | 12 | 241 | 2335 | 6.62 | 867 | 803 | 231.5 |
| C | 1 | 80 | 2289 | 6.42 | 867 | 803 | 231.5 |
| C | 1 | 81 | 2278 | 6.37 | 867 | 803 | 231.5 |
| D | 6 | 231 | 2102 | 6.37 | 798 | 721 | 216.7 |
| D | 11 | 82 | 2095 | 6.34 | 798 | 721 | 216.7 |
| D | 3 | 14 | 2045 | 6.11 | 798 | 721 | 216.7 |
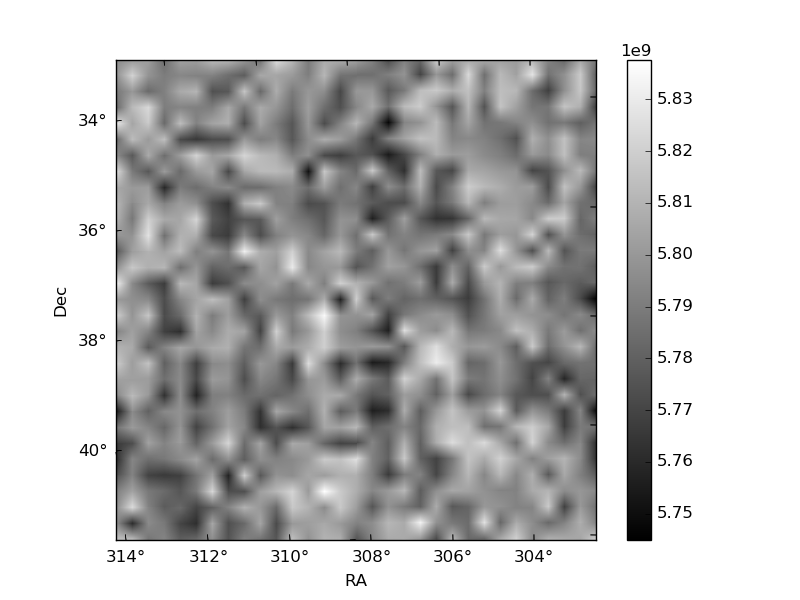
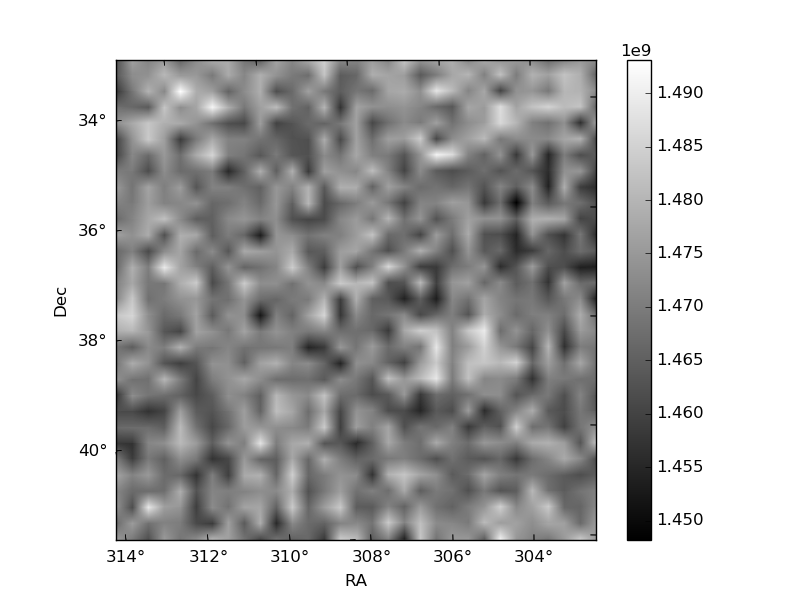
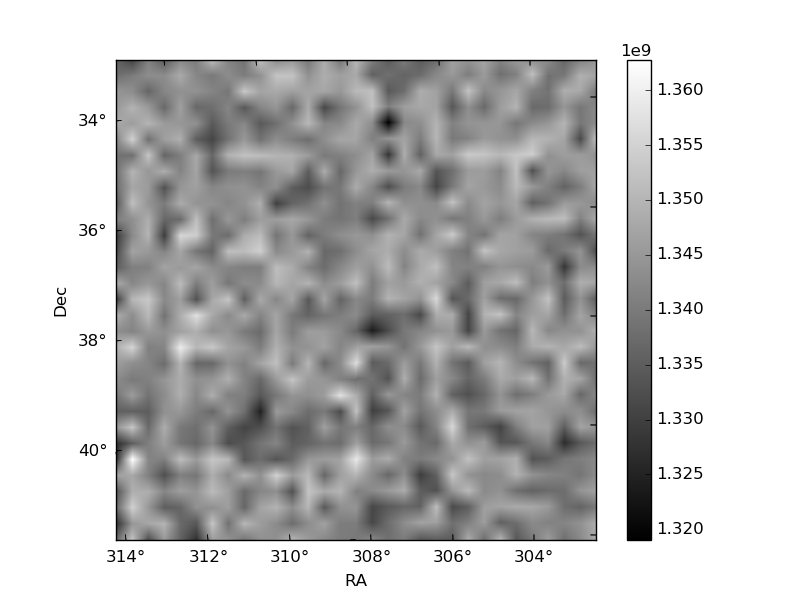
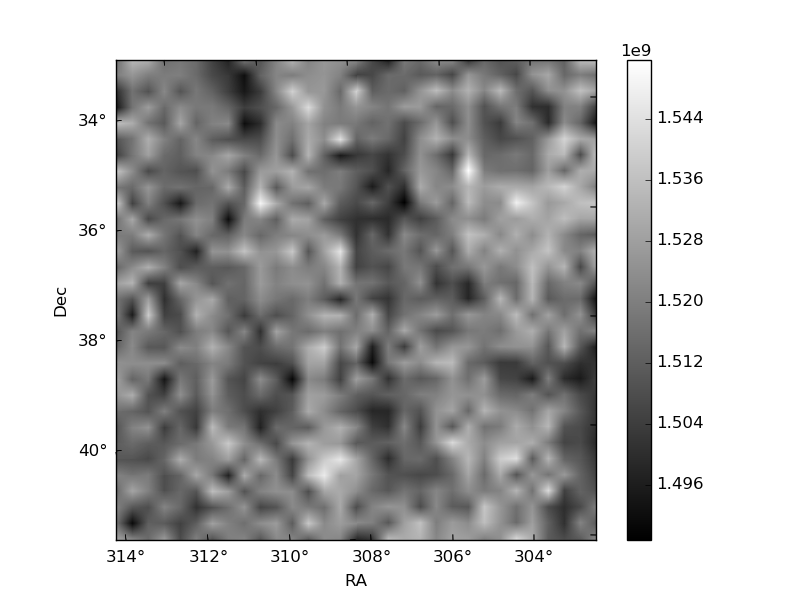
Histogram calculated using DETX and DETY for each event in the final _common_clean file
| Quadrant A | 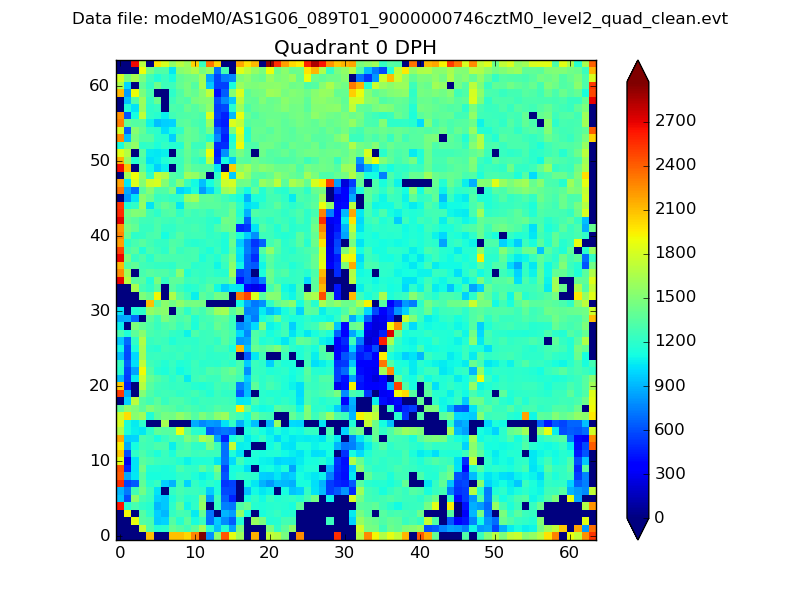 |
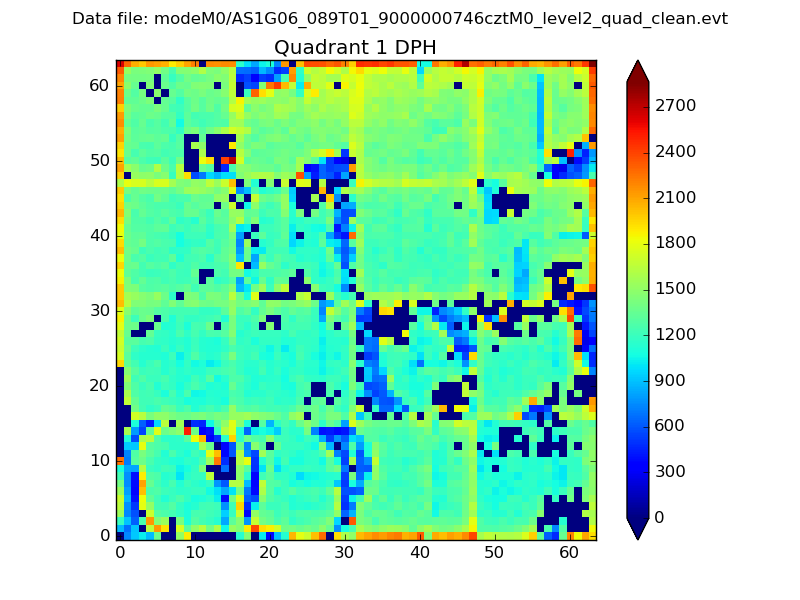 |
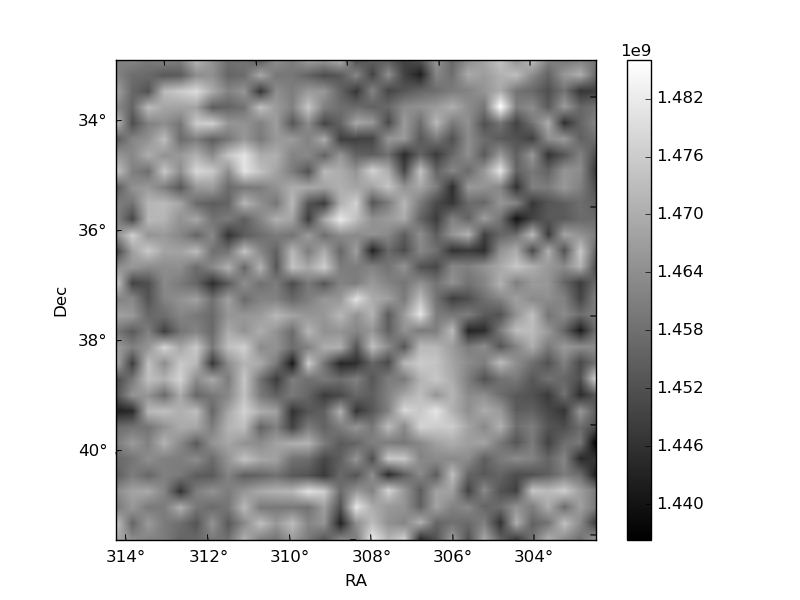
Quadrant B |
|---|---|---|---|
| Quadrant D | 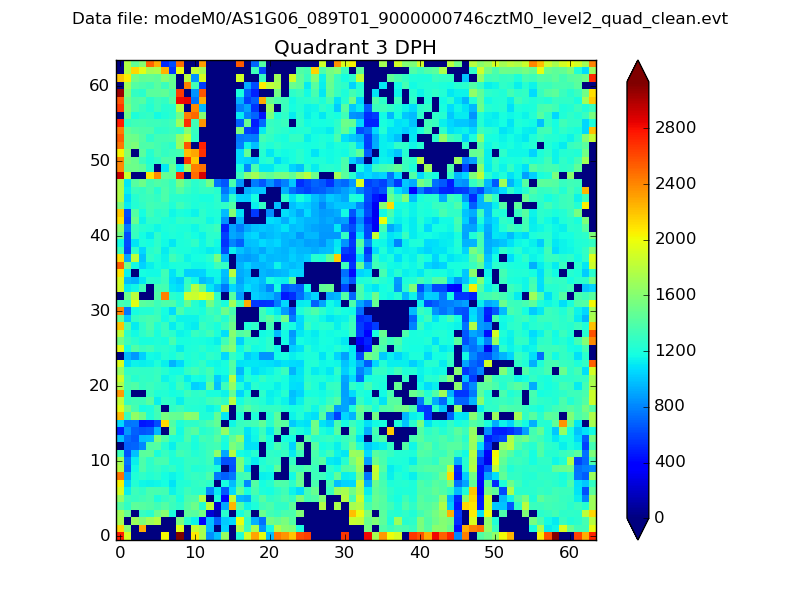 |
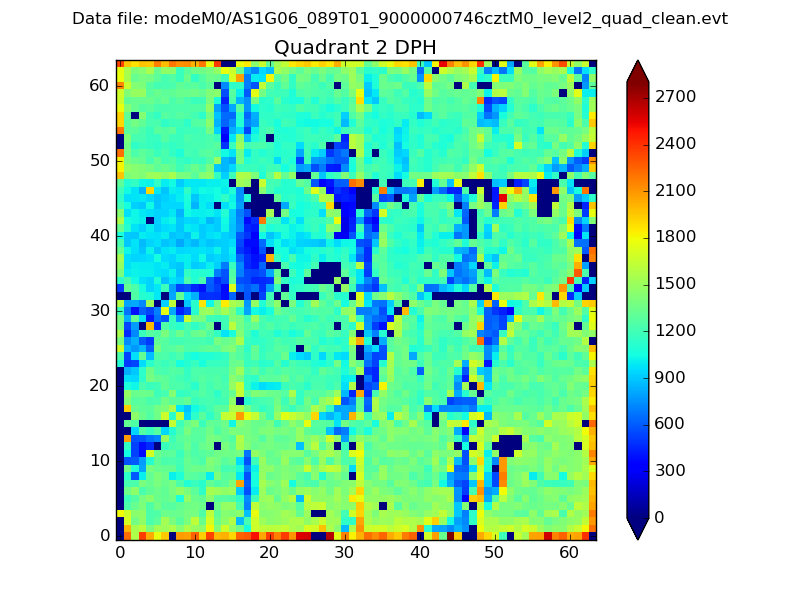 |
Quadrant C |
| Plot type | Count rate plots | Images |
|---|---|---|
| Comparison with Poisson distribution Blue bars denote a histogram of data divided into 1 sec bins. Red curve is a Poisson curve with rate = median count rate of data. |
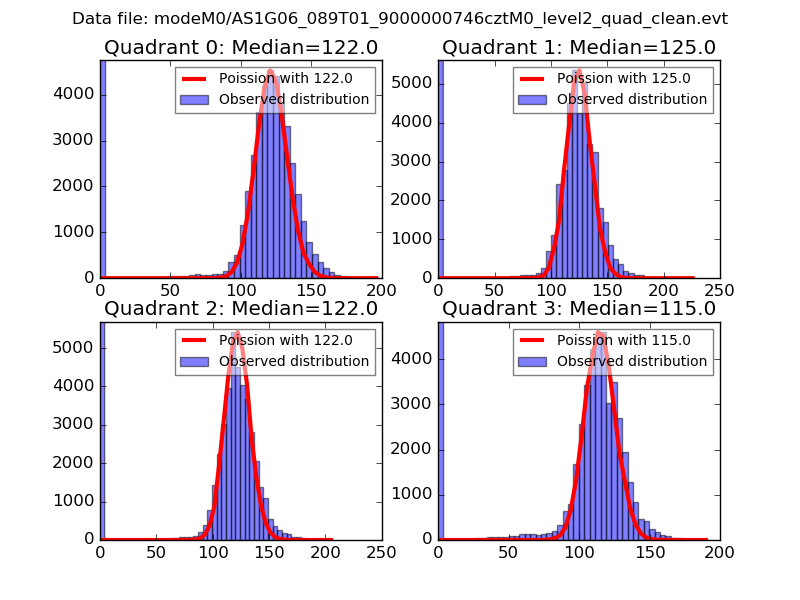 |
 |
| Quadrant-wise count rates Data is divided into 100 sec bins |
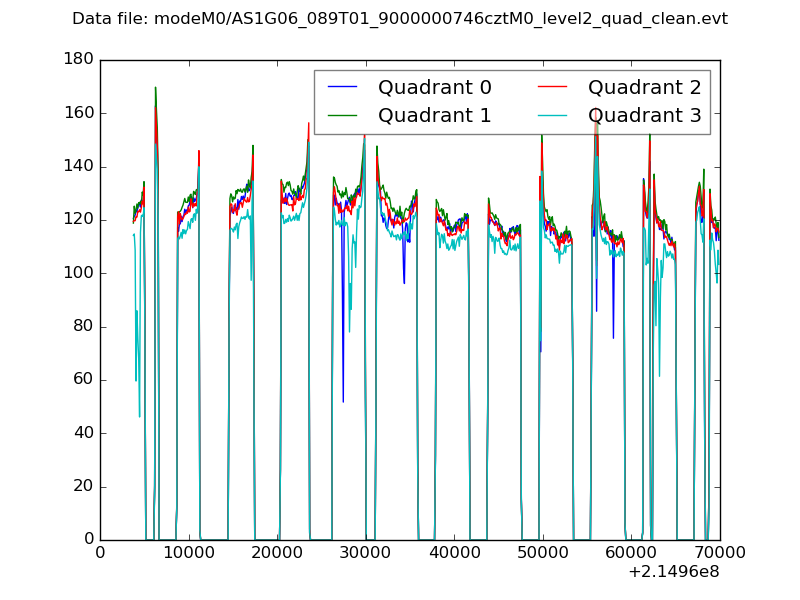 |
|
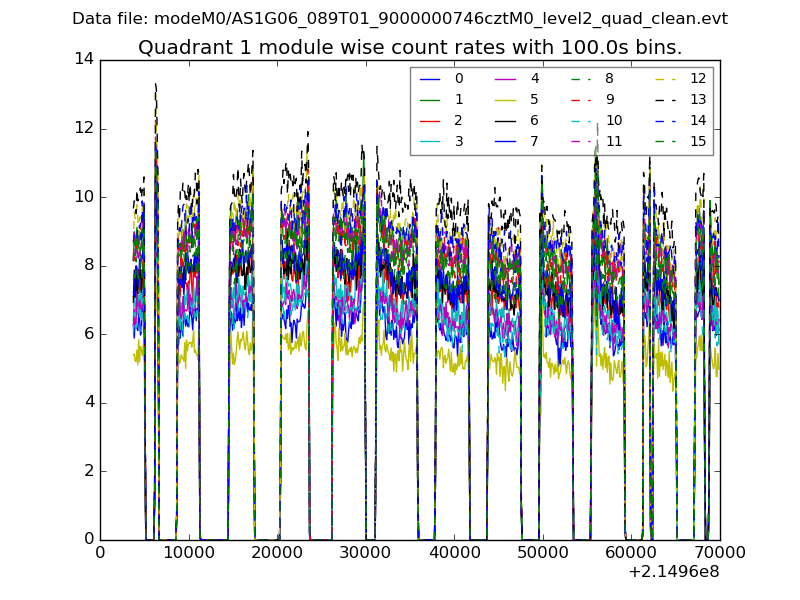
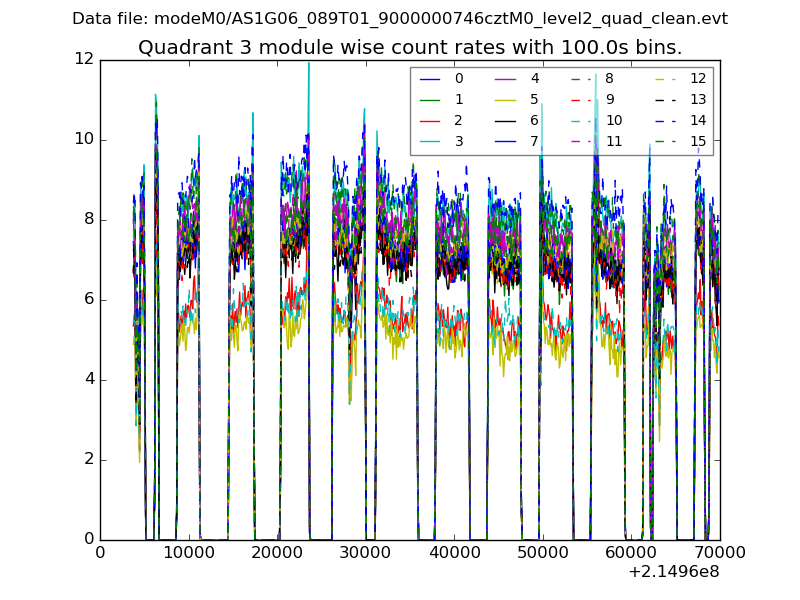
| Module-wise count rates for Quadrant A Data is divided into 100 sec bins |
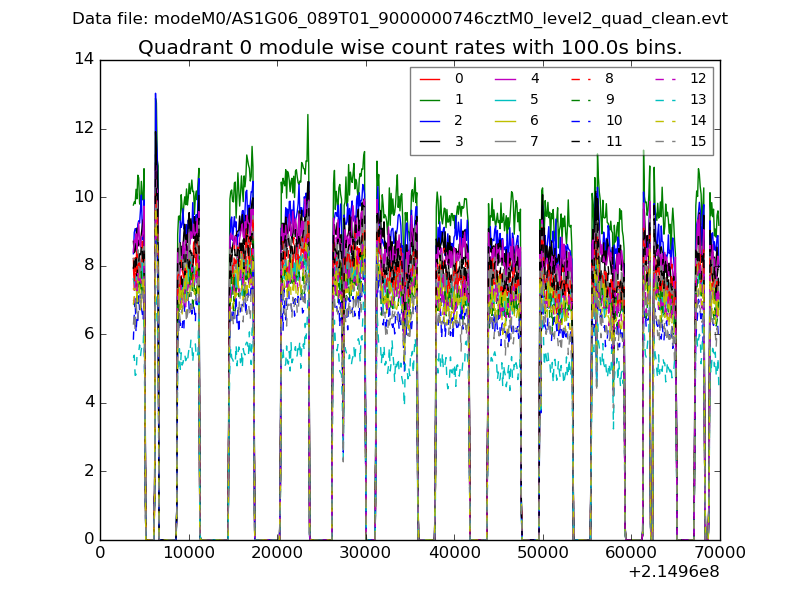 |
 |
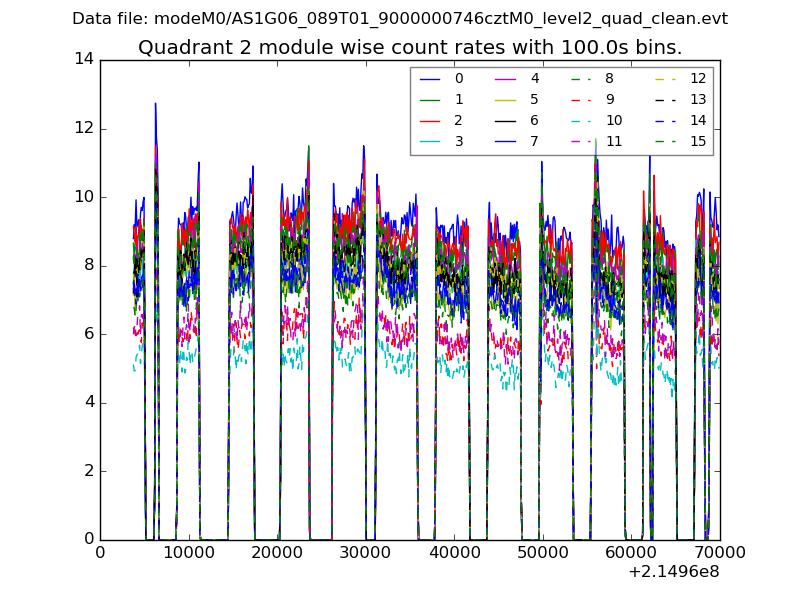
| Module-wise count rates for Quadrant B Data is divided into 100 sec bins |
 |
 |
| Module-wise count rates for Quadrant C Data is divided into 100 sec bins |
 |
 |
| Module-wise count rates for Quadrant D Data is divided into 100 sec bins |
 |
 |
| Parameter | Plot |
|---|---|
| CZT HV Monitor |  |
| D_VDD | 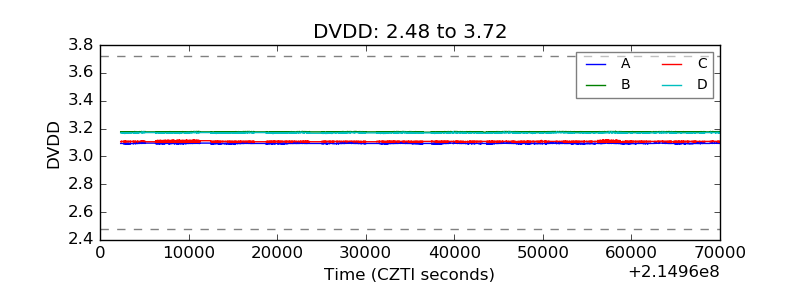 |
| Temperature 1 | 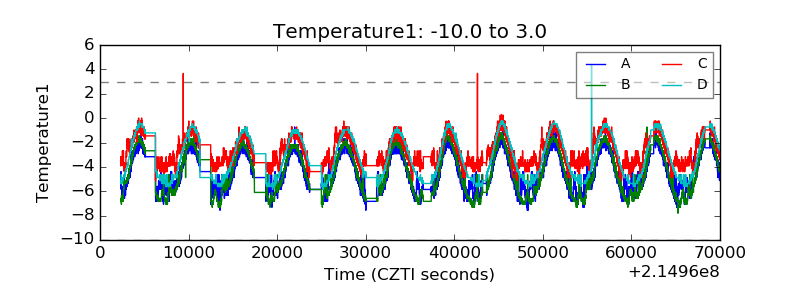 |
| Veto HV Monitor | 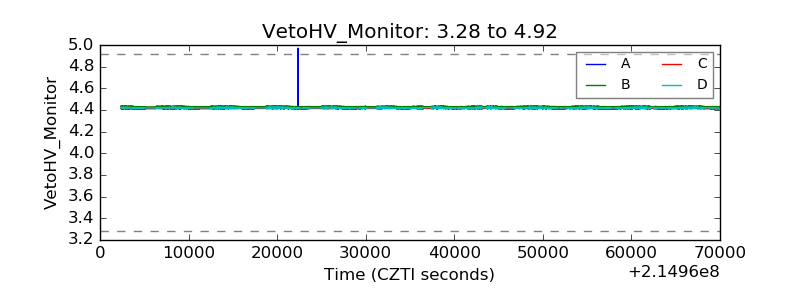 |
| Veto LLD | 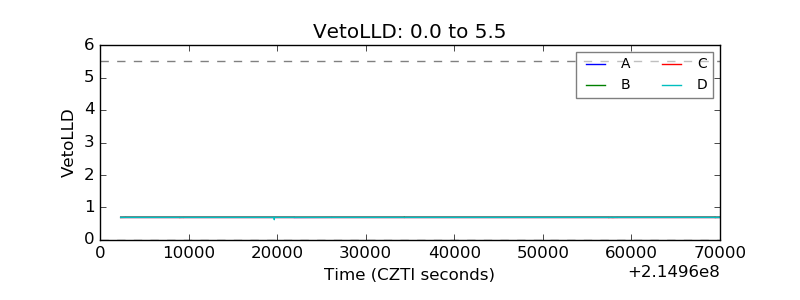 |
| Alpha Counter | 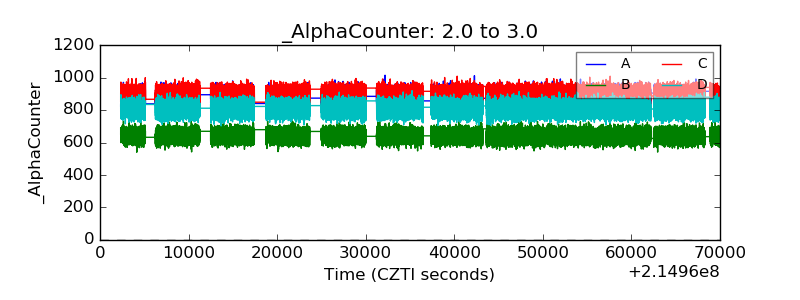 |
| _CPM_Rate | 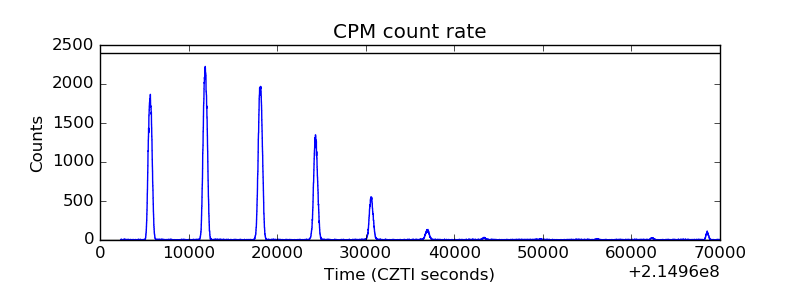 |
| CZT Counter | 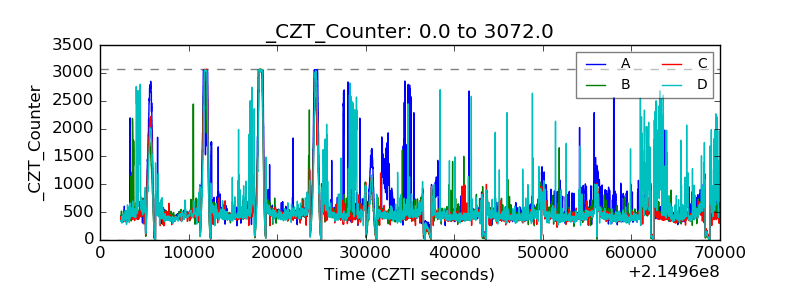 |
| +2.5 Volts monitor | 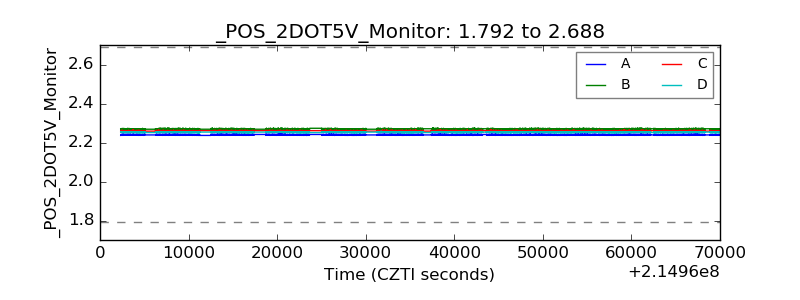 |
| +5 Volts monitor |  |
| _ROLL_ROT | 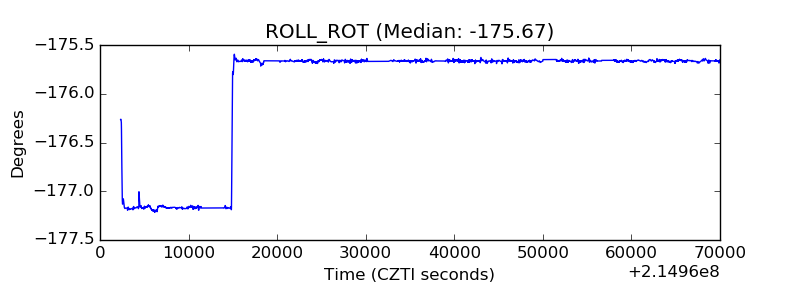 |
| _Roll_DEC | 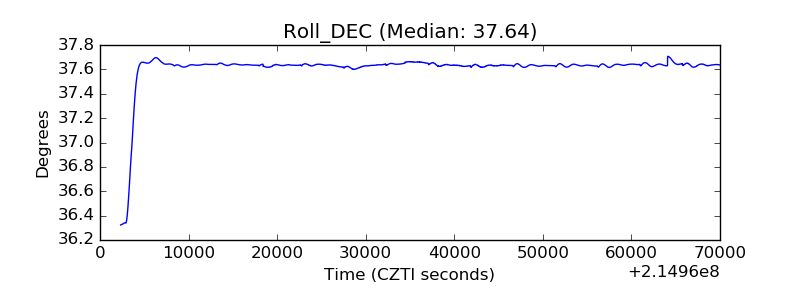 |
| _Roll_RA |  |
| Veto Counter |  |