| Param | Original file | Final file |
|---|---|---|
| Filename | modeM0/AS1G06_089T01_9000000746_05804cztM0_level2.evt | modeM0/AS1G06_089T01_9000000746_05804cztM0_level2_quad_clean.evt |
| Size (bytes) | 442,045,440 | 63,754,560 |
| Size | 421.6 MB | 60.8 MB |
| Events in quadrant A | 3,234,654 | 378,164 |
| Events in quadrant B | 3,226,309 | 384,176 |
| Events in quadrant C | 3,066,987 | 372,212 |
| Events in quadrant D | 3,429,508 | 354,312 |
| Mode M9 | |||
|---|---|---|---|
| Quadrant | BADHDUFLAG | Total packets | Discarded packets |
| A | 0 | 15 | 0 |
| B | 0 | 15 | 0 |
| C | 0 | 15 | 0 |
| D | 0 | 16 | 0 |
| Mode M0 | |||
|---|---|---|---|
| Quadrant | BADHDUFLAG | Total packets | Discarded packets |
| A | 0 | 13524 | 3 |
| B | 0 | 13412 | 2 |
| C | 0 | 13160 | 2 |
| D | 0 | 14318 | 2 |
| Mode SS | |||
|---|---|---|---|
| Quadrant | BADHDUFLAG | Total packets | Discarded packets |
| A | 0 | 128 | 0 |
| B | 0 | 128 | 0 |
| C | 0 | 128 | 0 |
| D | 0 | 128 | 0 |
| Quadrant | Total seconds | Saturated seconds | Saturation percentage |
|---|---|---|---|
| A | 6326 | 97 | 1.533354% |
| B | 6326 | 122 | 1.928549% |
| C | 6326 | 54 | 0.853620% |
| D | 6326 | 62 | 0.980082% |
Noise dominated data is calculated using 1-second bins in cleaned event files. If a bin has >2000 counts, and if more than 50% of those come from <1% of pixels, then it is considered to be noise-dominated and hence unusable.
| Quadrant | # 1 sec bins | Bins with >0 counts | Bins with >2000 counts | High rate bins dominated by noise | Noise dominated (total time) | Noise dominated (detector-on time) | Marked lightcurve |
|---|---|---|---|---|---|---|---|
| A | 7646 | 6327 | 3 | 3 | 0.04% | 0.05% | 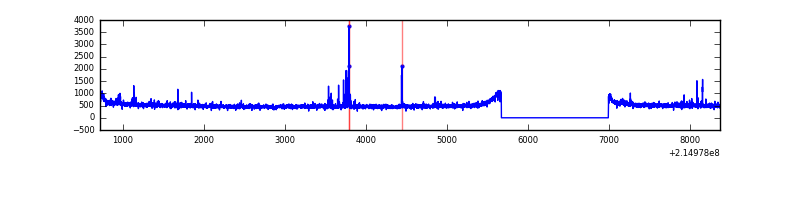 |
| B | 7646 | 6327 | 1 | 1 | 0.01% | 0.02% | 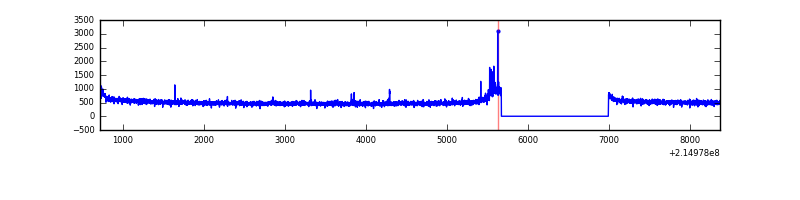 |
| C | 7646 | 6327 | 0 | 0 | 0.00% | 0.00% | 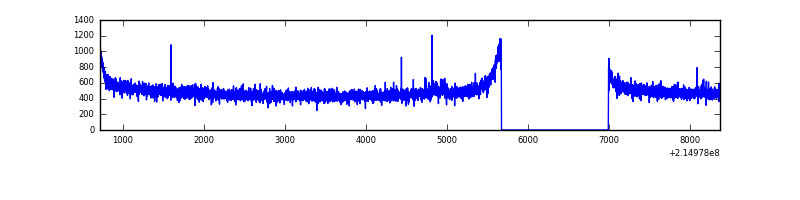 |
| D | 7646 | 6327 | 6 | 6 | 0.08% | 0.09% | 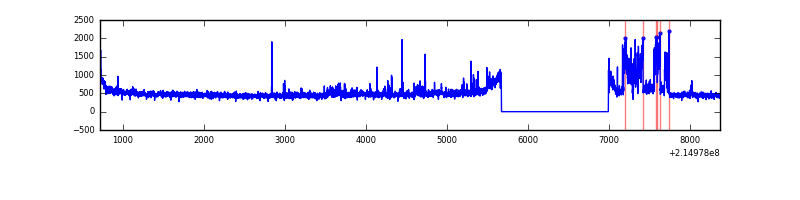 |
Top three noisy pixels from each quadrant. If the there are fewer than three noisy pixels in the level2.evt file, extra rows are filled as -1
| Pixel properties | Quadrant properties | ||||||
|---|---|---|---|---|---|---|---|
| Quadrant | DetID | PixID | Counts | Sigma | Mean | Median | Sigma |
| A | 0 | 31 | 82380 | 496.29 | 814 | 797 | 164.4 |
| A | 15 | 79 | 17842 | 103.69 | 814 | 797 | 164.4 |
| A | 0 | 226 | 8076 | 44.28 | 814 | 797 | 164.4 |
| B | 15 | 54 | 26288 | 163.7 | 821 | 802 | 155.7 |
| B | 12 | 111 | 14470 | 87.79 | 821 | 802 | 155.7 |
| B | 11 | 111 | 11437 | 68.31 | 821 | 802 | 155.7 |
| C | 9 | 160 | 9884 | 50.59 | 780 | 785 | 179.9 |
| C | 14 | 67 | 6556 | 32.08 | 780 | 785 | 179.9 |
| C | 13 | 61 | 6387 | 31.14 | 780 | 785 | 179.9 |
| D | 8 | 230 | 322746 | 1706.67 | 776 | 751 | 188.7 |
| D | 8 | 195 | 80764 | 424.09 | 776 | 751 | 188.7 |
| D | 2 | 136 | 31989 | 165.57 | 776 | 751 | 188.7 |
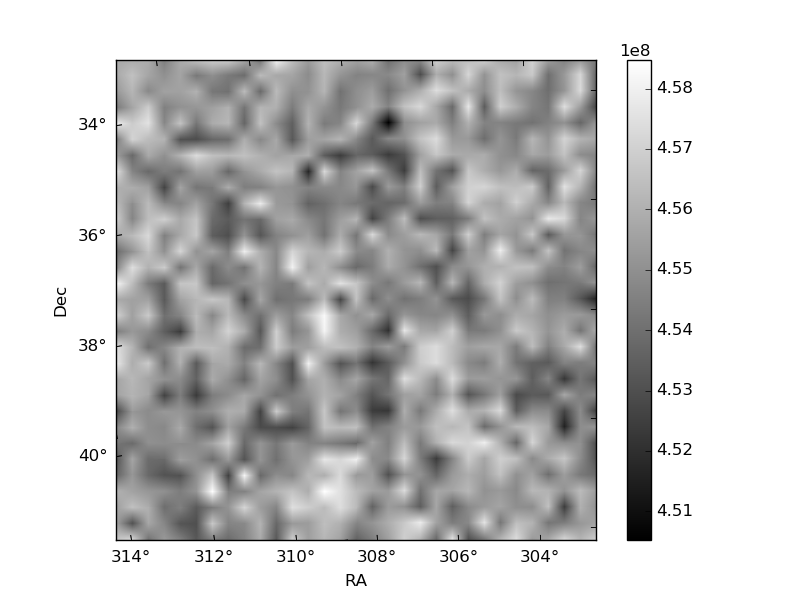
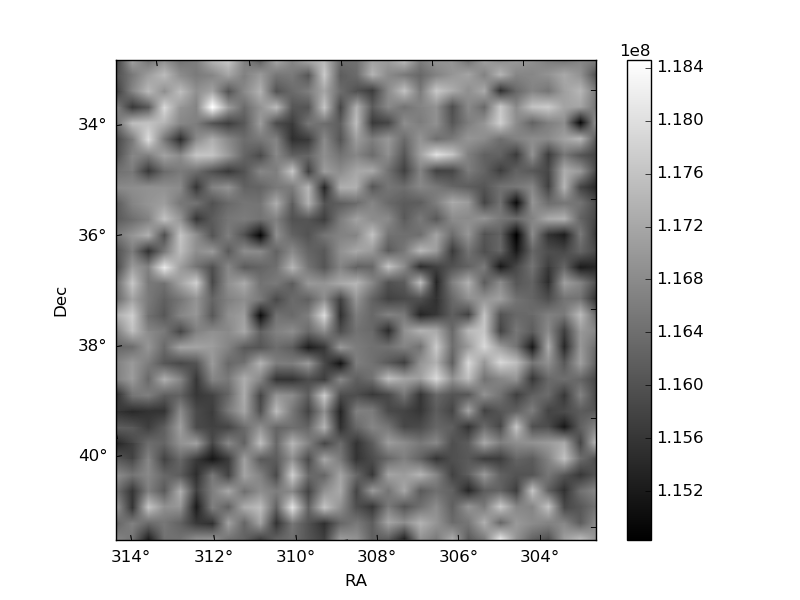
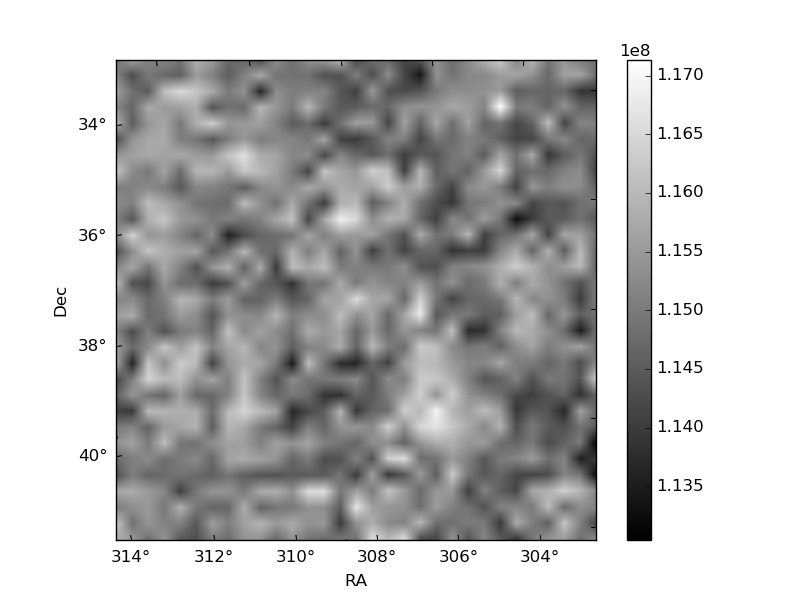
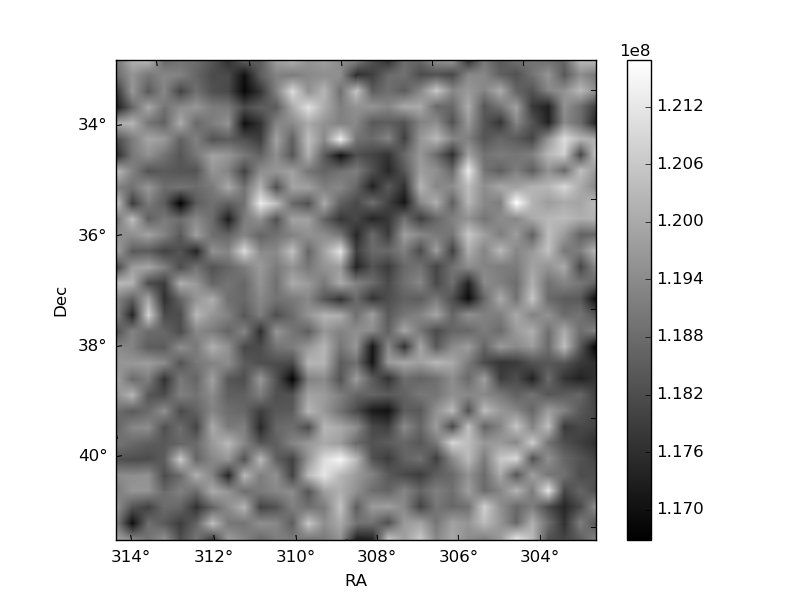
Histogram calculated using DETX and DETY for each event in the final _common_clean file
| Quadrant A | 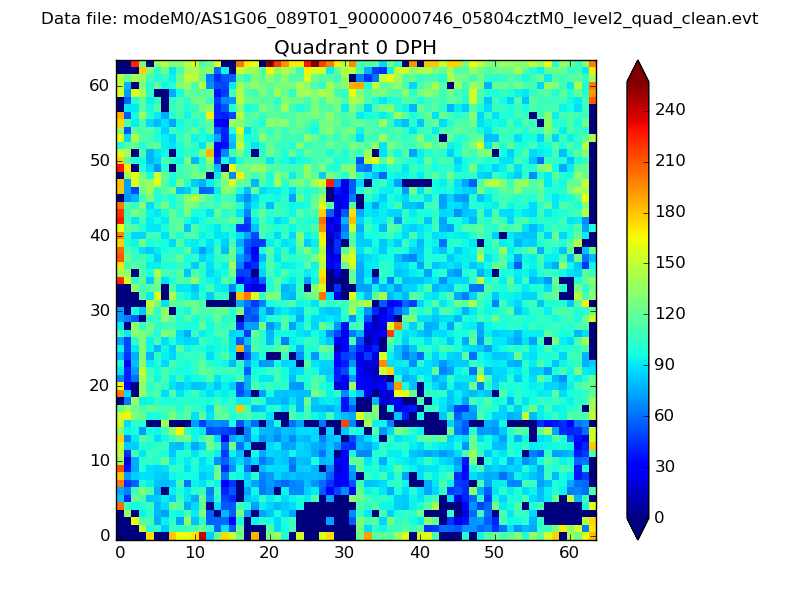 |
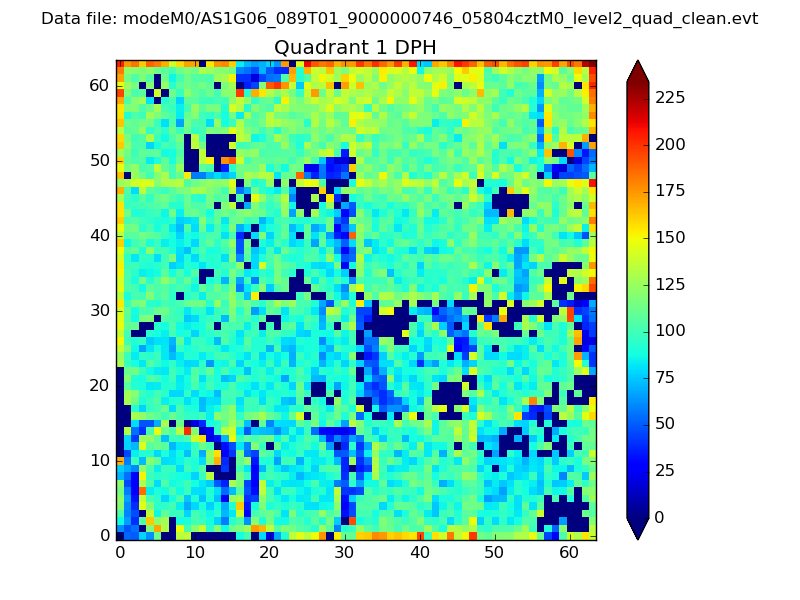 |
Quadrant B |
|---|---|---|---|
| Quadrant D | 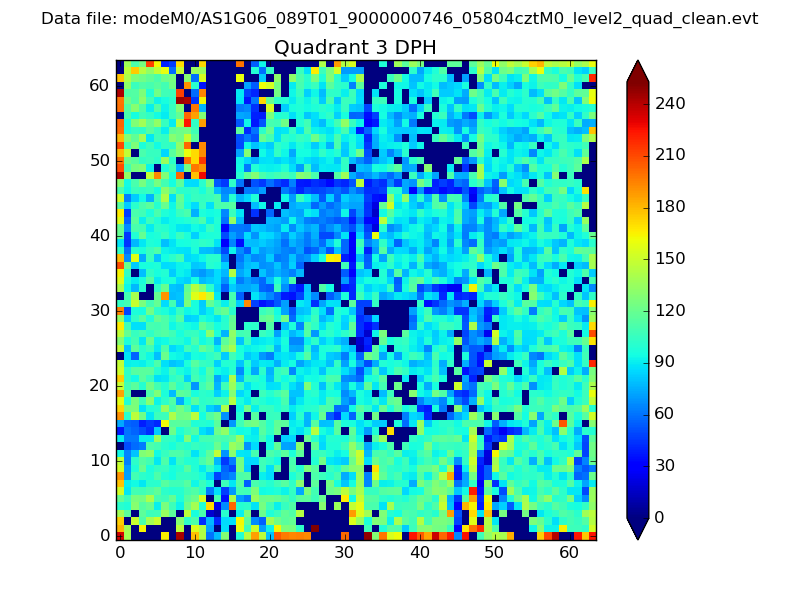 |
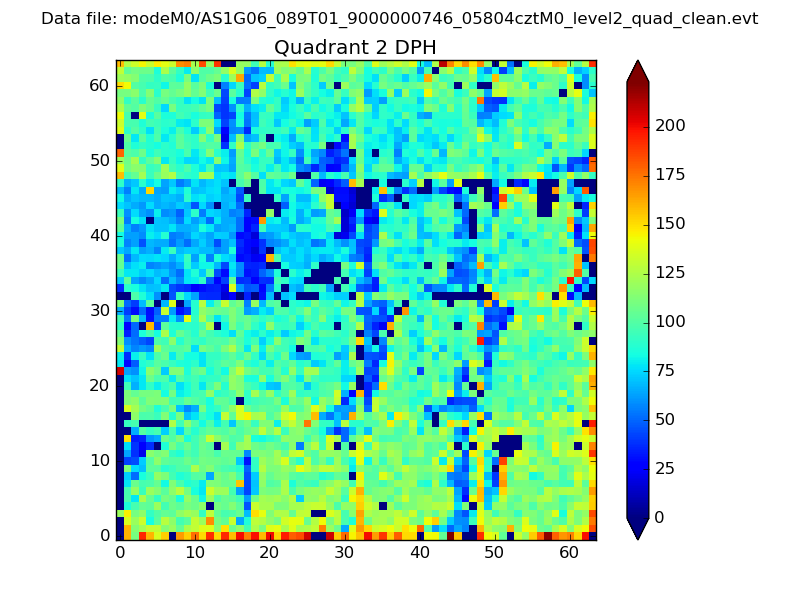 |
Quadrant C |
| Plot type | Count rate plots | Images |
|---|---|---|
| Comparison with Poisson distribution Blue bars denote a histogram of data divided into 1 sec bins. Red curve is a Poisson curve with rate = median count rate of data. |
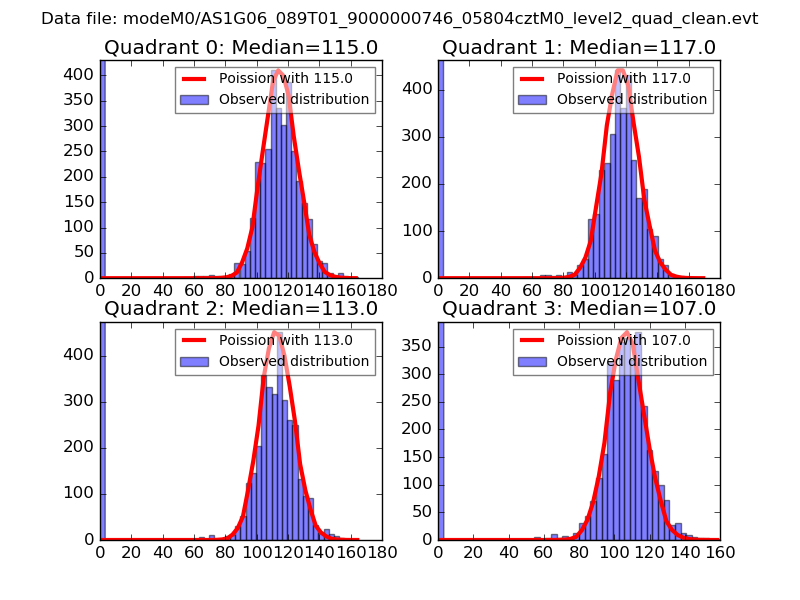 |
 |
| Quadrant-wise count rates Data is divided into 100 sec bins |
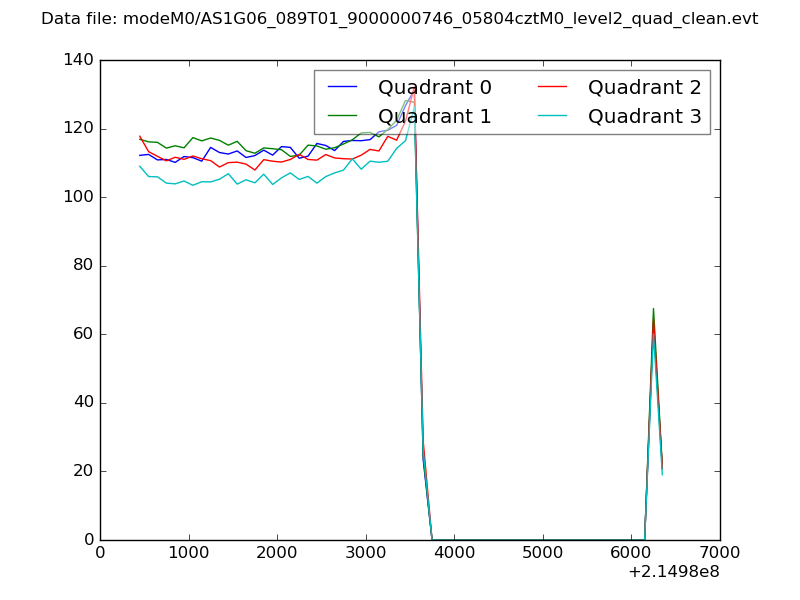 |
|
| Module-wise count rates for Quadrant A Data is divided into 100 sec bins |
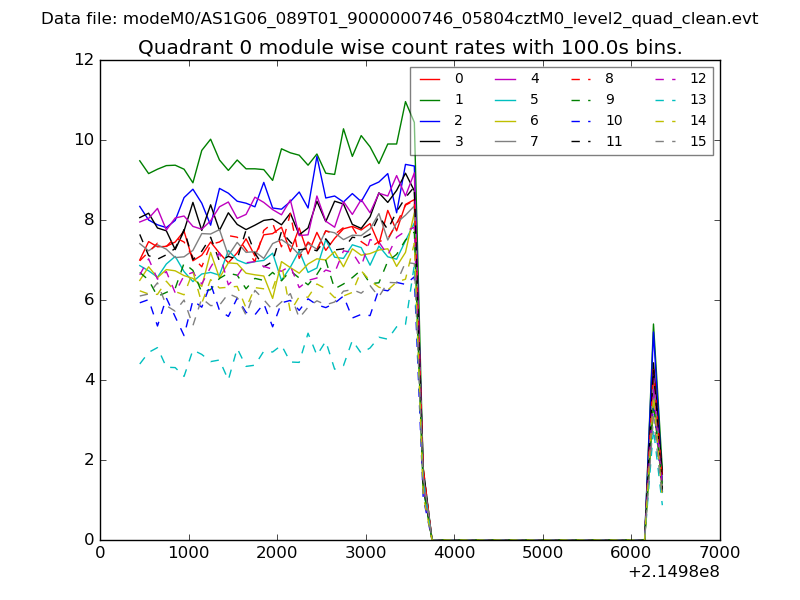 |
 |
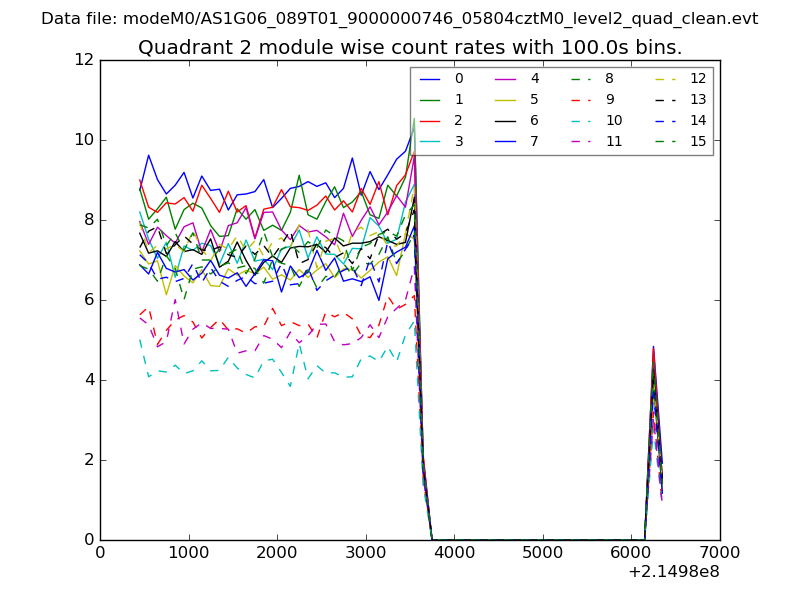
| Module-wise count rates for Quadrant B Data is divided into 100 sec bins |
 |
 |
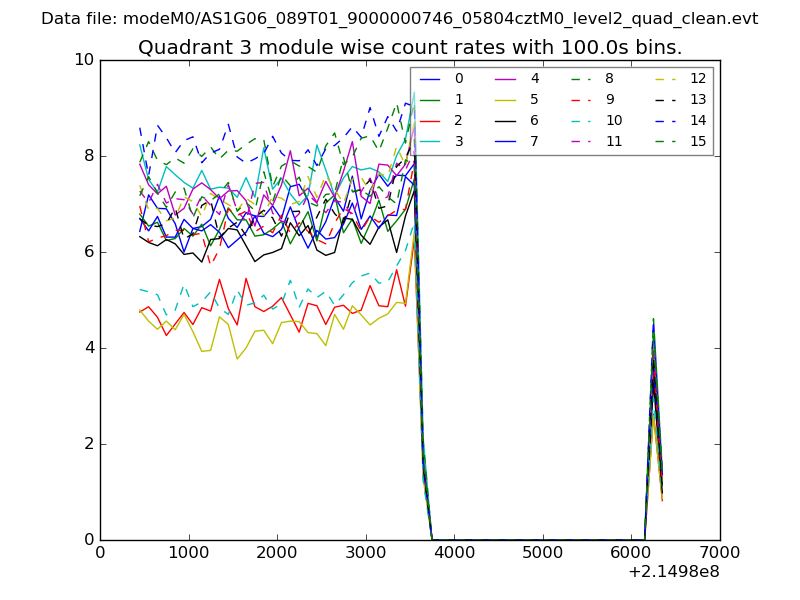
| Module-wise count rates for Quadrant C Data is divided into 100 sec bins |
 |
 |
| Module-wise count rates for Quadrant D Data is divided into 100 sec bins |
 |
 |
| Parameter | Plot |
|---|---|
| CZT HV Monitor | 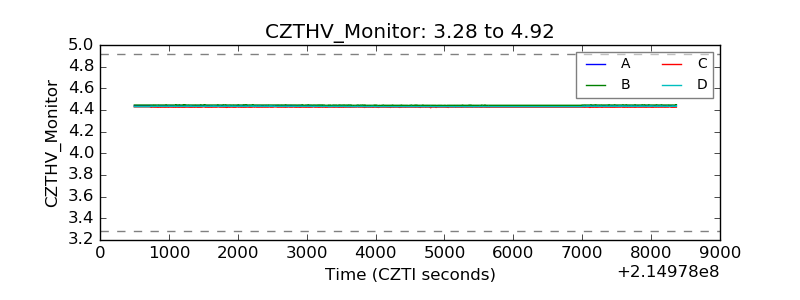 |
| D_VDD |  |
| Temperature 1 | 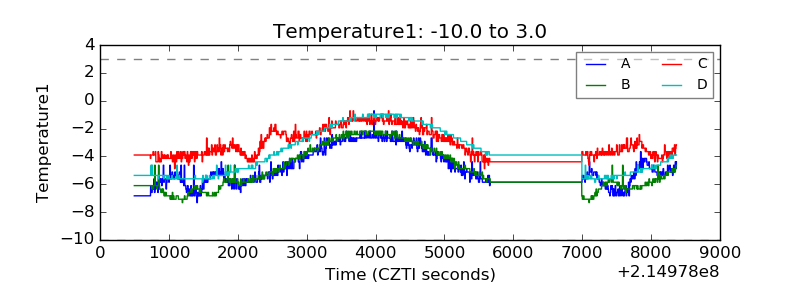 |
| Veto HV Monitor | 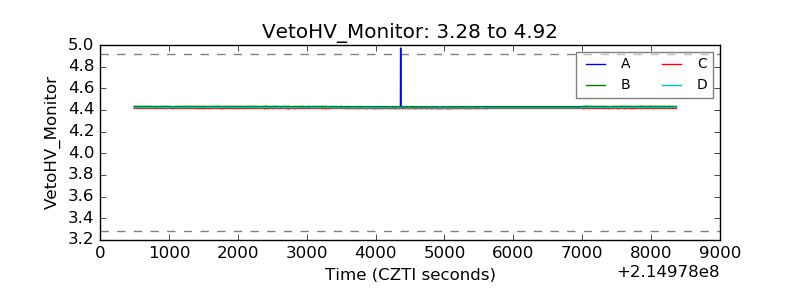 |
| Veto LLD | 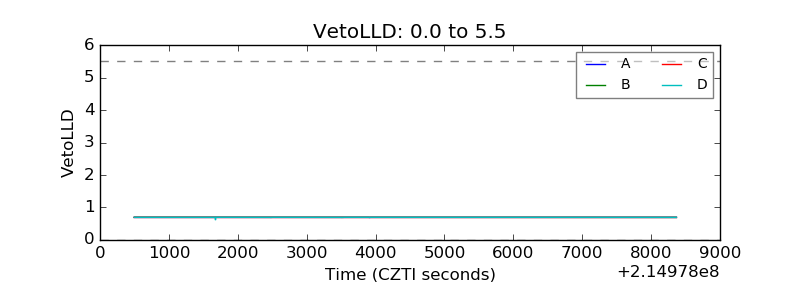 |
| Alpha Counter | 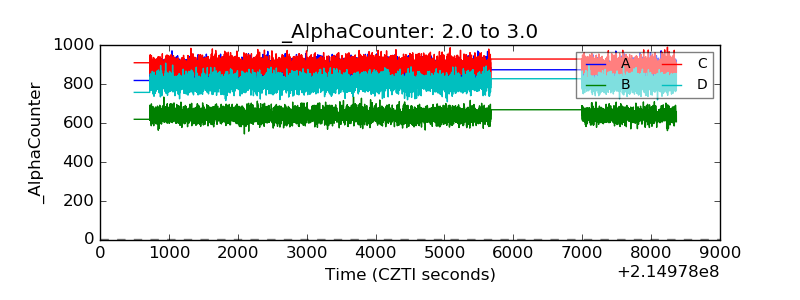 |
| _CPM_Rate |  |
| CZT Counter | 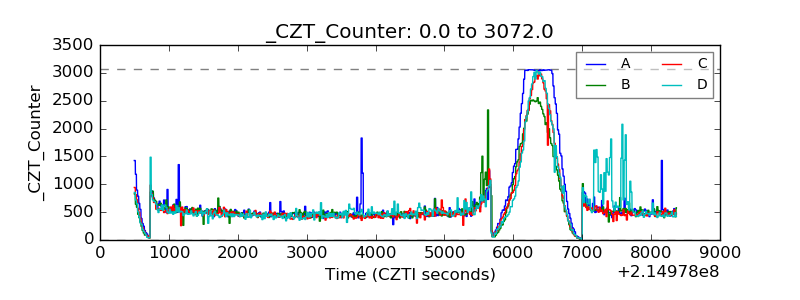 |
| +2.5 Volts monitor |  |
| +5 Volts monitor |  |
| _ROLL_ROT | 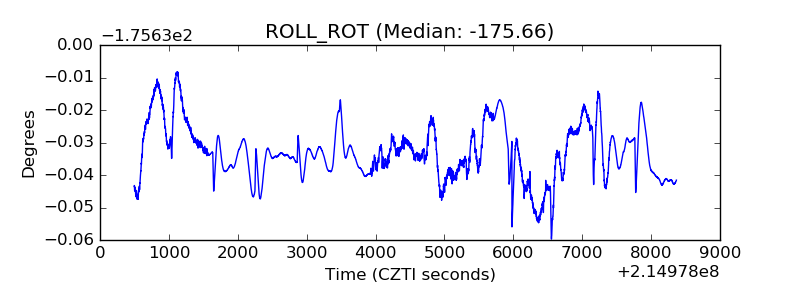 |
| _Roll_DEC | 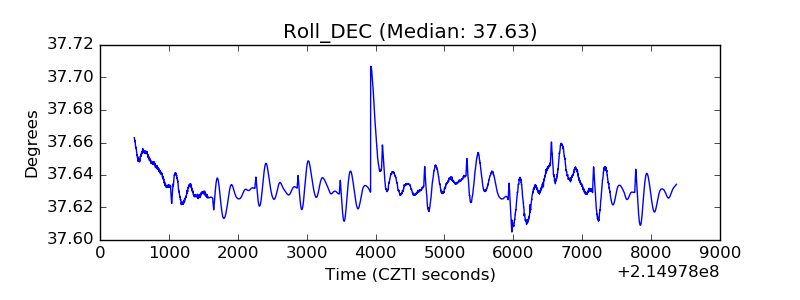 |
| _Roll_RA | 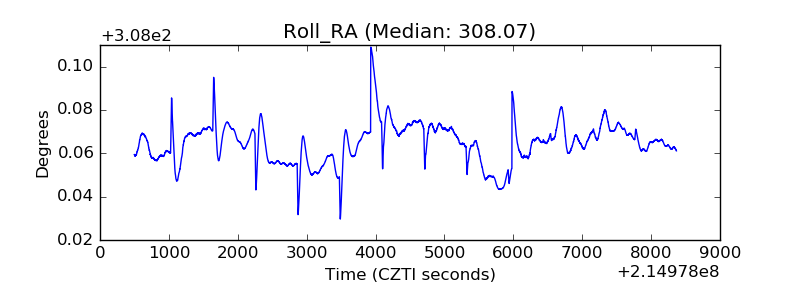 |
| Veto Counter | 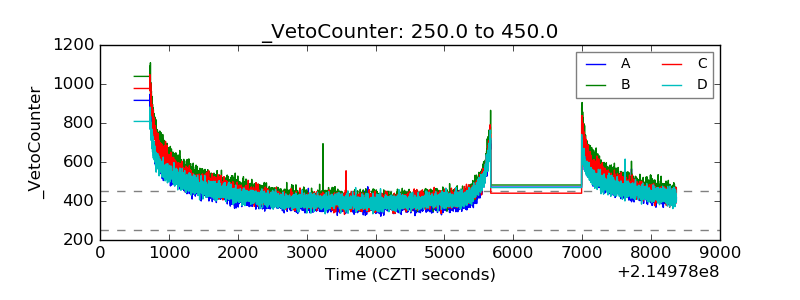 |