| Param | Original file | Final file |
|---|---|---|
| Filename | modeM0/AS1G06_089T01_9000000746_05805cztM0_level2.evt | modeM0/AS1G06_089T01_9000000746_05805cztM0_level2_quad_clean.evt |
| Size (bytes) | 509,857,920 | 74,658,240 |
| Size | 486.2 MB | 71.2 MB |
| Events in quadrant A | 4,299,742 | 453,927 |
| Events in quadrant B | 3,249,136 | 476,103 |
| Events in quadrant C | 3,060,689 | 461,477 |
| Events in quadrant D | 4,399,598 | 424,769 |
| Mode M9 | |||
|---|---|---|---|
| Quadrant | BADHDUFLAG | Total packets | Discarded packets |
| A | 0 | 16 | 0 |
| B | 0 | 16 | 0 |
| C | 0 | 16 | 0 |
| D | 0 | 17 | 0 |
| Mode M0 | |||
|---|---|---|---|
| Quadrant | BADHDUFLAG | Total packets | Discarded packets |
| A | 0 | 16864 | 3 |
| B | 0 | 13469 | 2 |
| C | 0 | 13321 | 2 |
| D | 0 | 17457 | 2 |
| Mode SS | |||
|---|---|---|---|
| Quadrant | BADHDUFLAG | Total packets | Discarded packets |
| A | 0 | 130 | 0 |
| B | 0 | 130 | 0 |
| C | 0 | 130 | 0 |
| D | 0 | 130 | 0 |
| Quadrant | Total seconds | Saturated seconds | Saturation percentage |
|---|---|---|---|
| A | 6361 | 329 | 5.172143% |
| B | 6361 | 122 | 1.917937% |
| C | 6361 | 78 | 1.226222% |
| D | 6361 | 353 | 5.549442% |
Noise dominated data is calculated using 1-second bins in cleaned event files. If a bin has >2000 counts, and if more than 50% of those come from <1% of pixels, then it is considered to be noise-dominated and hence unusable.
| Quadrant | # 1 sec bins | Bins with >0 counts | Bins with >2000 counts | High rate bins dominated by noise | Noise dominated (total time) | Noise dominated (detector-on time) | Marked lightcurve |
|---|---|---|---|---|---|---|---|
| A | 7571 | 6362 | 168 | 168 | 2.22% | 2.64% | 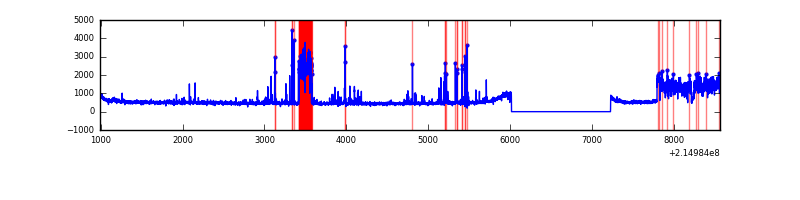 |
| B | 7571 | 6362 | 0 | 0 | 0.00% | 0.00% | 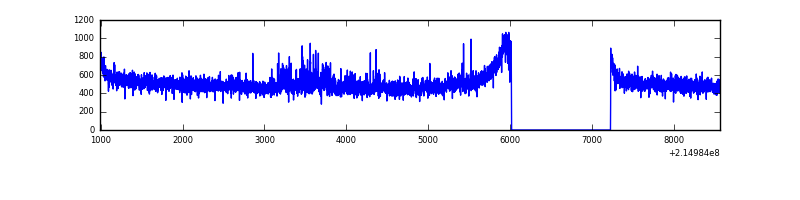 |
| C | 7571 | 6362 | 1 | 1 | 0.01% | 0.02% | 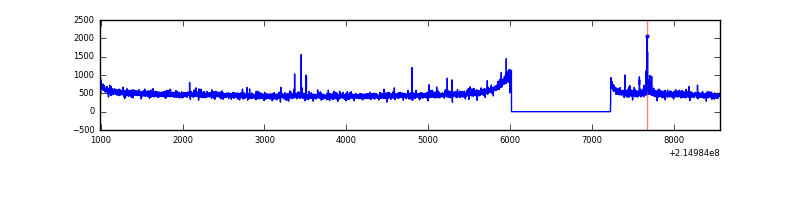 |
| D | 7571 | 6362 | 306 | 306 | 4.04% | 4.81% | 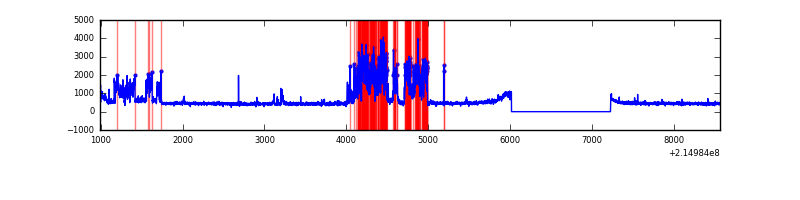 |
Top three noisy pixels from each quadrant. If the there are fewer than three noisy pixels in the level2.evt file, extra rows are filled as -1
| Pixel properties | Quadrant properties | ||||||
|---|---|---|---|---|---|---|---|
| Quadrant | DetID | PixID | Counts | Sigma | Mean | Median | Sigma |
| A | 15 | 79 | 731274 | 4563.84 | 789 | 773 | 160.1 |
| A | 15 | 236 | 352530 | 2197.62 | 789 | 773 | 160.1 |
| A | 0 | 31 | 172780 | 1074.62 | 789 | 773 | 160.1 |
| B | 15 | 204 | 84952 | 547.37 | 807 | 791 | 153.8 |
| B | 0 | 219 | 36378 | 231.45 | 807 | 791 | 153.8 |
| B | 12 | 111 | 14455 | 88.87 | 807 | 791 | 153.8 |
| C | 1 | 16 | 54814 | 302.84 | 768 | 772 | 178.5 |
| C | 13 | 61 | 6273 | 30.83 | 768 | 772 | 178.5 |
| C | 14 | 67 | 4383 | 20.24 | 768 | 772 | 178.5 |
| D | 8 | 230 | 816877 | 4394.68 | 758 | 735 | 185.7 |
| D | 7 | 203 | 641463 | 3450.13 | 758 | 735 | 185.7 |
| D | 2 | 136 | 35931 | 189.52 | 758 | 735 | 185.7 |
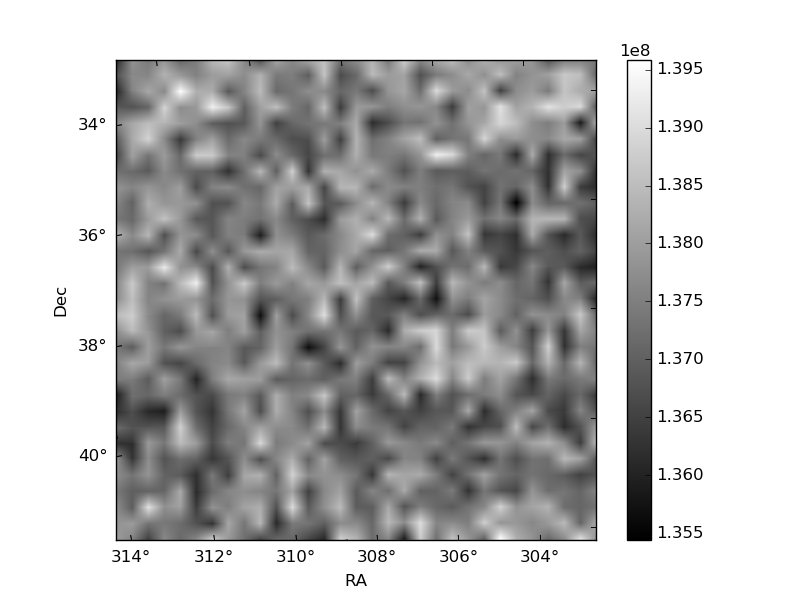
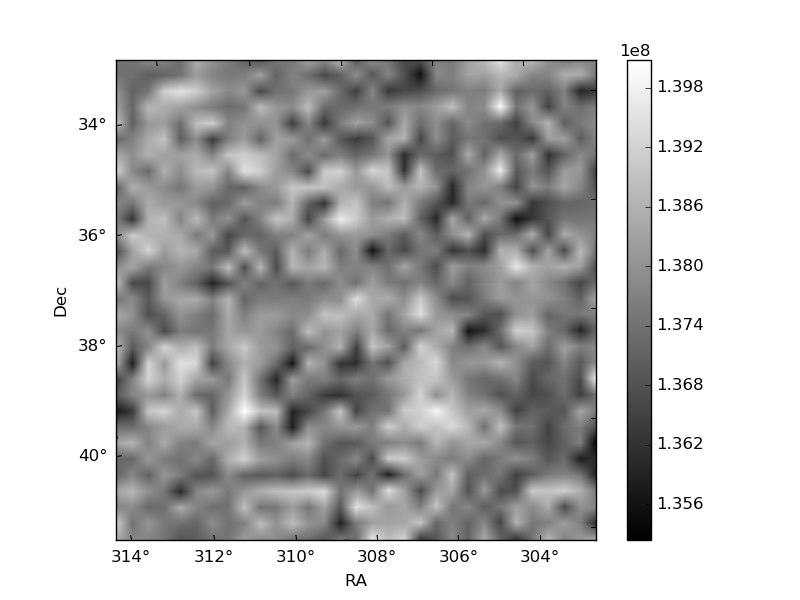
Histogram calculated using DETX and DETY for each event in the final _common_clean file
| Quadrant A |  |
 |
Quadrant B |
|---|---|---|---|
| Quadrant D | 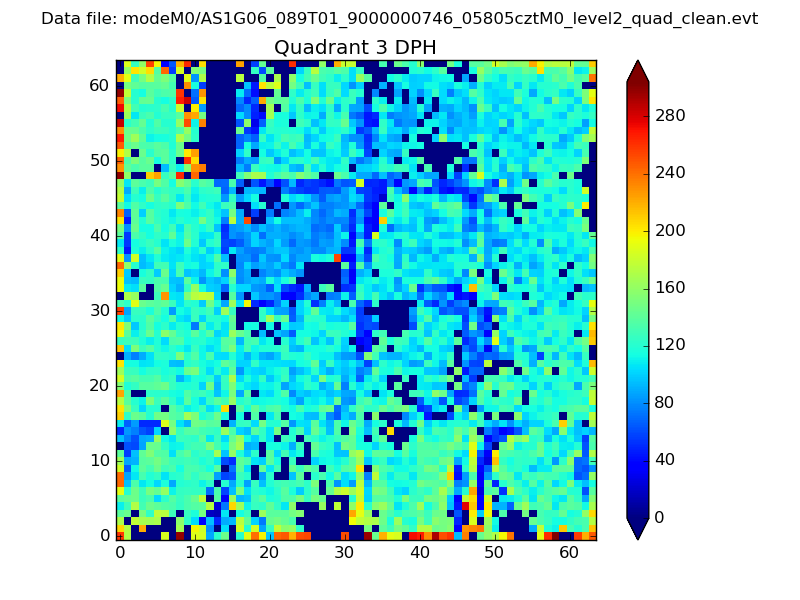 |
 |
Quadrant C |
| Plot type | Count rate plots | Images |
|---|---|---|
| Comparison with Poisson distribution Blue bars denote a histogram of data divided into 1 sec bins. Red curve is a Poisson curve with rate = median count rate of data. |
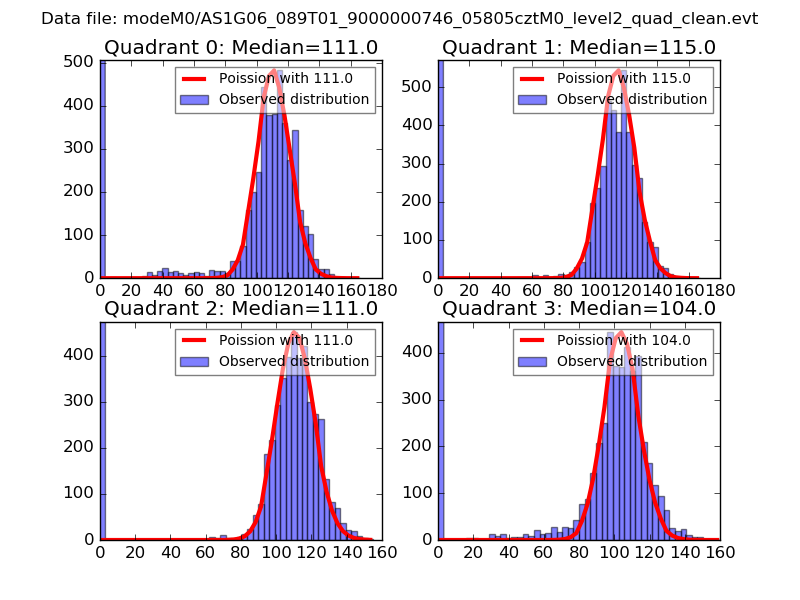 |
 |
| Quadrant-wise count rates Data is divided into 100 sec bins |
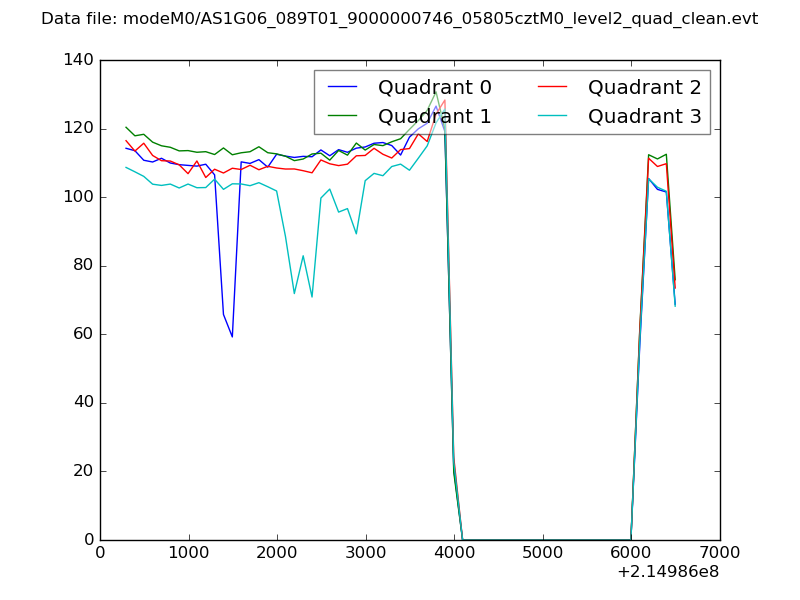 |
|
| Module-wise count rates for Quadrant A Data is divided into 100 sec bins |
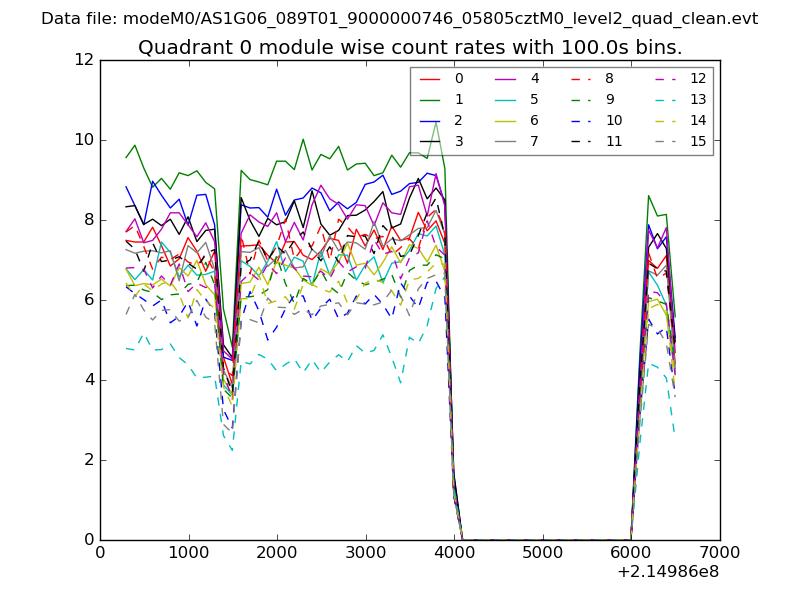 |
 |
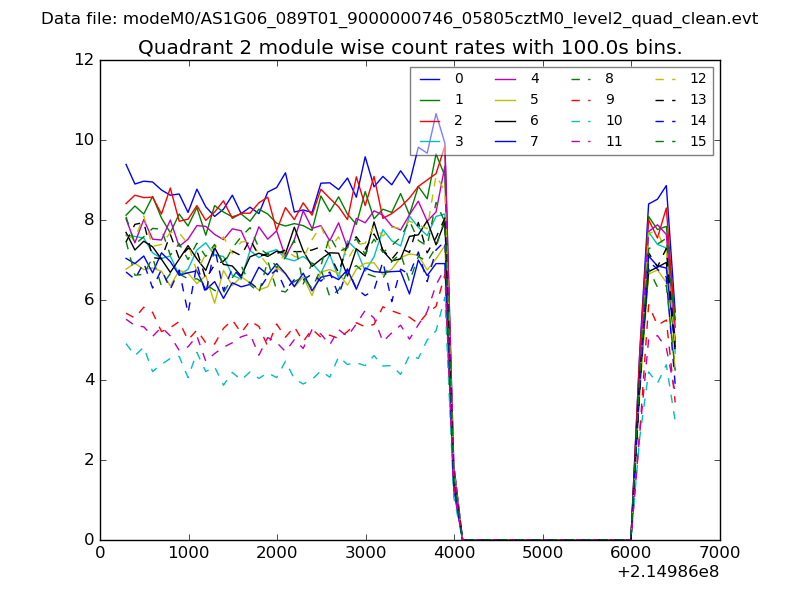
| Module-wise count rates for Quadrant B Data is divided into 100 sec bins |
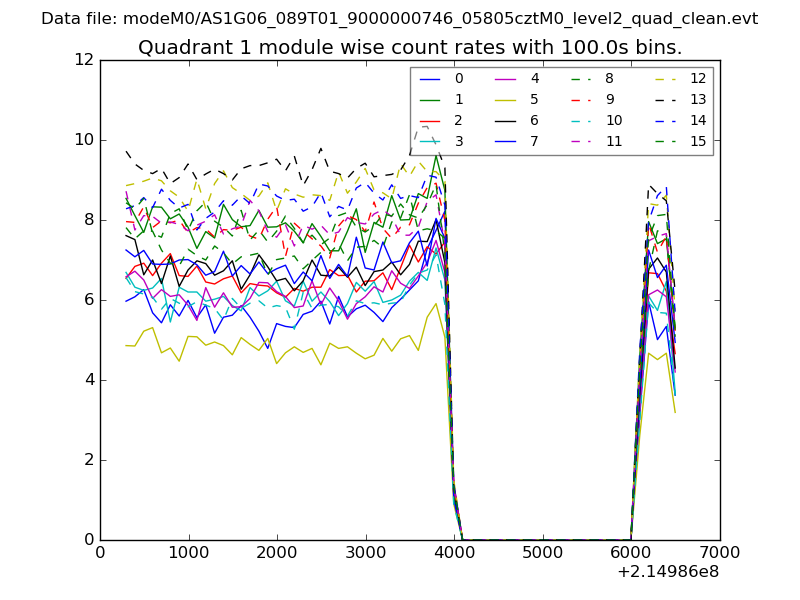 |
 |
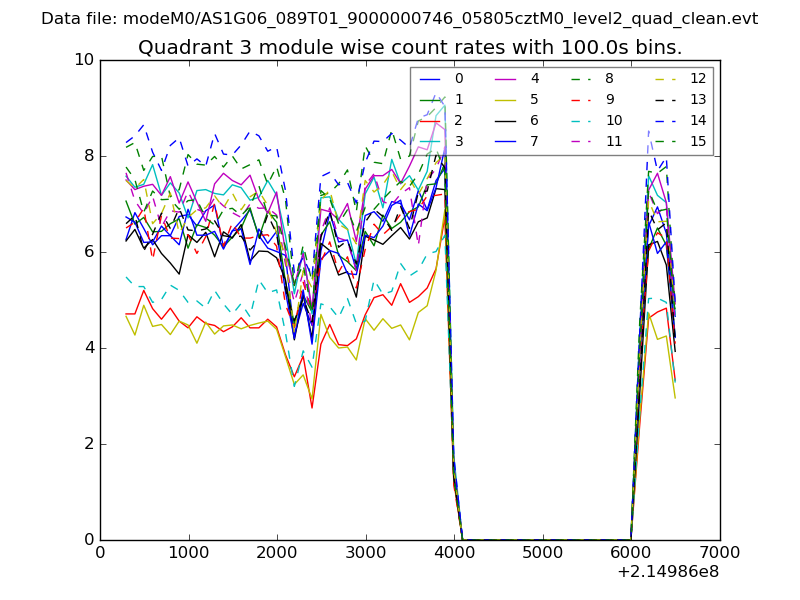
| Module-wise count rates for Quadrant C Data is divided into 100 sec bins |
 |
 |
| Module-wise count rates for Quadrant D Data is divided into 100 sec bins |
 |
 |
| Parameter | Plot |
|---|---|
| CZT HV Monitor | 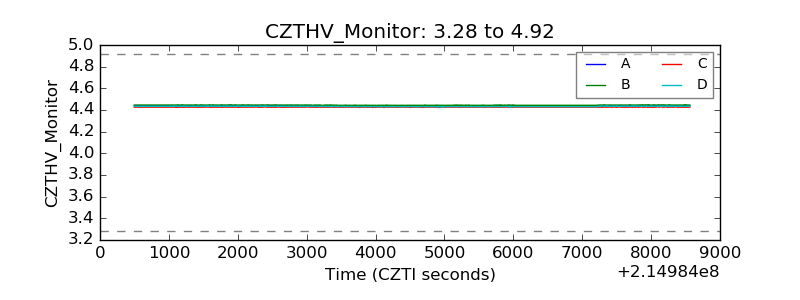 |
| D_VDD | 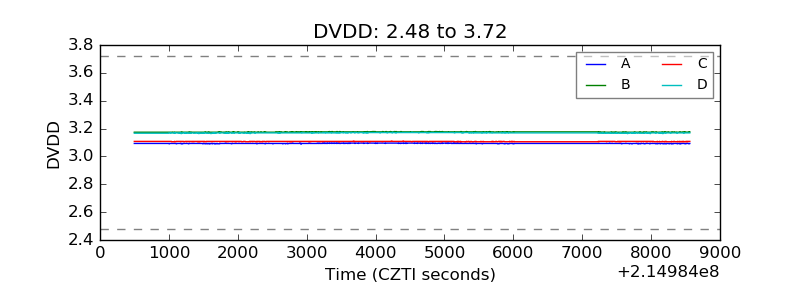 |
| Temperature 1 | 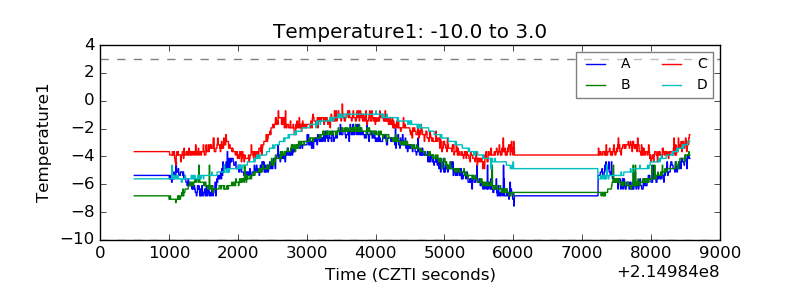 |
| Veto HV Monitor | 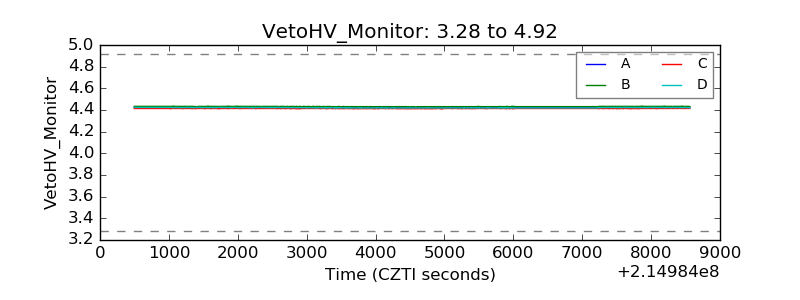 |
| Veto LLD | 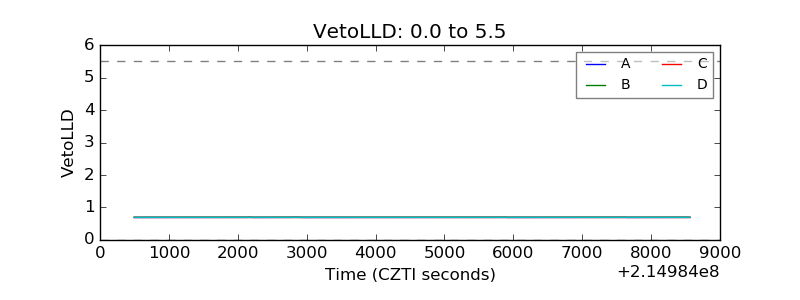 |
| Alpha Counter | 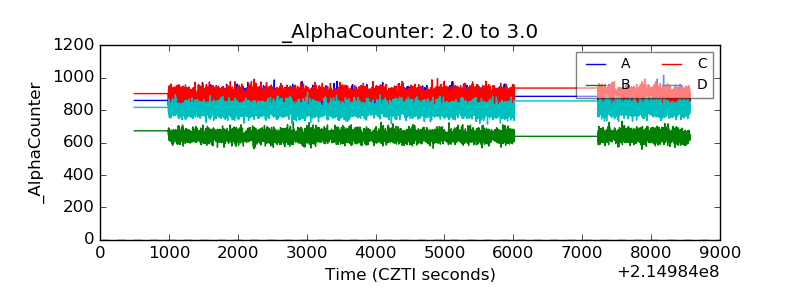 |
| _CPM_Rate | 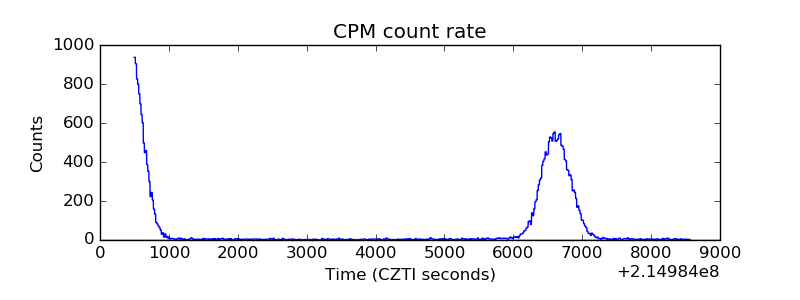 |
| CZT Counter | 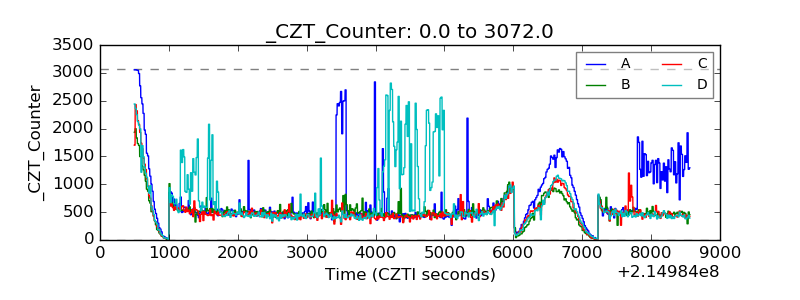 |
| +2.5 Volts monitor |  |
| +5 Volts monitor |  |
| _ROLL_ROT | 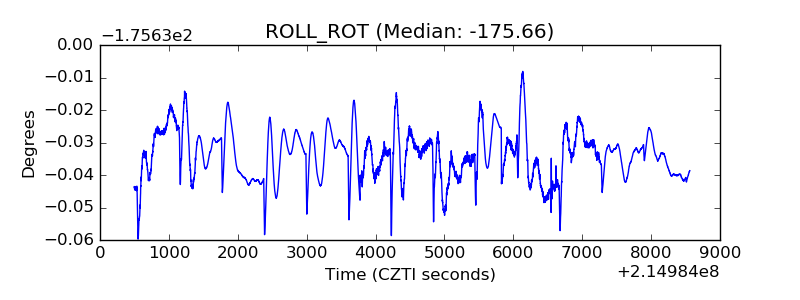 |
| _Roll_DEC | 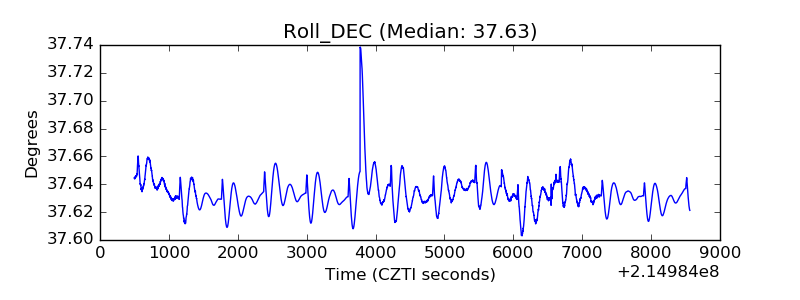 |
| _Roll_RA | 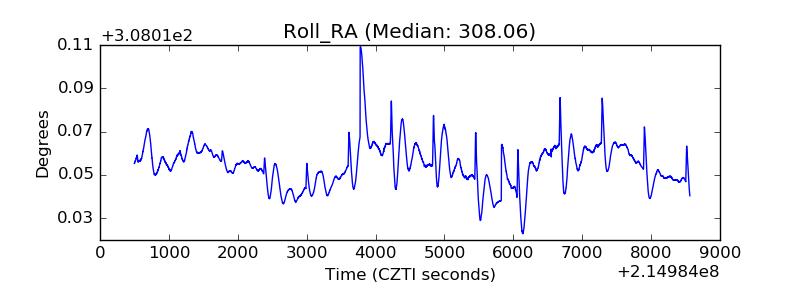 |
| Veto Counter | 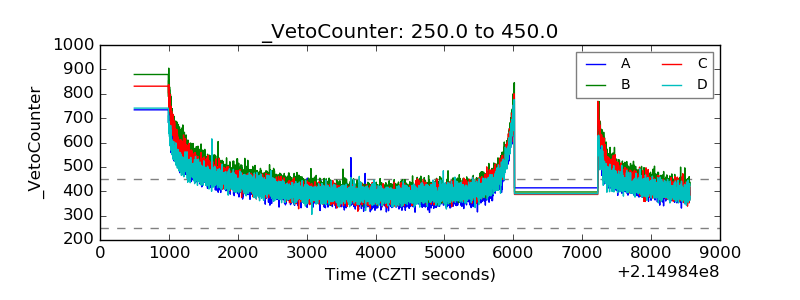 |