| Param | Original file | Final file |
|---|---|---|
| Filename | modeM0/AS1G06_089T01_9000000746_05806cztM0_level2.evt | modeM0/AS1G06_089T01_9000000746_05806cztM0_level2_quad_clean.evt |
| Size (bytes) | 507,401,280 | 80,660,160 |
| Size | 483.9 MB | 76.9 MB |
| Events in quadrant A | 4,950,493 | 489,983 |
| Events in quadrant B | 3,319,056 | 509,329 |
| Events in quadrant C | 3,168,215 | 495,151 |
| Events in quadrant D | 3,467,136 | 473,808 |
| Mode M9 | |||
|---|---|---|---|
| Quadrant | BADHDUFLAG | Total packets | Discarded packets |
| A | 0 | 18 | 0 |
| B | 0 | 18 | 0 |
| C | 0 | 18 | 0 |
| D | 0 | 19 | 0 |
| Mode M0 | |||
|---|---|---|---|
| Quadrant | BADHDUFLAG | Total packets | Discarded packets |
| A | 0 | 19287 | 3 |
| B | 0 | 14151 | 2 |
| C | 0 | 14113 | 2 |
| D | 0 | 14884 | 2 |
| Mode SS | |||
|---|---|---|---|
| Quadrant | BADHDUFLAG | Total packets | Discarded packets |
| A | 0 | 140 | 0 |
| B | 0 | 140 | 0 |
| C | 0 | 140 | 0 |
| D | 0 | 140 | 0 |
| Quadrant | Total seconds | Saturated seconds | Saturation percentage |
|---|---|---|---|
| A | 6795 | 373 | 5.489330% |
| B | 6795 | 162 | 2.384106% |
| C | 6795 | 112 | 1.648271% |
| D | 6795 | 148 | 2.178072% |
Noise dominated data is calculated using 1-second bins in cleaned event files. If a bin has >2000 counts, and if more than 50% of those come from <1% of pixels, then it is considered to be noise-dominated and hence unusable.
| Quadrant | # 1 sec bins | Bins with >0 counts | Bins with >2000 counts | High rate bins dominated by noise | Noise dominated (total time) | Noise dominated (detector-on time) | Marked lightcurve |
|---|---|---|---|---|---|---|---|
| A | 7680 | 6796 | 135 | 135 | 1.76% | 1.99% |  |
| B | 7680 | 6796 | 1 | 1 | 0.01% | 0.01% |  |
| C | 7680 | 6796 | 1 | 1 | 0.01% | 0.01% | 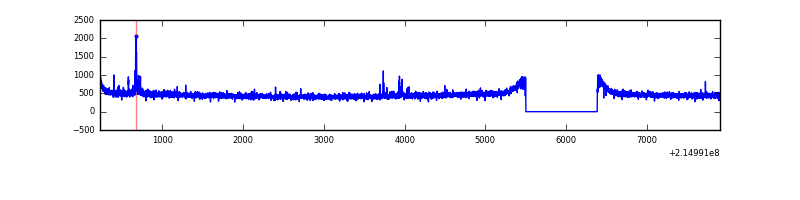 |
| D | 7680 | 6796 | 17 | 17 | 0.22% | 0.25% | 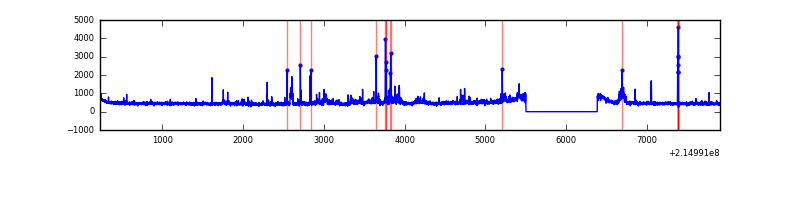 |
Top three noisy pixels from each quadrant. If the there are fewer than three noisy pixels in the level2.evt file, extra rows are filled as -1
| Pixel properties | Quadrant properties | ||||||
|---|---|---|---|---|---|---|---|
| Quadrant | DetID | PixID | Counts | Sigma | Mean | Median | Sigma |
| A | 15 | 79 | 1238580 | 7355.02 | 816 | 796 | 168.3 |
| A | 0 | 31 | 567763 | 3368.97 | 816 | 796 | 168.3 |
| A | 0 | 226 | 7894 | 42.18 | 816 | 796 | 168.3 |
| B | 15 | 204 | 55405 | 340.46 | 831 | 811 | 160.4 |
| B | 0 | 219 | 28127 | 170.35 | 831 | 811 | 160.4 |
| B | 12 | 111 | 15248 | 90.03 | 831 | 811 | 160.4 |
| C | 1 | 16 | 53261 | 283.64 | 797 | 799 | 185.0 |
| C | 13 | 61 | 6290 | 29.69 | 797 | 799 | 185.0 |
| C | 8 | 222 | 4591 | 20.5 | 797 | 799 | 185.0 |
| D | 8 | 195 | 228120 | 1149.73 | 799 | 773 | 197.7 |
| D | 4 | 95 | 61934 | 309.3 | 799 | 773 | 197.7 |
| D | 8 | 230 | 44403 | 220.64 | 799 | 773 | 197.7 |
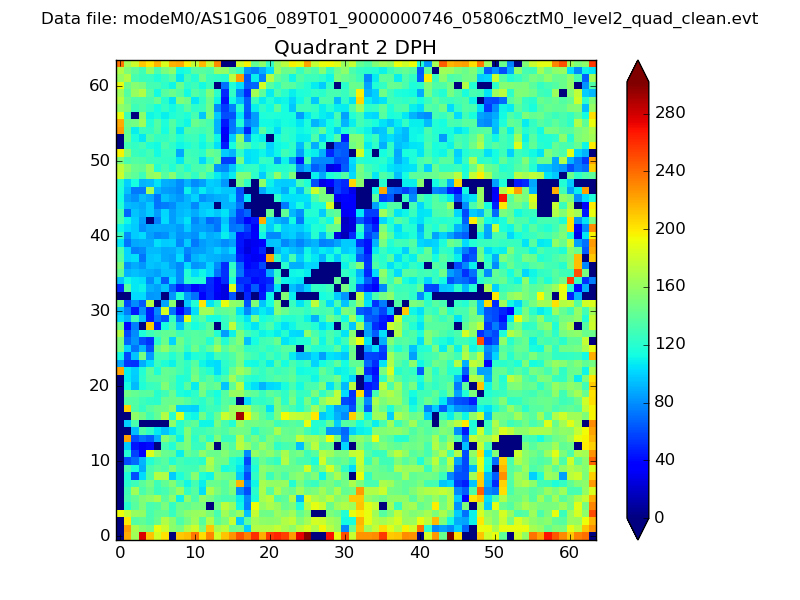
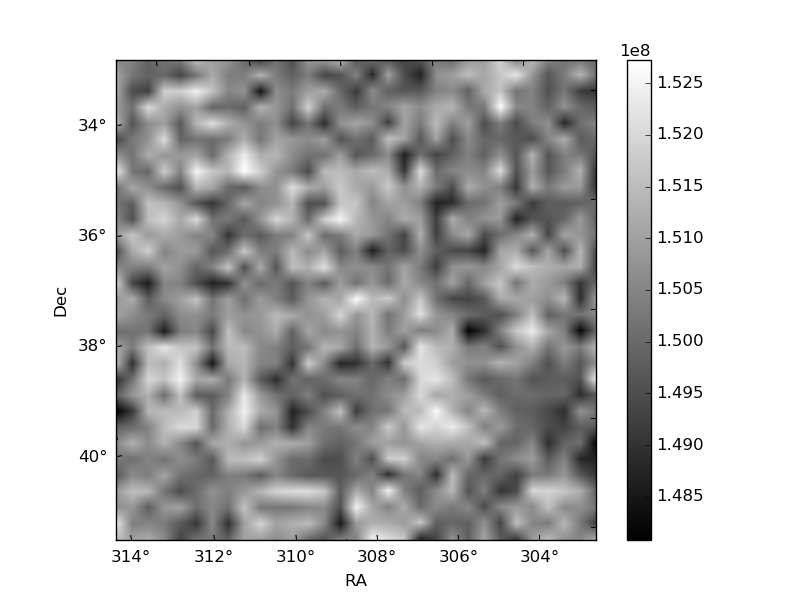
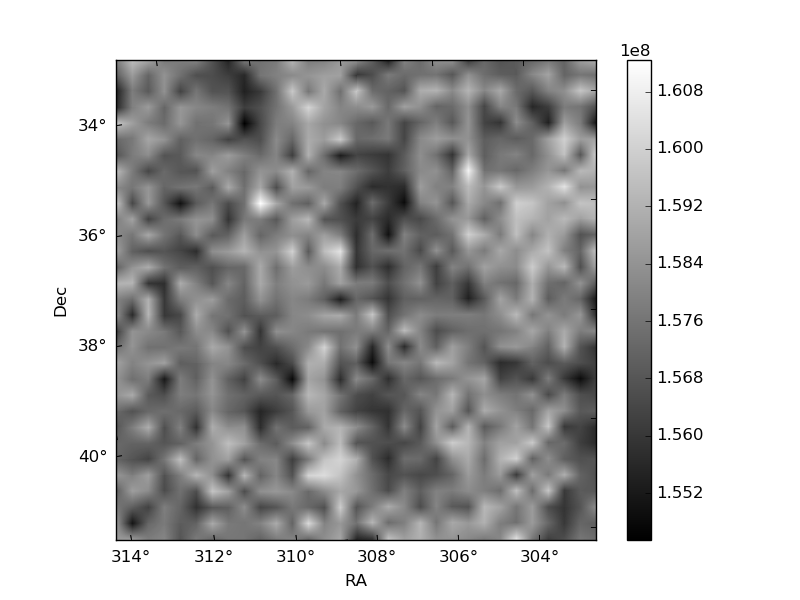
Histogram calculated using DETX and DETY for each event in the final _common_clean file
| Quadrant A | 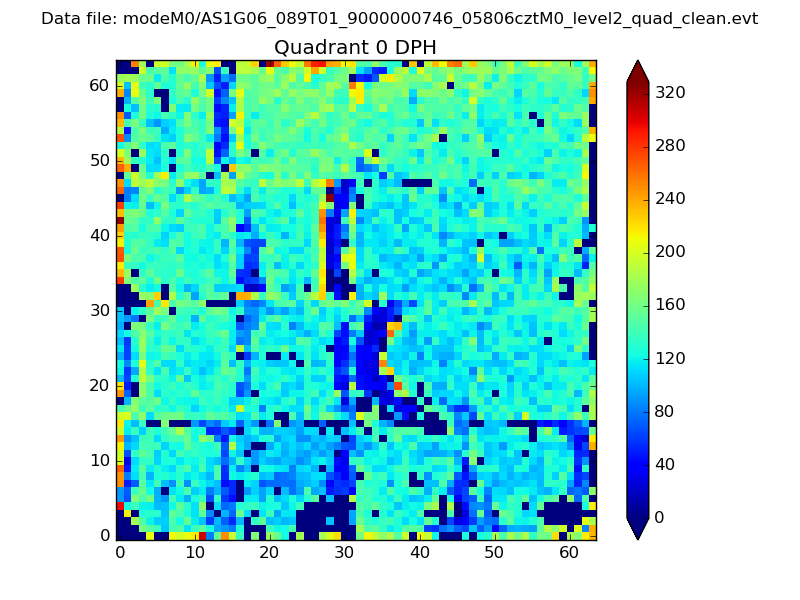 |
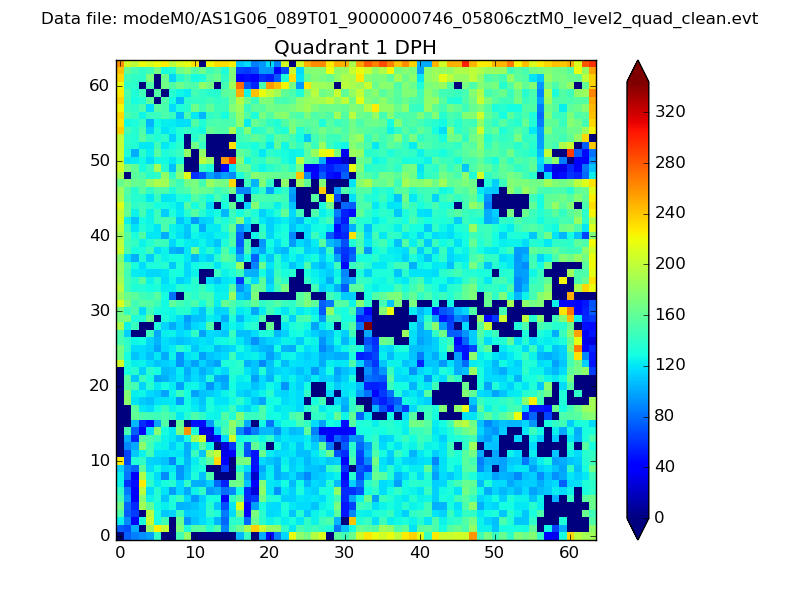 |
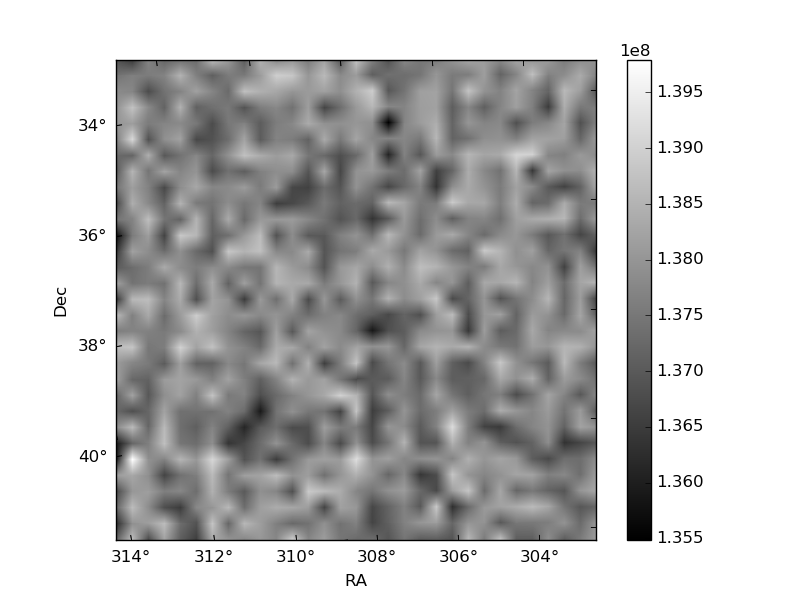
Quadrant B |
|---|---|---|---|
| Quadrant D | 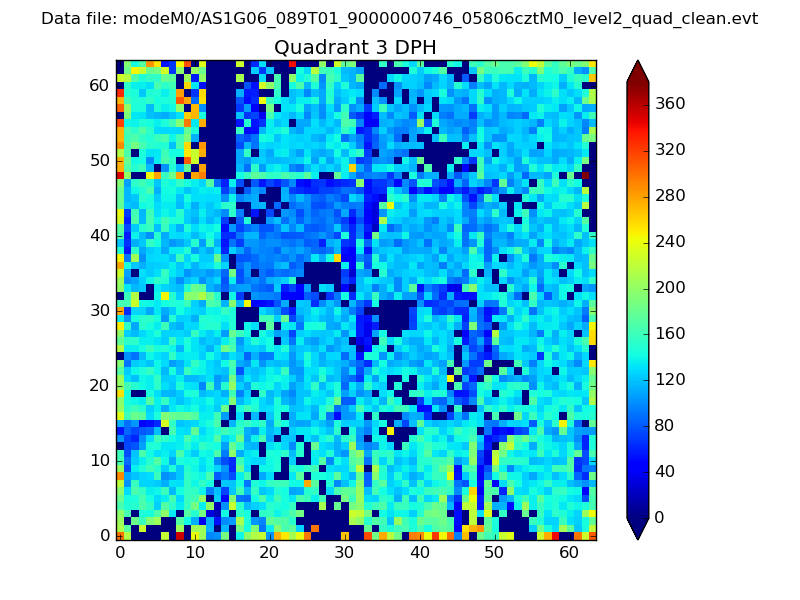 |
 |
Quadrant C |
| Plot type | Count rate plots | Images |
|---|---|---|
| Comparison with Poisson distribution Blue bars denote a histogram of data divided into 1 sec bins. Red curve is a Poisson curve with rate = median count rate of data. |
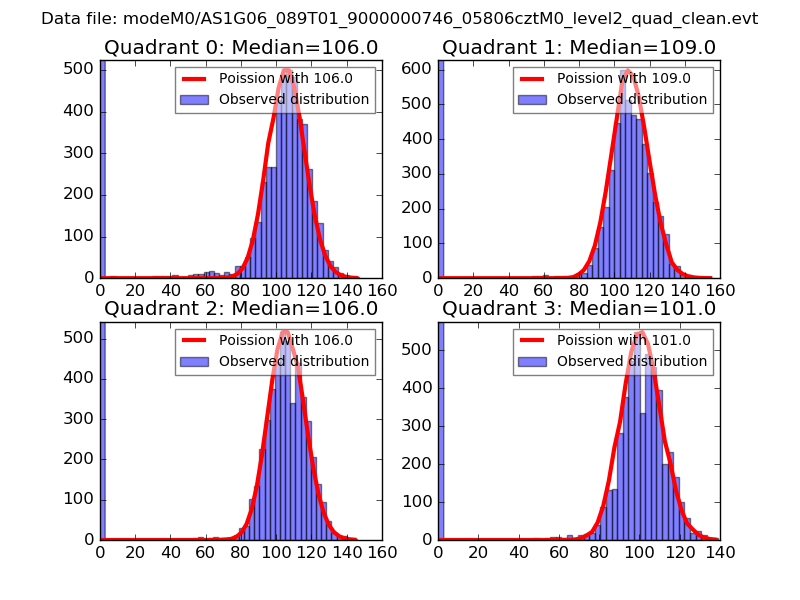 |
 |
| Quadrant-wise count rates Data is divided into 100 sec bins |
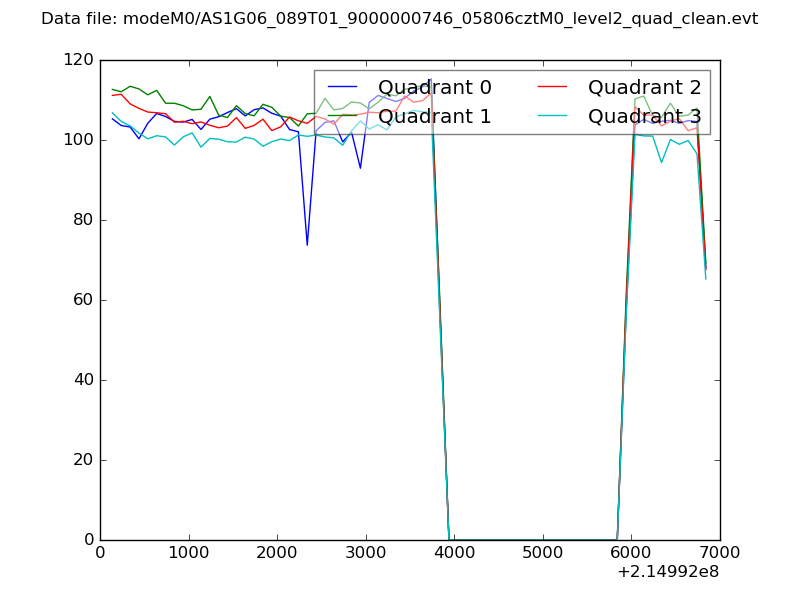 |
|
| Module-wise count rates for Quadrant A Data is divided into 100 sec bins |
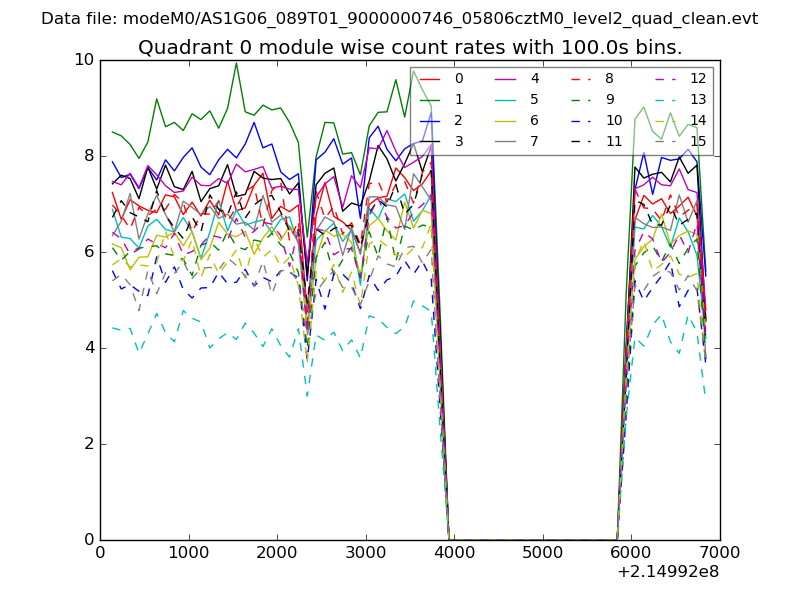 |
 |
| Module-wise count rates for Quadrant B Data is divided into 100 sec bins |
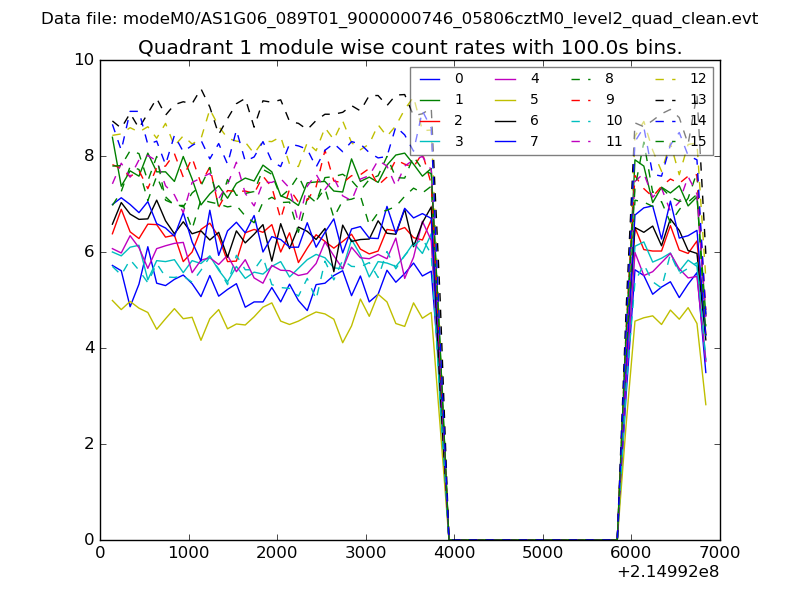 |
 |
| Module-wise count rates for Quadrant C Data is divided into 100 sec bins |
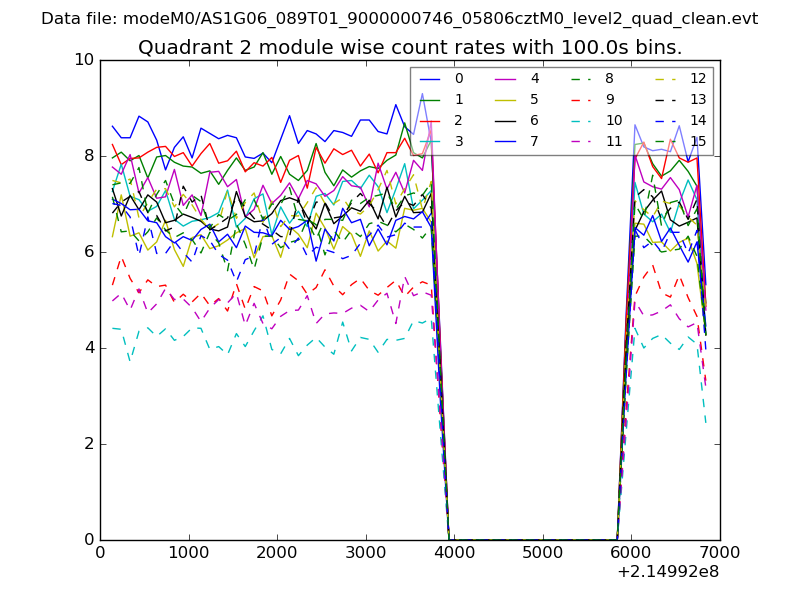 |
 |
| Module-wise count rates for Quadrant D Data is divided into 100 sec bins |
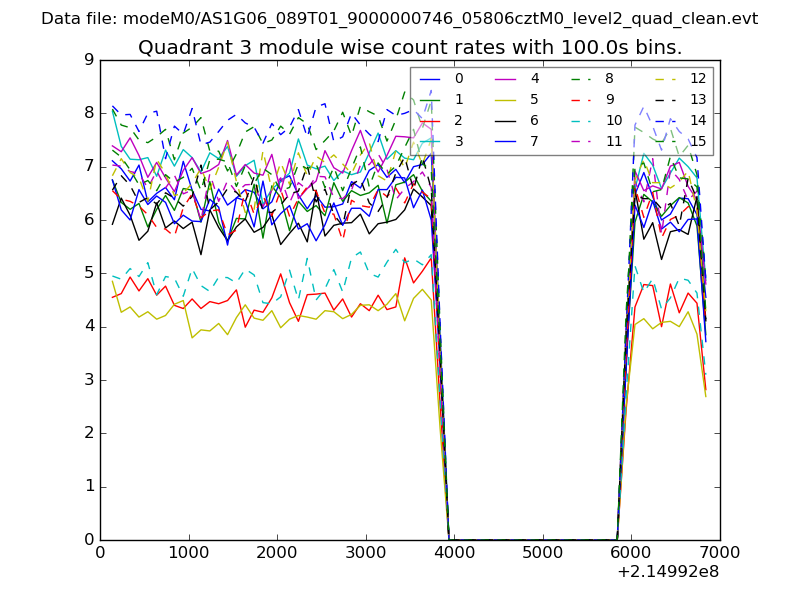 |
 |
| Parameter | Plot |
|---|---|
| CZT HV Monitor | 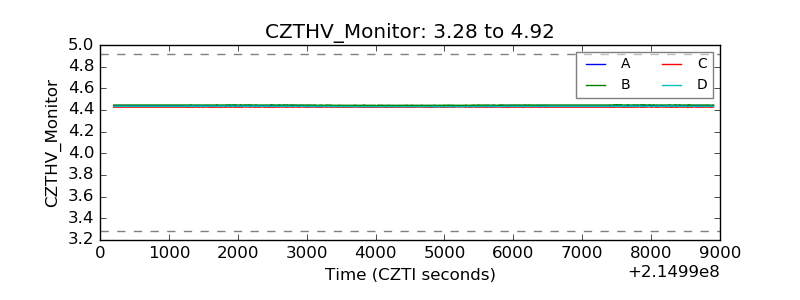 |
| D_VDD | 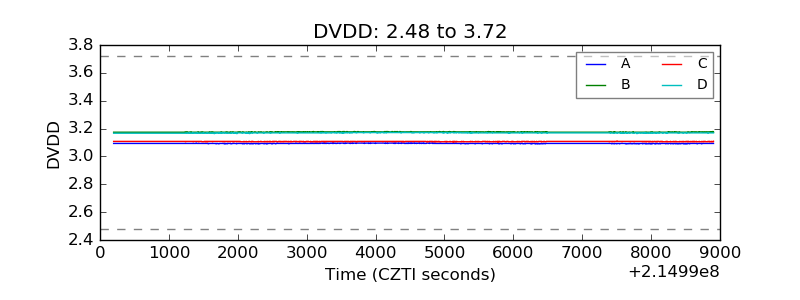 |
| Temperature 1 | 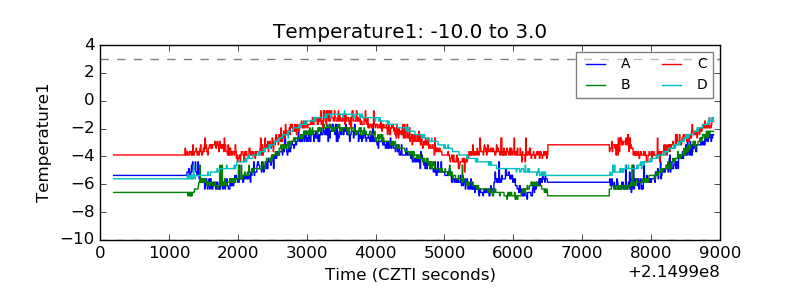 |
| Veto HV Monitor | 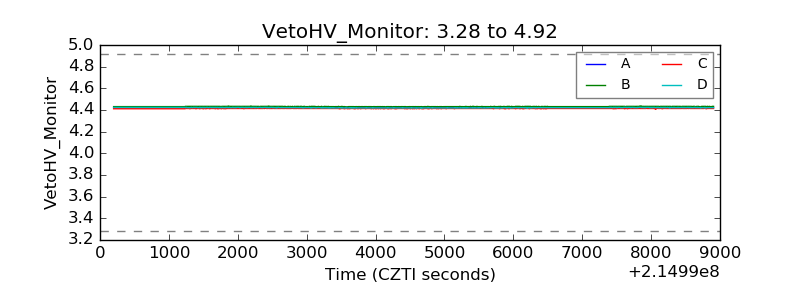 |
| Veto LLD | 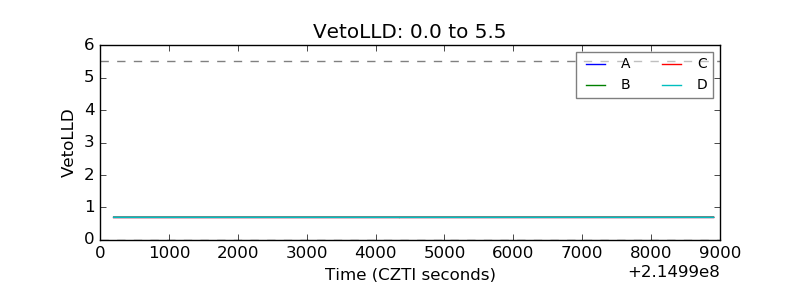 |
| Alpha Counter | 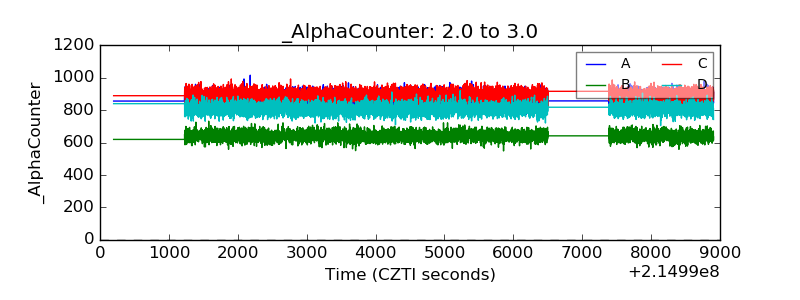 |
| _CPM_Rate | 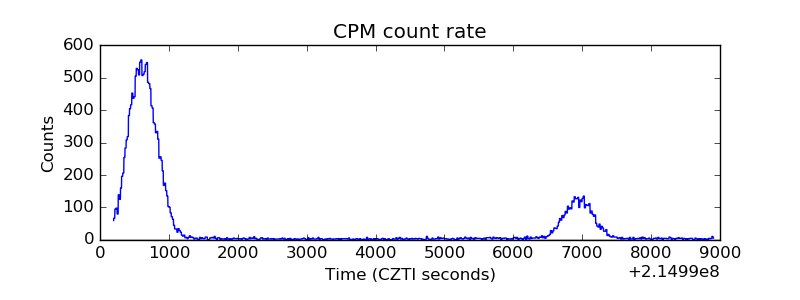 |
| CZT Counter | 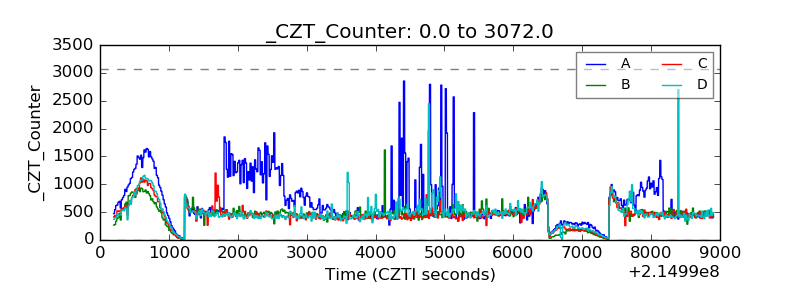 |
| +2.5 Volts monitor |  |
| +5 Volts monitor |  |
| _ROLL_ROT | 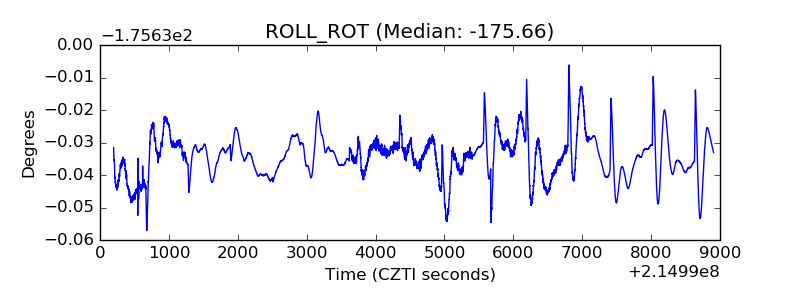 |
| _Roll_DEC | 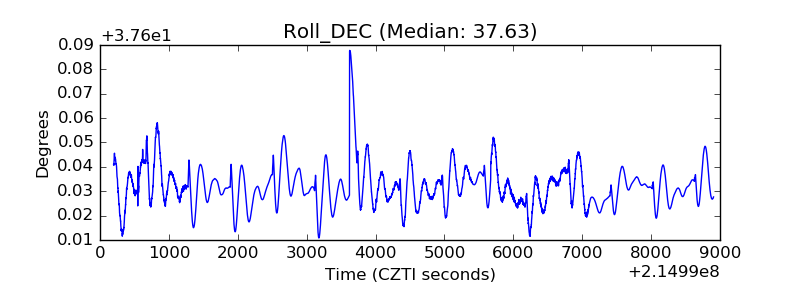 |
| _Roll_RA | 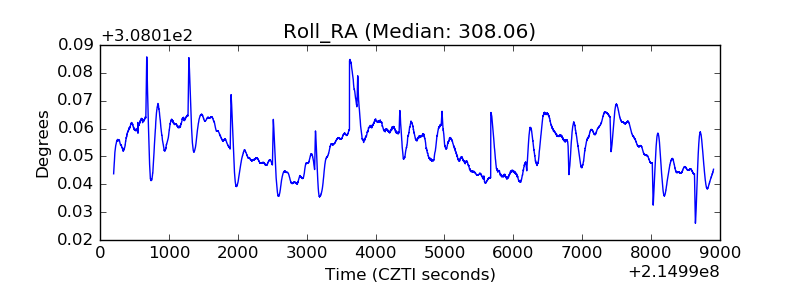 |
| Veto Counter | 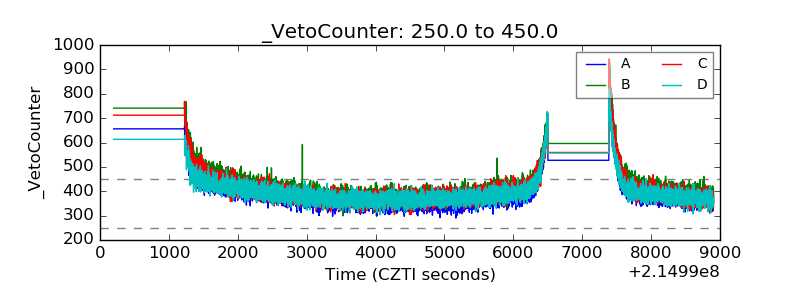 |