| Param | Original file | Final file |
|---|---|---|
| Filename | modeM0/AS1G06_089T01_9000000746_05807cztM0_level2.evt | modeM0/AS1G06_089T01_9000000746_05807cztM0_level2_quad_clean.evt |
| Size (bytes) | 438,433,920 | 85,014,720 |
| Size | 418.1 MB | 81.1 MB |
| Events in quadrant A | 3,237,376 | 533,556 |
| Events in quadrant B | 3,320,021 | 537,963 |
| Events in quadrant C | 3,097,974 | 525,602 |
| Events in quadrant D | 3,159,528 | 502,940 |
| Mode M9 | |||
|---|---|---|---|
| Quadrant | BADHDUFLAG | Total packets | Discarded packets |
| A | 0 | 4 | 0 |
| B | 0 | 4 | 0 |
| C | 0 | 4 | 0 |
| D | 0 | 4 | 0 |
| Mode M0 | |||
|---|---|---|---|
| Quadrant | BADHDUFLAG | Total packets | Discarded packets |
| A | 0 | 14400 | 3 |
| B | 0 | 14254 | 2 |
| C | 0 | 14082 | 2 |
| D | 0 | 14375 | 2 |
| Mode SS | |||
|---|---|---|---|
| Quadrant | BADHDUFLAG | Total packets | Discarded packets |
| A | 0 | 138 | 0 |
| B | 0 | 138 | 0 |
| C | 0 | 138 | 0 |
| D | 0 | 138 | 0 |
| Quadrant | Total seconds | Saturated seconds | Saturation percentage |
|---|---|---|---|
| A | 6808 | 172 | 2.526439% |
| B | 6808 | 154 | 2.262045% |
| C | 6808 | 108 | 1.586369% |
| D | 6808 | 160 | 2.350176% |
Noise dominated data is calculated using 1-second bins in cleaned event files. If a bin has >2000 counts, and if more than 50% of those come from <1% of pixels, then it is considered to be noise-dominated and hence unusable.
| Quadrant | # 1 sec bins | Bins with >0 counts | Bins with >2000 counts | High rate bins dominated by noise | Noise dominated (total time) | Noise dominated (detector-on time) | Marked lightcurve |
|---|---|---|---|---|---|---|---|
| A | 7253 | 6810 | 4 | 4 | 0.06% | 0.06% |  |
| B | 7253 | 6810 | 2 | 2 | 0.03% | 0.03% | 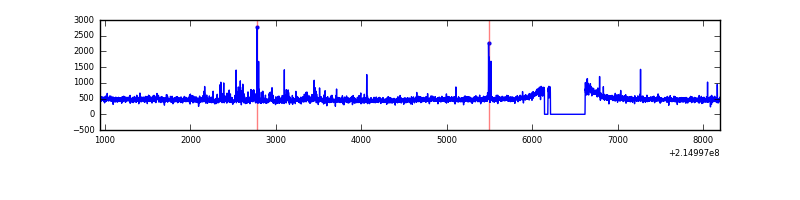 |
| C | 7253 | 6810 | 3 | 3 | 0.04% | 0.04% | 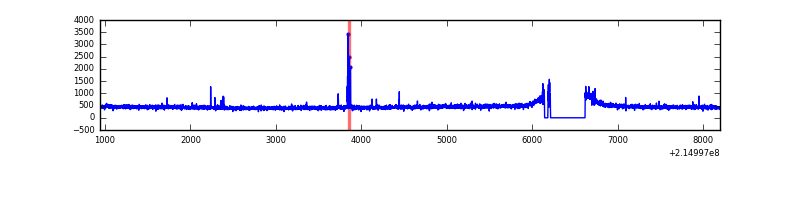 |
| D | 7253 | 6810 | 21 | 21 | 0.29% | 0.31% | 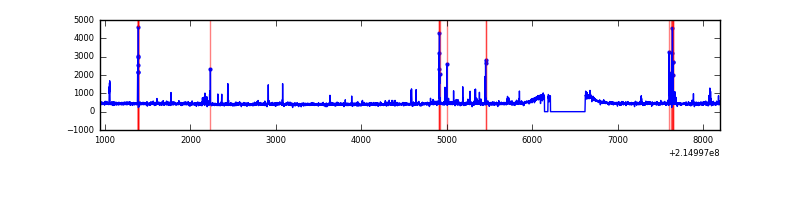 |
Top three noisy pixels from each quadrant. If the there are fewer than three noisy pixels in the level2.evt file, extra rows are filled as -1
| Pixel properties | Quadrant properties | ||||||
|---|---|---|---|---|---|---|---|
| Quadrant | DetID | PixID | Counts | Sigma | Mean | Median | Sigma |
| A | 15 | 79 | 121676 | 728.85 | 804 | 783 | 165.9 |
| A | 0 | 50 | 19853 | 114.97 | 804 | 783 | 165.9 |
| A | 12 | 194 | 7922 | 43.04 | 804 | 783 | 165.9 |
| B | 15 | 204 | 81171 | 515.88 | 808 | 789 | 155.8 |
| B | 4 | 81 | 39406 | 247.84 | 808 | 789 | 155.8 |
| B | 15 | 85 | 21221 | 131.13 | 808 | 789 | 155.8 |
| C | 1 | 16 | 59891 | 326.31 | 776 | 778 | 181.2 |
| C | 13 | 61 | 6067 | 29.2 | 776 | 778 | 181.2 |
| C | 8 | 79 | 5240 | 24.63 | 776 | 778 | 181.2 |
| D | 4 | 95 | 51656 | 261.5 | 781 | 754 | 194.7 |
| D | 1 | 31 | 38304 | 192.9 | 781 | 754 | 194.7 |
| D | 2 | 14 | 35425 | 178.11 | 781 | 754 | 194.7 |
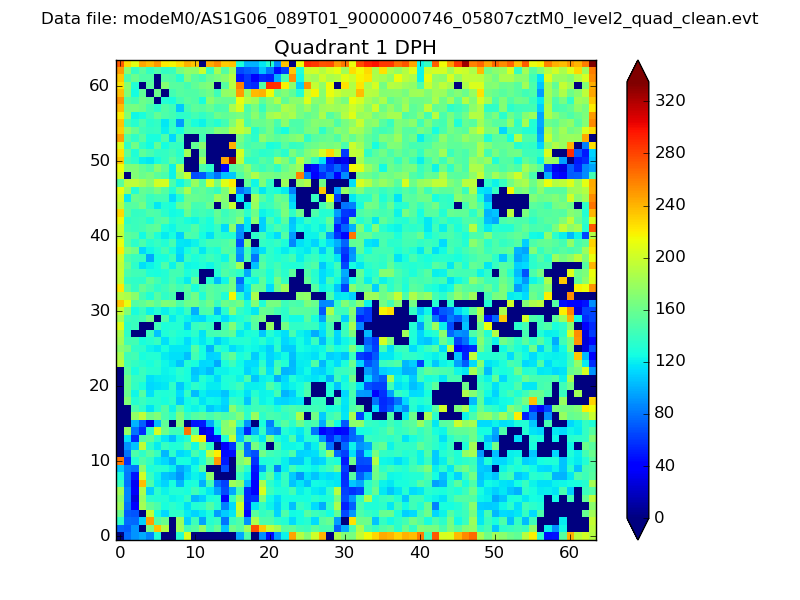
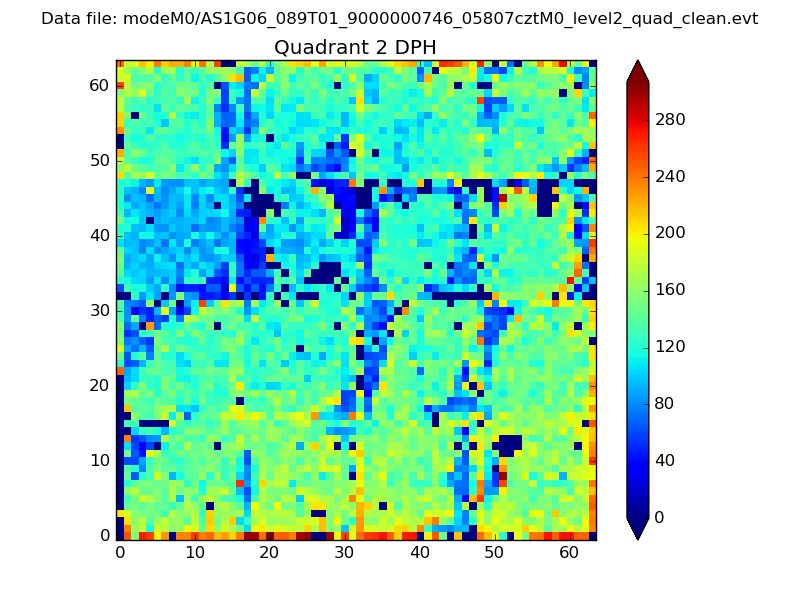
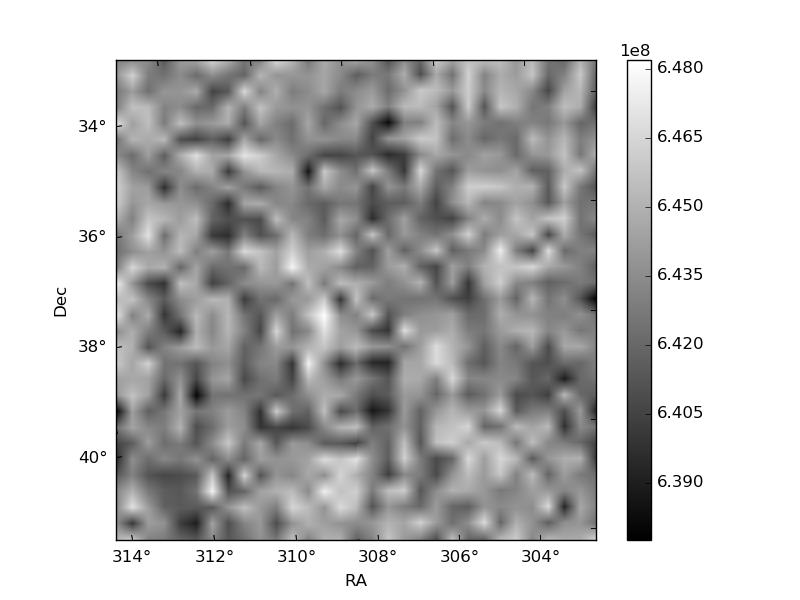
Histogram calculated using DETX and DETY for each event in the final _common_clean file
| Quadrant A | 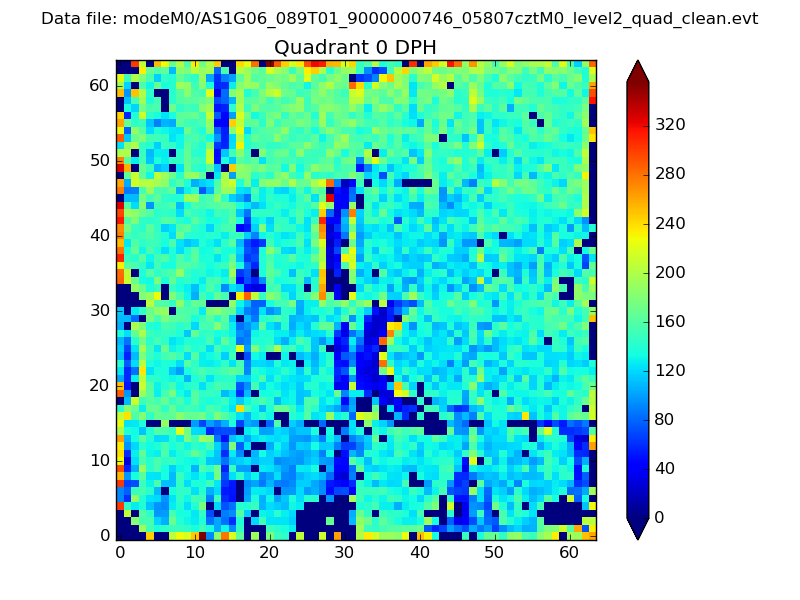 |
 |
Quadrant B |
|---|---|---|---|
| Quadrant D | 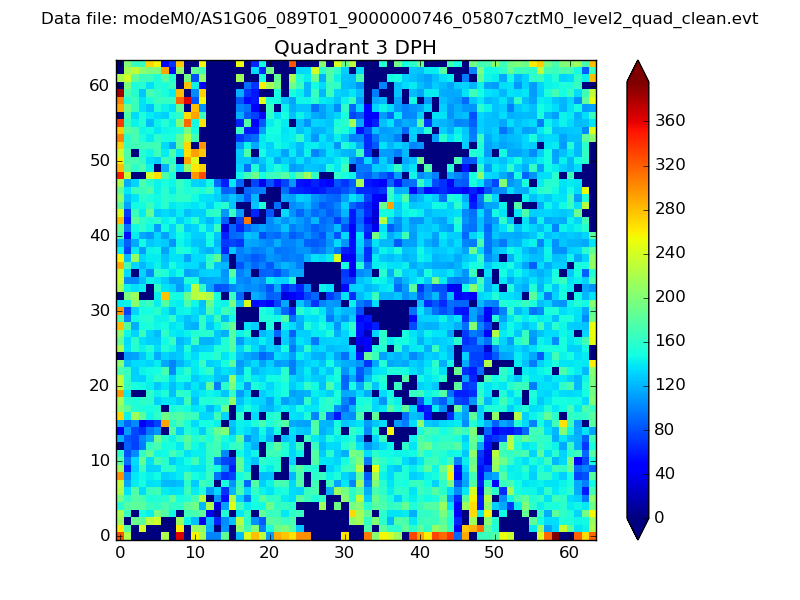 |
 |
Quadrant C |
| Plot type | Count rate plots | Images |
|---|---|---|
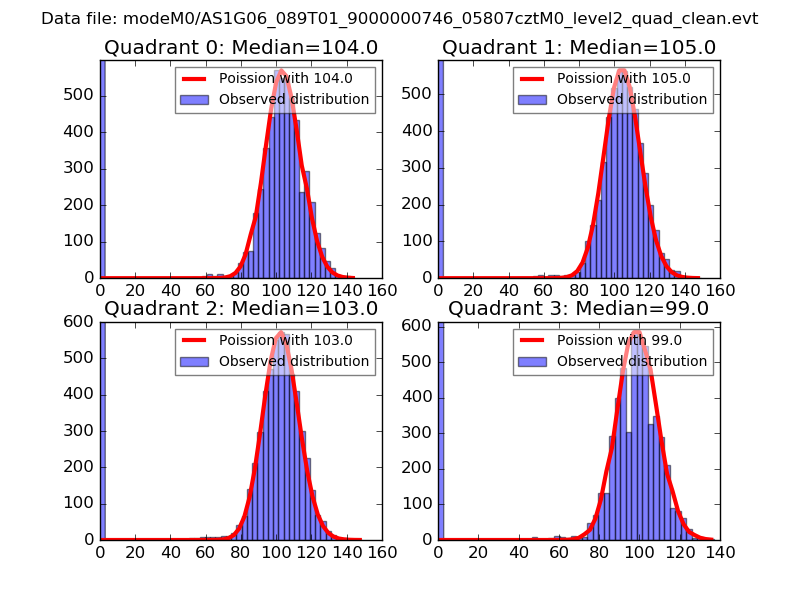
| Comparison with Poisson distribution Blue bars denote a histogram of data divided into 1 sec bins. Red curve is a Poisson curve with rate = median count rate of data. |
 |
 |
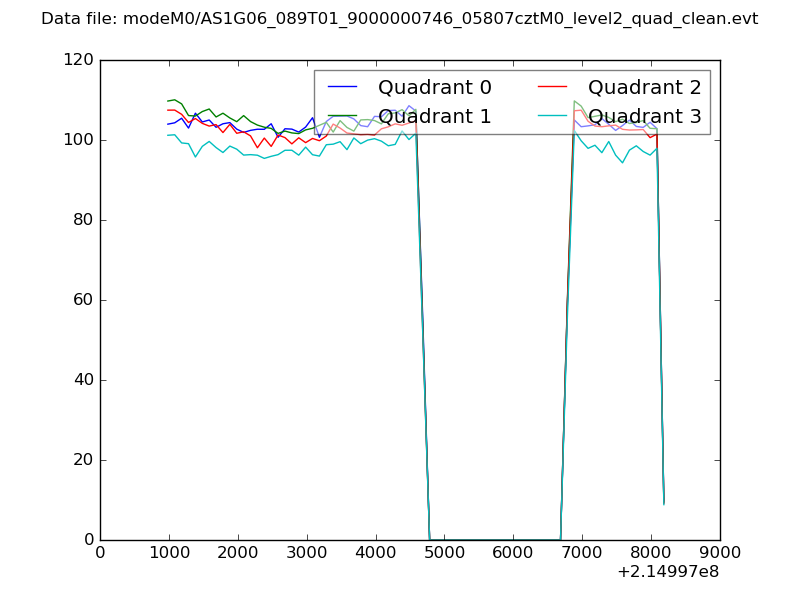
| Quadrant-wise count rates Data is divided into 100 sec bins |
 |
|
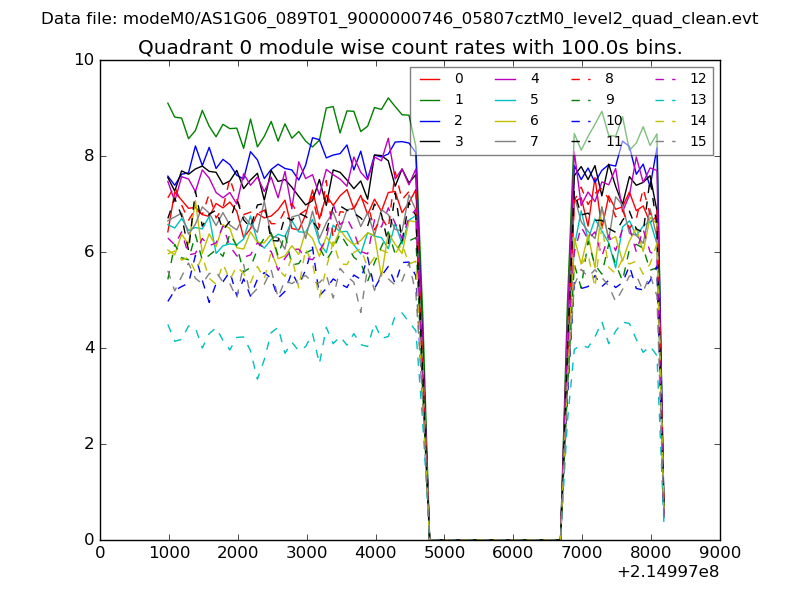
| Module-wise count rates for Quadrant A Data is divided into 100 sec bins |
 |
 |
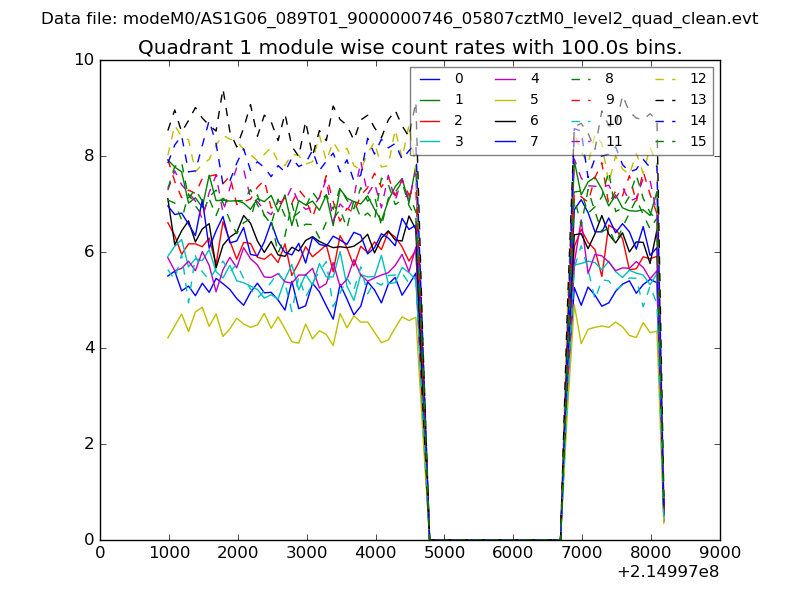
| Module-wise count rates for Quadrant B Data is divided into 100 sec bins |
 |
 |
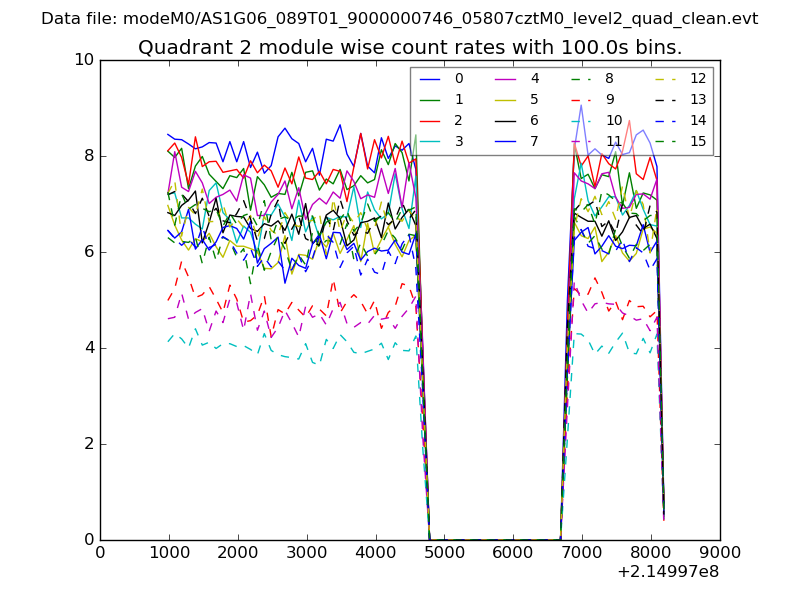
| Module-wise count rates for Quadrant C Data is divided into 100 sec bins |
 |
 |
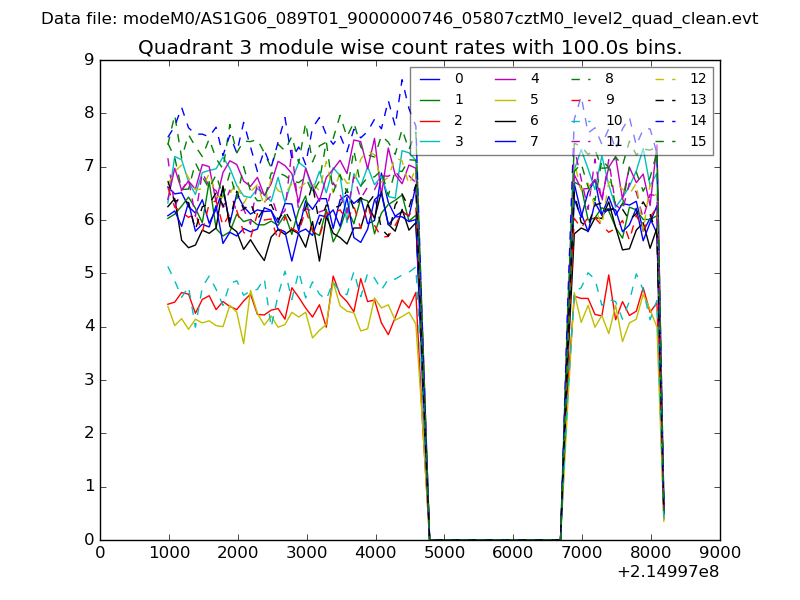
| Module-wise count rates for Quadrant D Data is divided into 100 sec bins |
 |
 |
| Parameter | Plot |
|---|---|
| CZT HV Monitor | 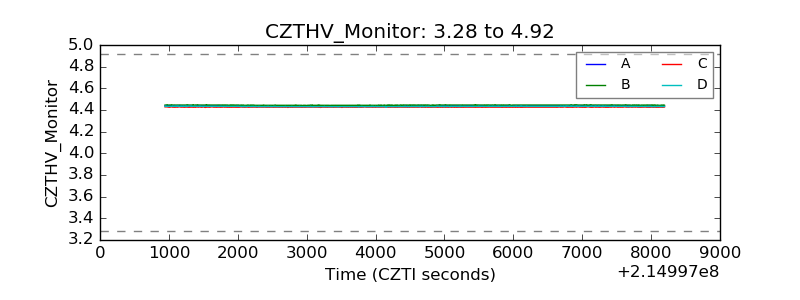 |
| D_VDD | 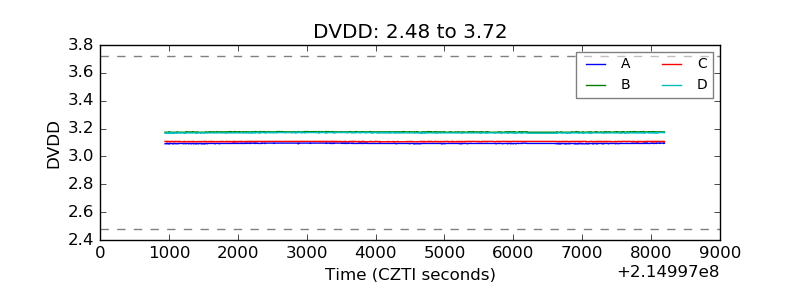 |
| Temperature 1 | 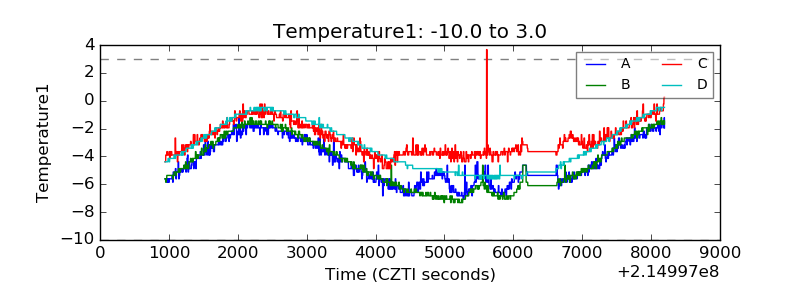 |
| Veto HV Monitor | 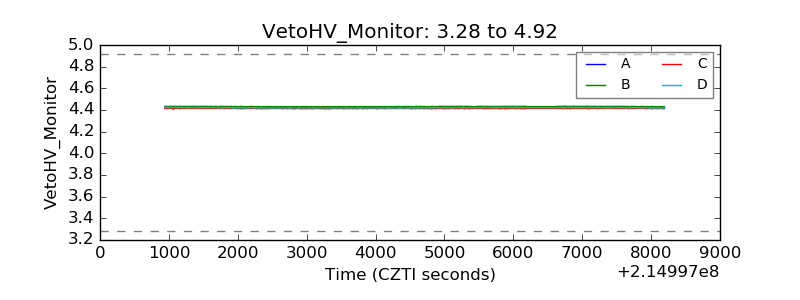 |
| Veto LLD | 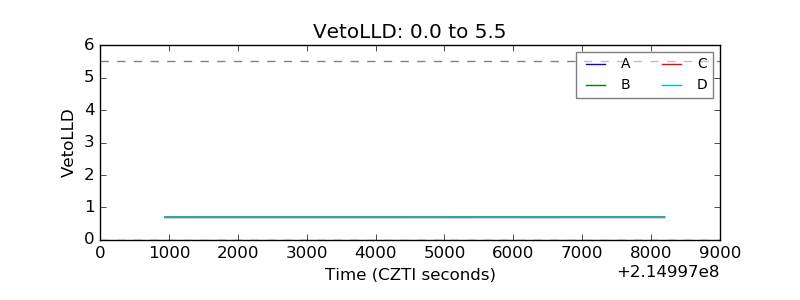 |
| Alpha Counter | 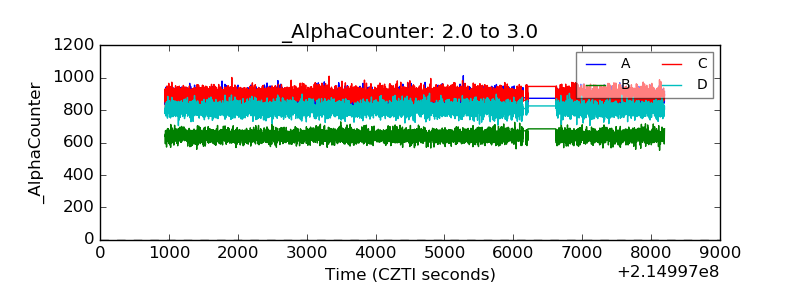 |
| _CPM_Rate | 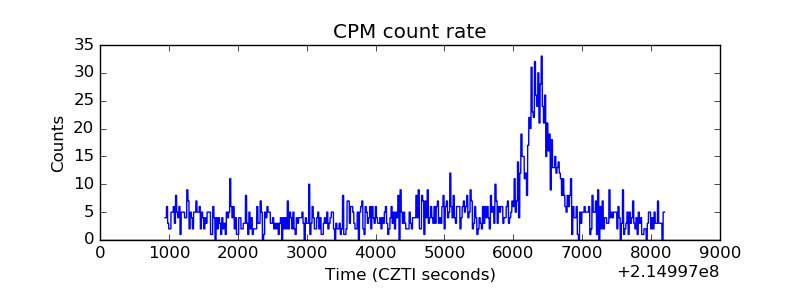 |
| CZT Counter | 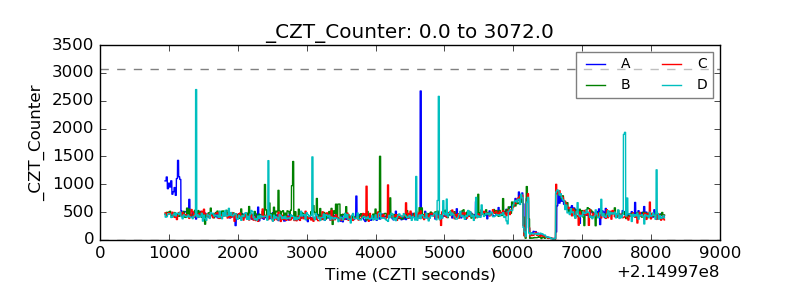 |
| +2.5 Volts monitor |  |
| +5 Volts monitor |  |
| _ROLL_ROT | 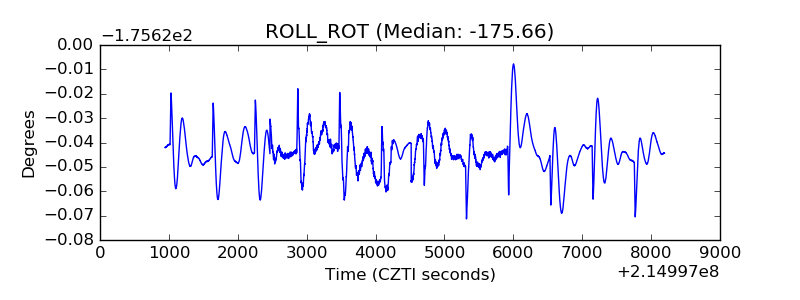 |
| _Roll_DEC | 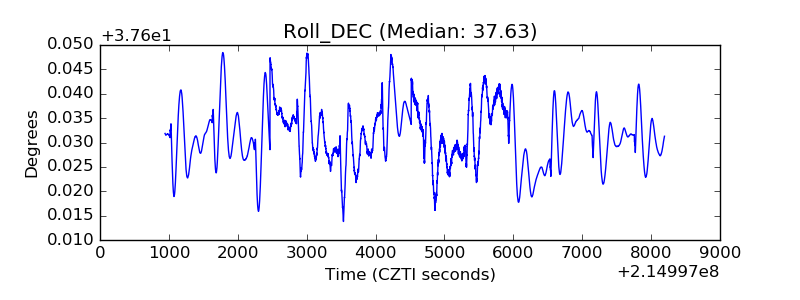 |
| _Roll_RA | 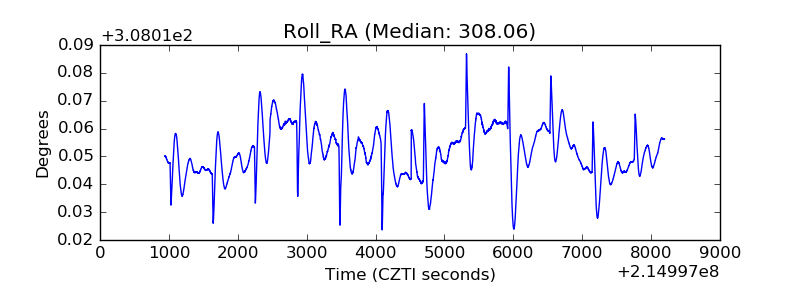 |
| Veto Counter | 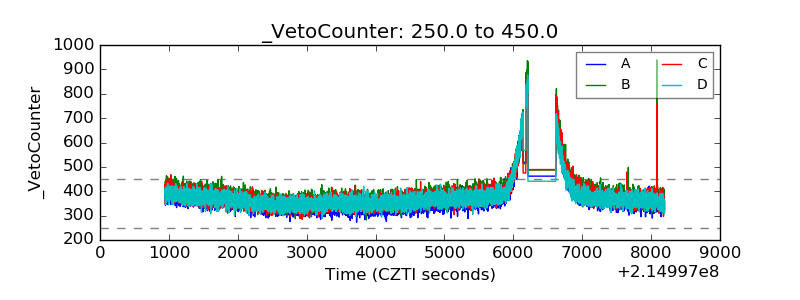 |