| Param | Original file | Final file |
|---|---|---|
| Filename | modeM0/AS1G06_089T01_9000000746_05809cztM0_level2.evt | modeM0/AS1G06_089T01_9000000746_05809cztM0_level2_quad_clean.evt |
| Size (bytes) | 548,786,880 | 97,032,960 |
| Size | 523.4 MB | 92.5 MB |
| Events in quadrant A | 4,971,096 | 596,676 |
| Events in quadrant B | 3,894,602 | 614,361 |
| Events in quadrant C | 3,604,910 | 600,644 |
| Events in quadrant D | 3,611,346 | 575,720 |
| Mode M9 | |||
|---|---|---|---|
| Quadrant | BADHDUFLAG | Total packets | Discarded packets |
| A | 0 | 1 | 0 |
| B | 0 | 1 | 0 |
| C | 0 | 1 | 0 |
| D | 0 | 1 | 0 |
| Mode M0 | |||
|---|---|---|---|
| Quadrant | BADHDUFLAG | Total packets | Discarded packets |
| A | 0 | 20125 | 15 |
| B | 0 | 16758 | 18 |
| C | 0 | 16464 | 5 |
| D | 0 | 16629 | 7 |
| Mode SS | |||
|---|---|---|---|
| Quadrant | BADHDUFLAG | Total packets | Discarded packets |
| A | 0 | 158 | 0 |
| B | 0 | 158 | 0 |
| C | 0 | 158 | 0 |
| D | 0 | 158 | 0 |
| Quadrant | Total seconds | Saturated seconds | Saturation percentage |
|---|---|---|---|
| A | 7936 | 277 | 3.490423% |
| B | 7933 | 112 | 1.411824% |
| C | 7939 | 52 | 0.654994% |
| D | 7937 | 59 | 0.743354% |
Noise dominated data is calculated using 1-second bins in cleaned event files. If a bin has >2000 counts, and if more than 50% of those come from <1% of pixels, then it is considered to be noise-dominated and hence unusable.
| Quadrant | # 1 sec bins | Bins with >0 counts | Bins with >2000 counts | High rate bins dominated by noise | Noise dominated (total time) | Noise dominated (detector-on time) | Marked lightcurve |
|---|---|---|---|---|---|---|---|
| A | 7975 | 7941 | 15 | 15 | 0.19% | 0.19% | 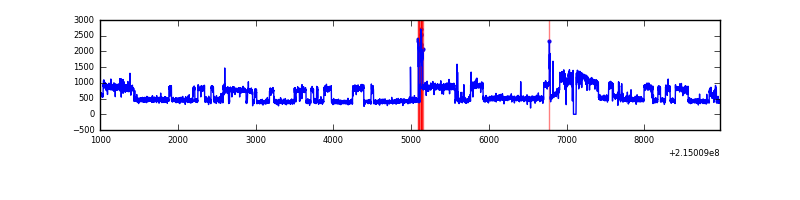 |
| B | 7975 | 7941 | 6 | 6 | 0.08% | 0.08% | 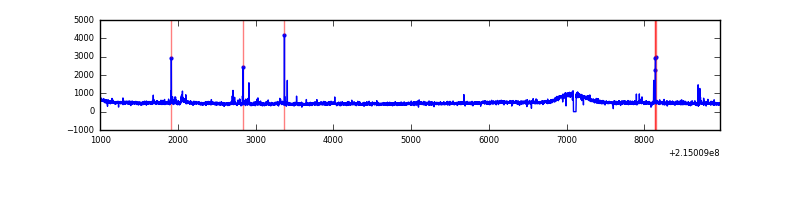 |
| C | 7975 | 7941 | 0 | 0 | 0.00% | 0.00% | 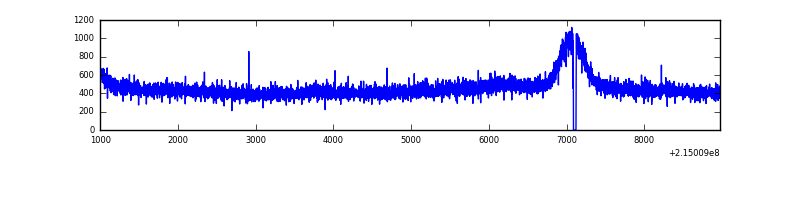 |
| D | 7975 | 7941 | 3 | 3 | 0.04% | 0.04% | 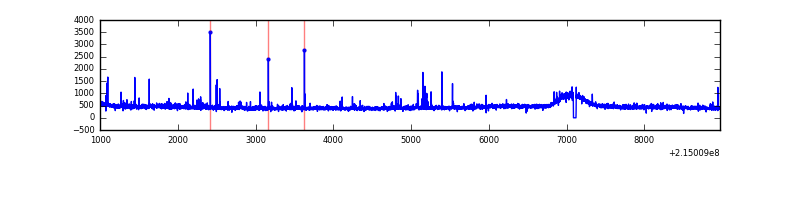 |
Top three noisy pixels from each quadrant. If the there are fewer than three noisy pixels in the level2.evt file, extra rows are filled as -1
| Pixel properties | Quadrant properties | ||||||
|---|---|---|---|---|---|---|---|
| Quadrant | DetID | PixID | Counts | Sigma | Mean | Median | Sigma |
| A | 15 | 236 | 1235844 | 6344.58 | 941 | 920 | 194.6 |
| A | 15 | 174 | 75125 | 381.24 | 941 | 920 | 194.6 |
| A | 15 | 223 | 28401 | 141.19 | 941 | 920 | 194.6 |
| B | 0 | 219 | 89385 | 473.04 | 954 | 929 | 187.0 |
| B | 4 | 81 | 35891 | 186.97 | 954 | 929 | 187.0 |
| B | 4 | 48 | 30429 | 157.76 | 954 | 929 | 187.0 |
| C | 13 | 61 | 7386 | 29.9 | 920 | 923 | 216.1 |
| C | 8 | 128 | 4984 | 18.79 | 920 | 923 | 216.1 |
| C | 8 | 222 | 4809 | 17.98 | 920 | 923 | 216.1 |
| D | 4 | 95 | 44362 | 189.66 | 925 | 897 | 229.2 |
| D | 13 | 238 | 38758 | 165.2 | 925 | 897 | 229.2 |
| D | 8 | 195 | 12794 | 51.91 | 925 | 897 | 229.2 |
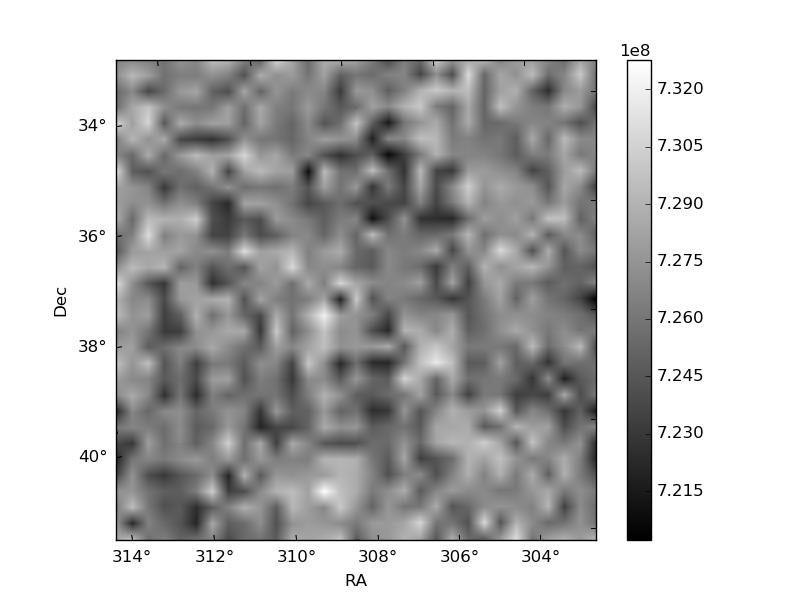
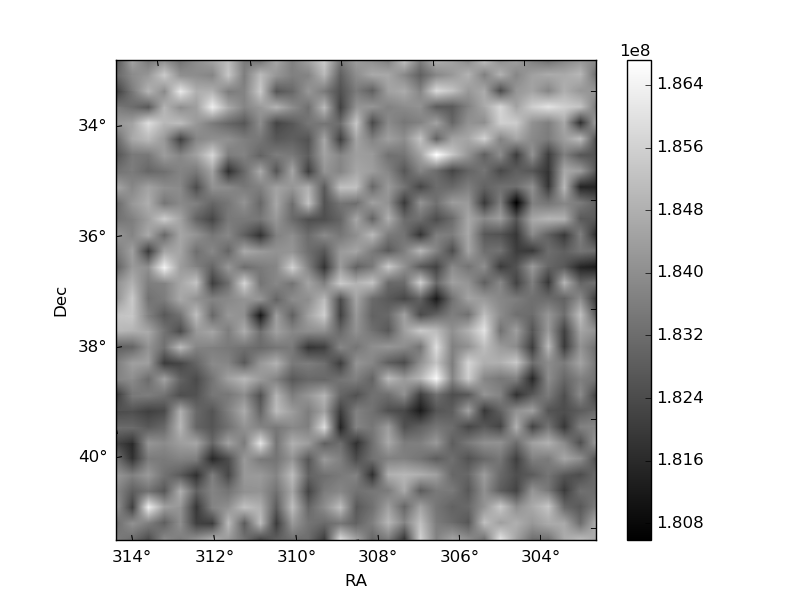
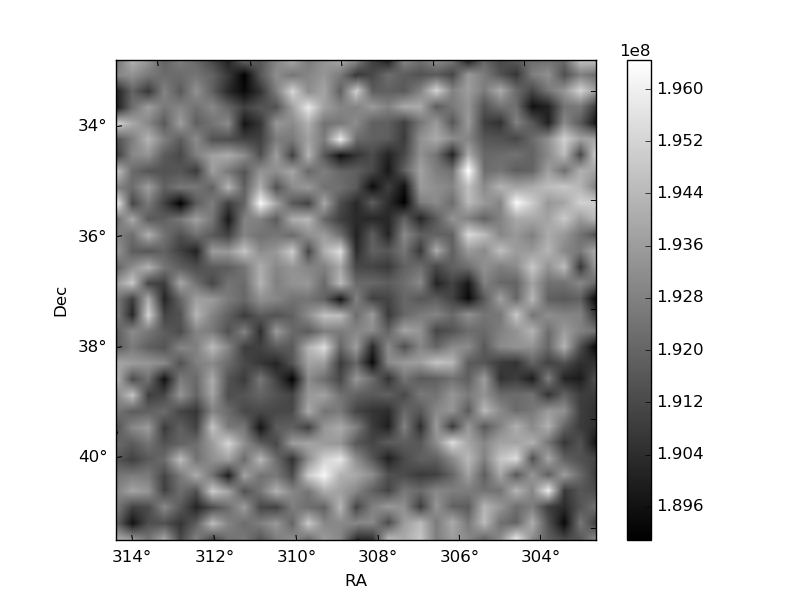
Histogram calculated using DETX and DETY for each event in the final _common_clean file
| Quadrant A | 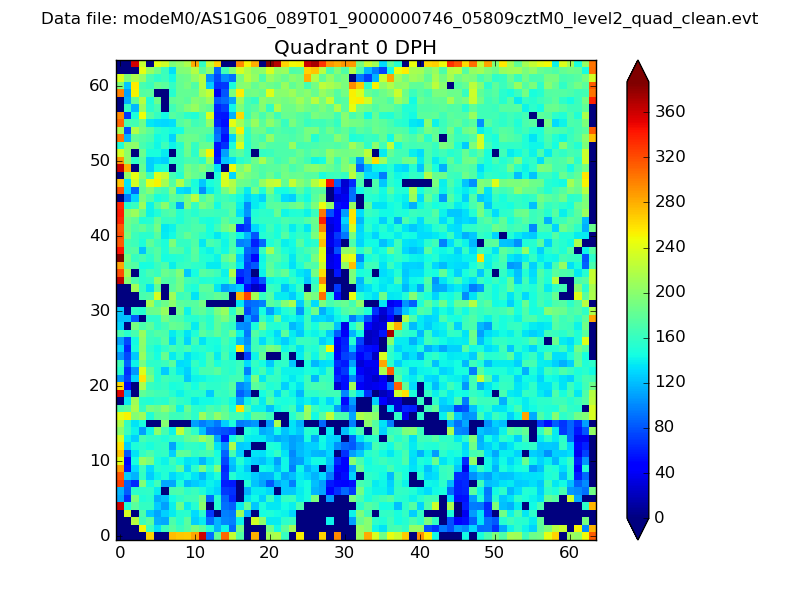 |
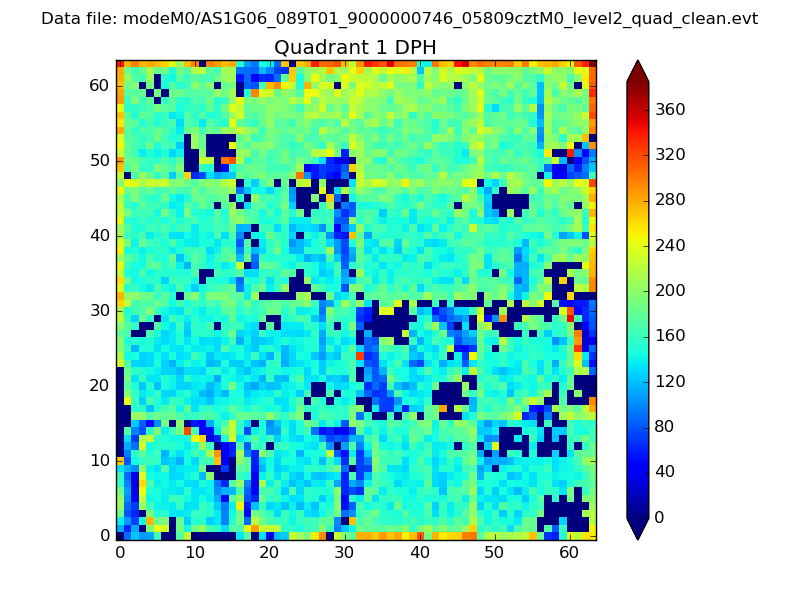 |
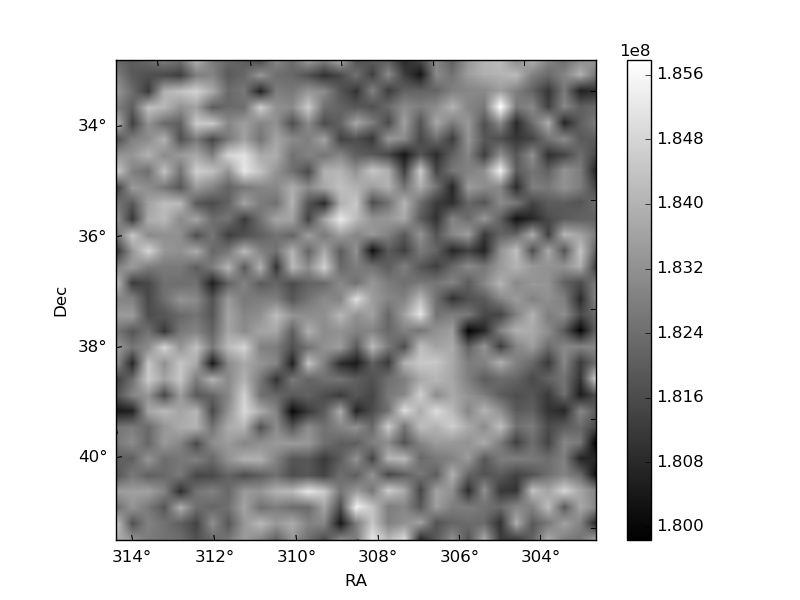
Quadrant B |
|---|---|---|---|
| Quadrant D | 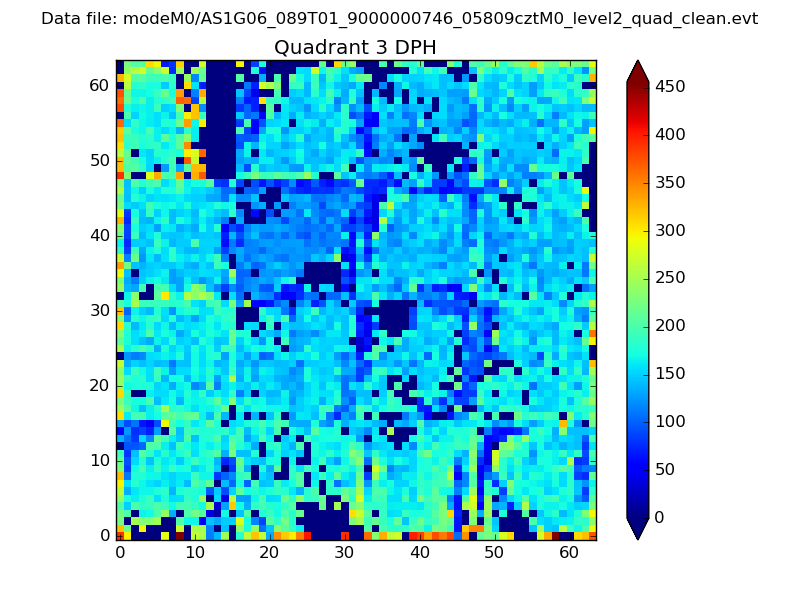 |
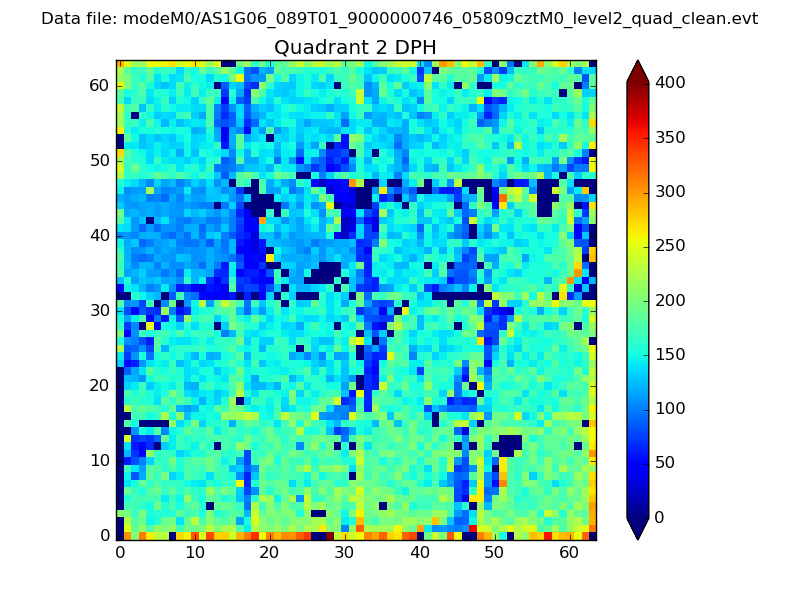 |
Quadrant C |
| Plot type | Count rate plots | Images |
|---|---|---|
| Comparison with Poisson distribution Blue bars denote a histogram of data divided into 1 sec bins. Red curve is a Poisson curve with rate = median count rate of data. |
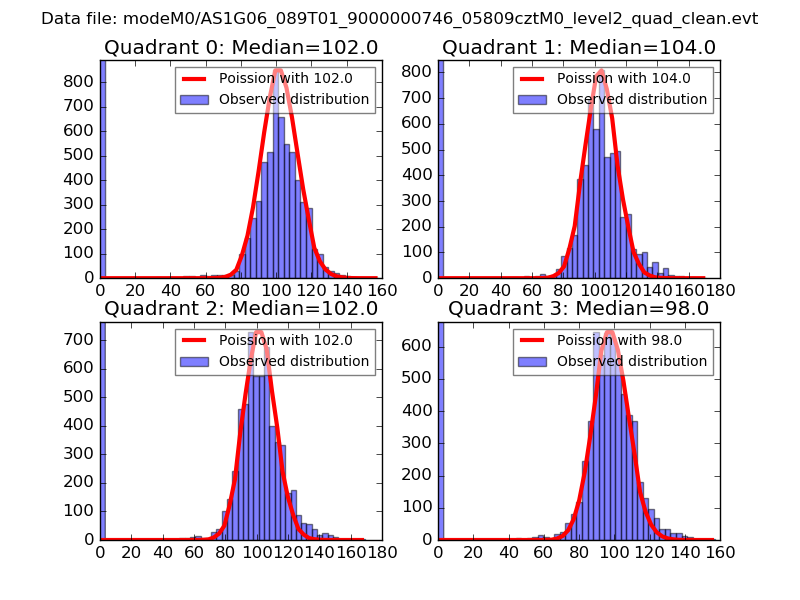 |
 |
| Quadrant-wise count rates Data is divided into 100 sec bins |
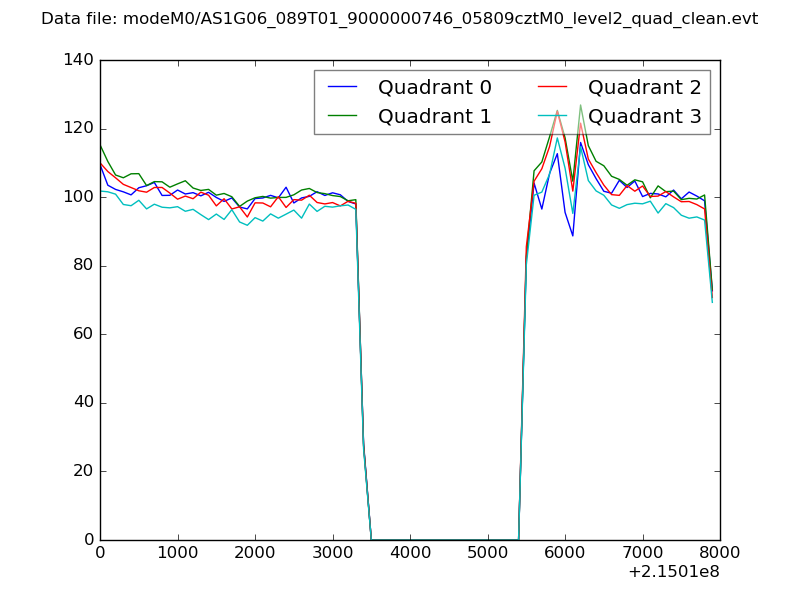 |
|
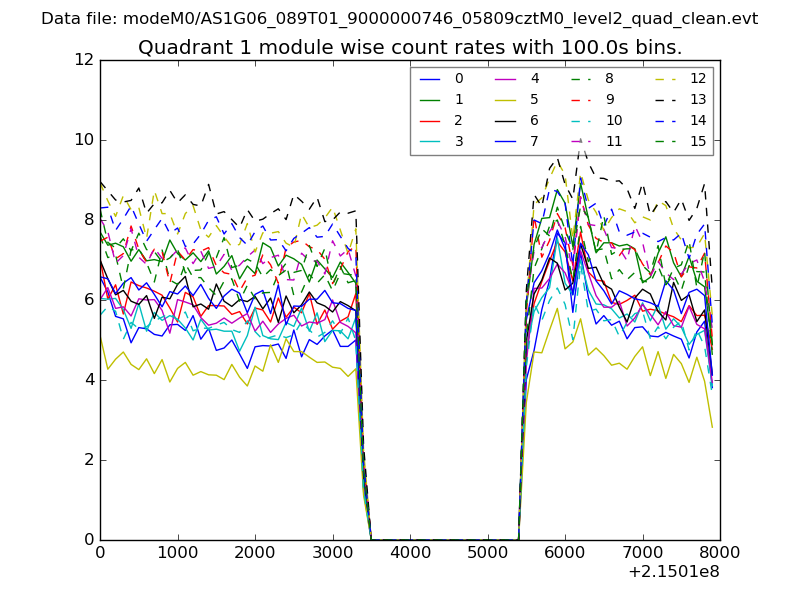
| Module-wise count rates for Quadrant A Data is divided into 100 sec bins |
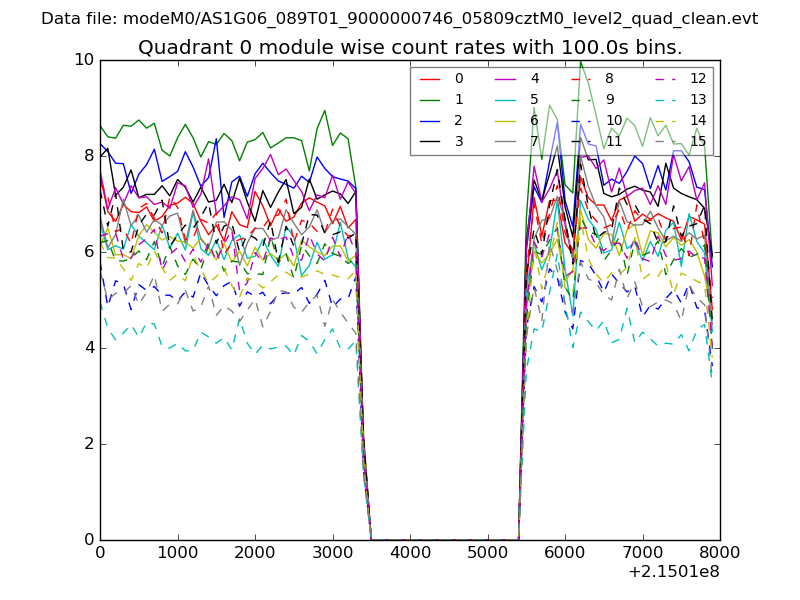 |
 |
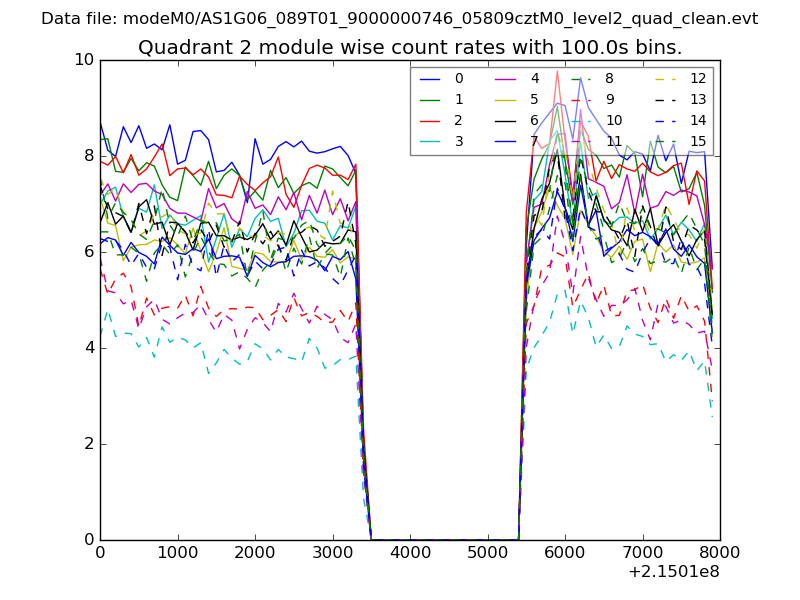
| Module-wise count rates for Quadrant B Data is divided into 100 sec bins |
 |
 |
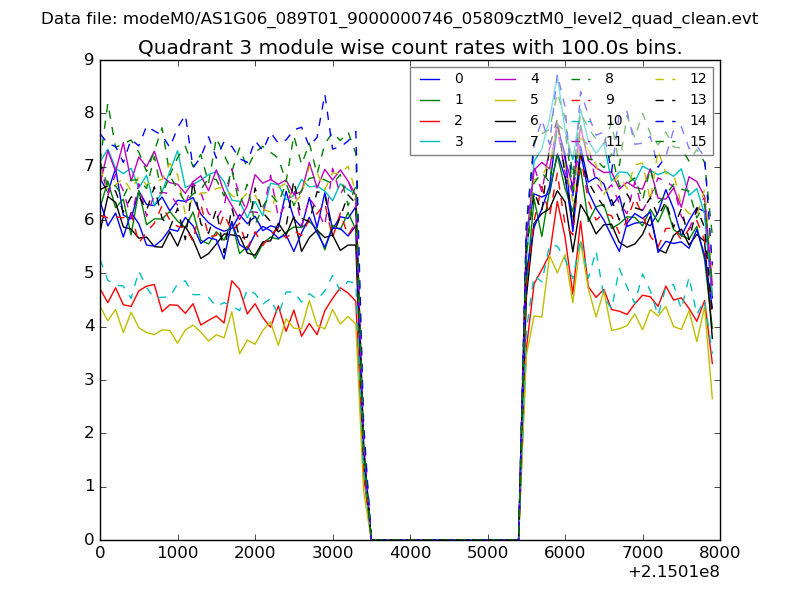
| Module-wise count rates for Quadrant C Data is divided into 100 sec bins |
 |
 |
| Module-wise count rates for Quadrant D Data is divided into 100 sec bins |
 |
 |
| Parameter | Plot |
|---|---|
| CZT HV Monitor | 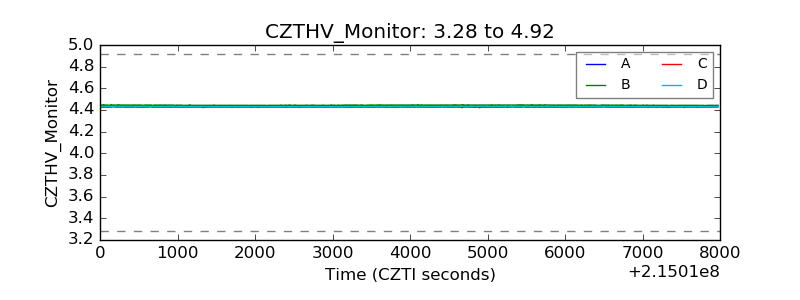 |
| D_VDD | 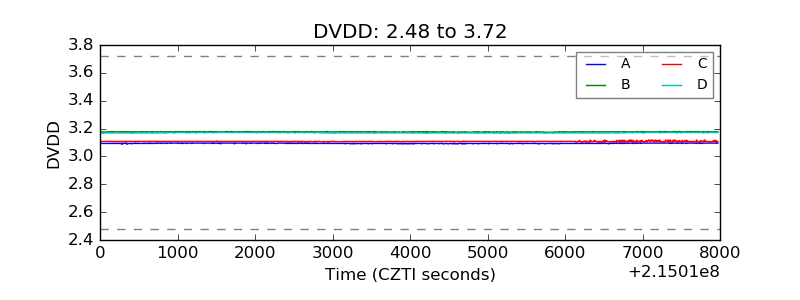 |
| Temperature 1 | 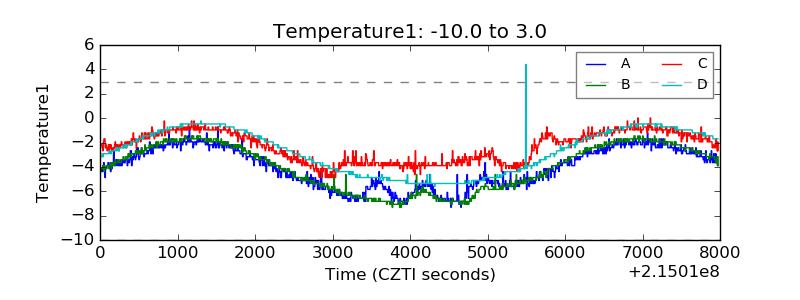 |
| Veto HV Monitor | 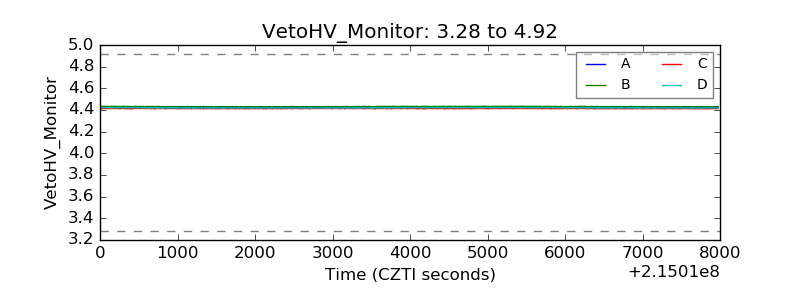 |
| Veto LLD | 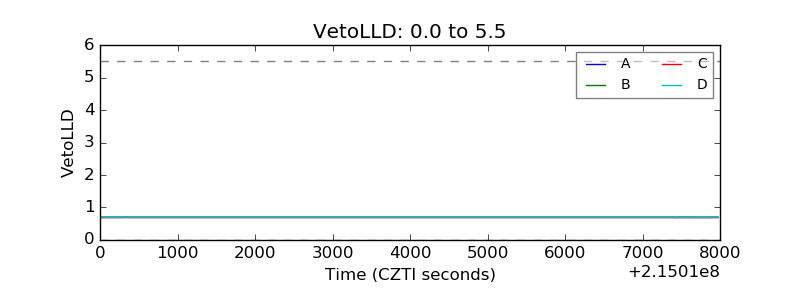 |
| Alpha Counter | 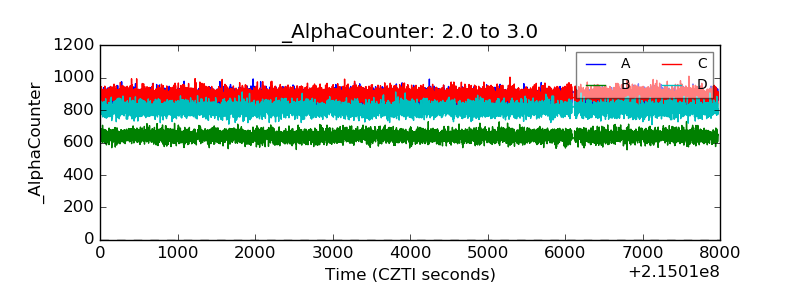 |
| _CPM_Rate | 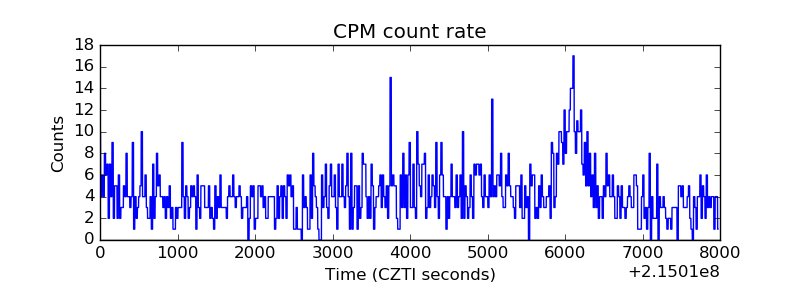 |
| CZT Counter |  |
| +2.5 Volts monitor |  |
| +5 Volts monitor |  |
| _ROLL_ROT | 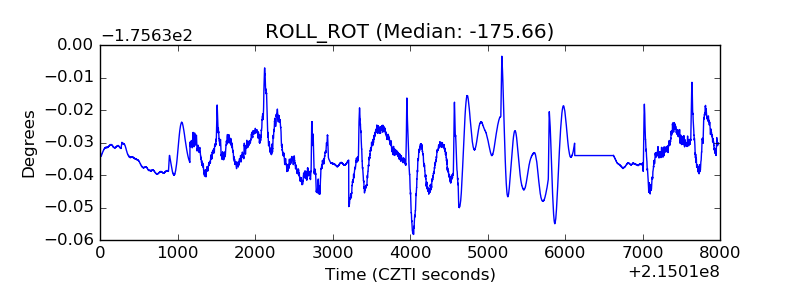 |
| _Roll_DEC | 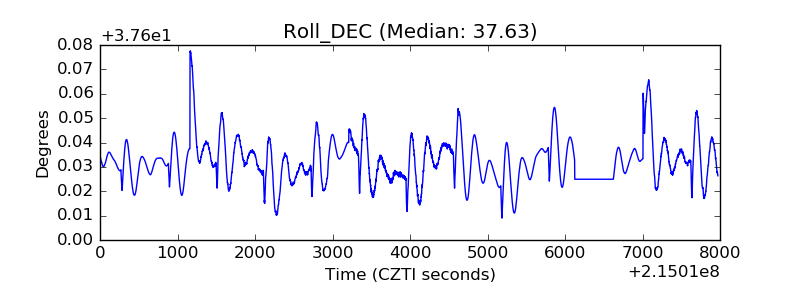 |
| _Roll_RA | 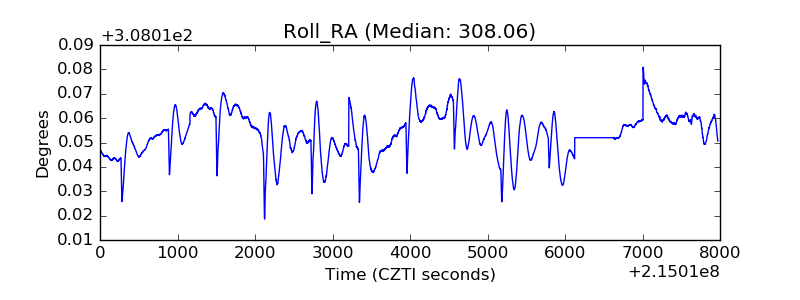 |
| Veto Counter | 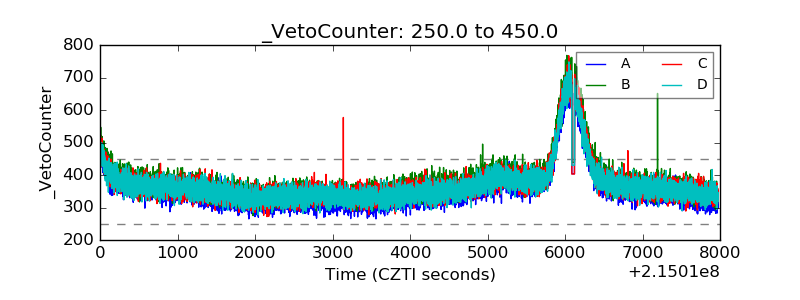 |