| Param | Original file | Final file |
|---|---|---|
| Filename | modeM0/AS1G06_089T01_9000000746_05812cztM0_level2.evt | modeM0/AS1G06_089T01_9000000746_05812cztM0_level2_quad_clean.evt |
| Size (bytes) | 924,134,400 | 138,553,920 |
| Size | 881.3 MB | 132.1 MB |
| Events in quadrant A | 6,854,074 | 847,944 |
| Events in quadrant B | 5,871,267 | 862,288 |
| Events in quadrant C | 5,460,856 | 847,987 |
| Events in quadrant D | 8,959,794 | 777,495 |
| Mode M9 | |||
|---|---|---|---|
| Quadrant | BADHDUFLAG | Total packets | Discarded packets |
| A | 0 | 9 | 0 |
| B | 0 | 9 | 0 |
| C | 0 | 9 | 0 |
| D | 0 | 9 | 0 |
| Mode M0 | |||
|---|---|---|---|
| Quadrant | BADHDUFLAG | Total packets | Discarded packets |
| A | 0 | 29399 | 36 |
| B | 0 | 25846 | 12 |
| C | 0 | 25344 | 27 |
| D | 0 | 35932 | 90 |
| Mode SS | |||
|---|---|---|---|
| Quadrant | BADHDUFLAG | Total packets | Discarded packets |
| A | 0 | 252 | 0 |
| B | 0 | 252 | 0 |
| C | 0 | 252 | 0 |
| D | 0 | 252 | 0 |
| Quadrant | Total seconds | Saturated seconds | Saturation percentage |
|---|---|---|---|
| A | 12441 | 166 | 1.334298% |
| B | 12448 | 106 | 0.851542% |
| C | 12441 | 38 | 0.305442% |
| D | 12432 | 832 | 6.692407% |
Noise dominated data is calculated using 1-second bins in cleaned event files. If a bin has >2000 counts, and if more than 50% of those come from <1% of pixels, then it is considered to be noise-dominated and hence unusable.
| Quadrant | # 1 sec bins | Bins with >0 counts | Bins with >2000 counts | High rate bins dominated by noise | Noise dominated (total time) | Noise dominated (detector-on time) | Marked lightcurve |
|---|---|---|---|---|---|---|---|
| A | 13344 | 12456 | 54 | 54 | 0.40% | 0.43% |  |
| B | 13344 | 12456 | 11 | 11 | 0.08% | 0.09% | 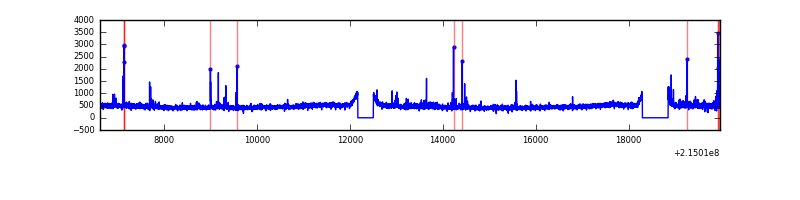 |
| C | 13344 | 12455 | 0 | 0 | 0.00% | 0.00% | 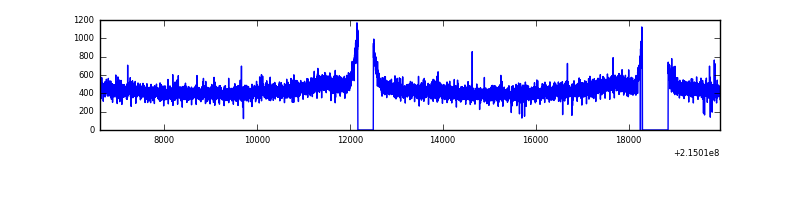 |
| D | 13344 | 12455 | 587 | 587 | 4.40% | 4.71% | 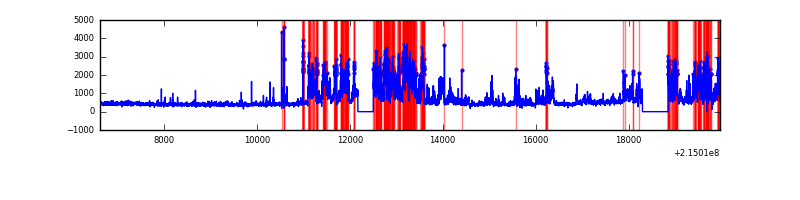 |
Top three noisy pixels from each quadrant. If the there are fewer than three noisy pixels in the level2.evt file, extra rows are filled as -1
| Pixel properties | Quadrant properties | ||||||
|---|---|---|---|---|---|---|---|
| Quadrant | DetID | PixID | Counts | Sigma | Mean | Median | Sigma |
| A | 15 | 236 | 1089401 | 3726.4 | 1426 | 1391 | 292.0 |
| A | 0 | 50 | 166220 | 564.53 | 1426 | 1391 | 292.0 |
| A | 15 | 79 | 61679 | 206.48 | 1426 | 1391 | 292.0 |
| B | 10 | 16 | 83891 | 296.13 | 1445 | 1407 | 278.5 |
| B | 15 | 204 | 49018 | 170.93 | 1445 | 1407 | 278.5 |
| B | 4 | 48 | 43626 | 151.57 | 1445 | 1407 | 278.5 |
| C | 13 | 61 | 11115 | 29.89 | 1394 | 1398 | 325.1 |
| C | 14 | 67 | 9676 | 25.46 | 1394 | 1398 | 325.1 |
| C | 8 | 222 | 5911 | 13.88 | 1394 | 1398 | 325.1 |
| D | 8 | 230 | 3440594 | 10267.19 | 1363 | 1320 | 335.0 |
| D | 1 | 239 | 148660 | 439.85 | 1363 | 1320 | 335.0 |
| D | 2 | 209 | 53138 | 154.69 | 1363 | 1320 | 335.0 |
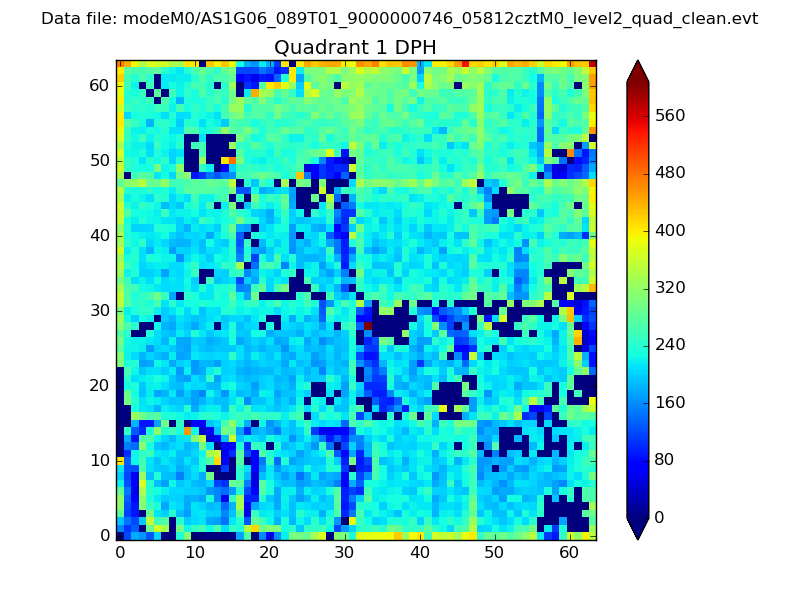
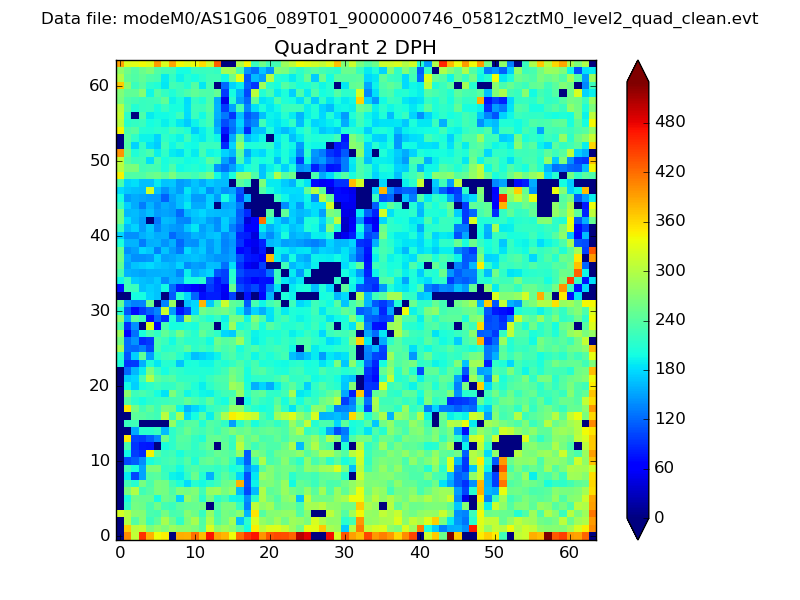
Histogram calculated using DETX and DETY for each event in the final _common_clean file
| Quadrant A | 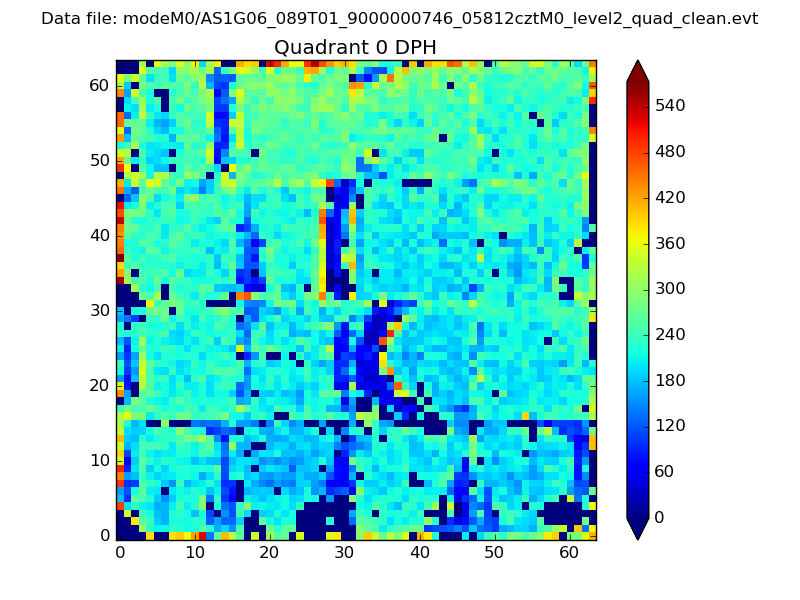 |
 |
Quadrant B |
|---|---|---|---|
| Quadrant D | 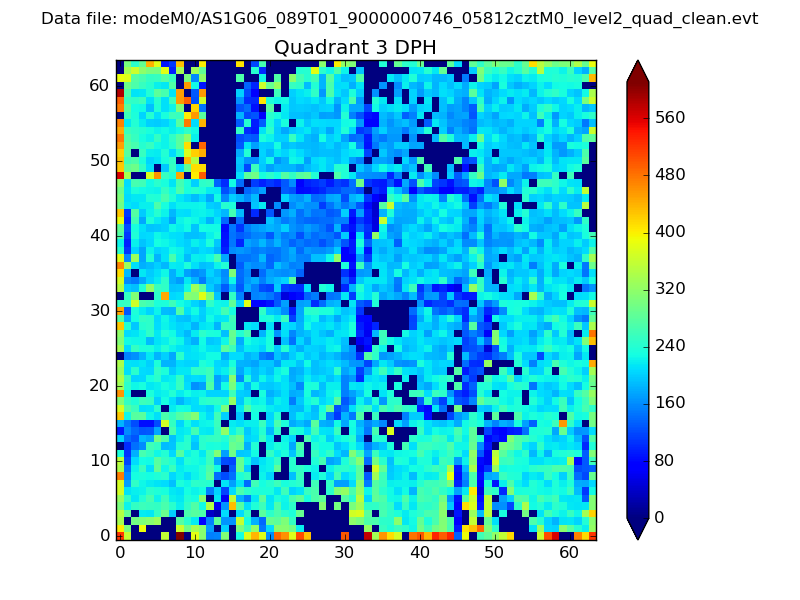 |
 |
Quadrant C |
| Plot type | Count rate plots | Images |
|---|---|---|
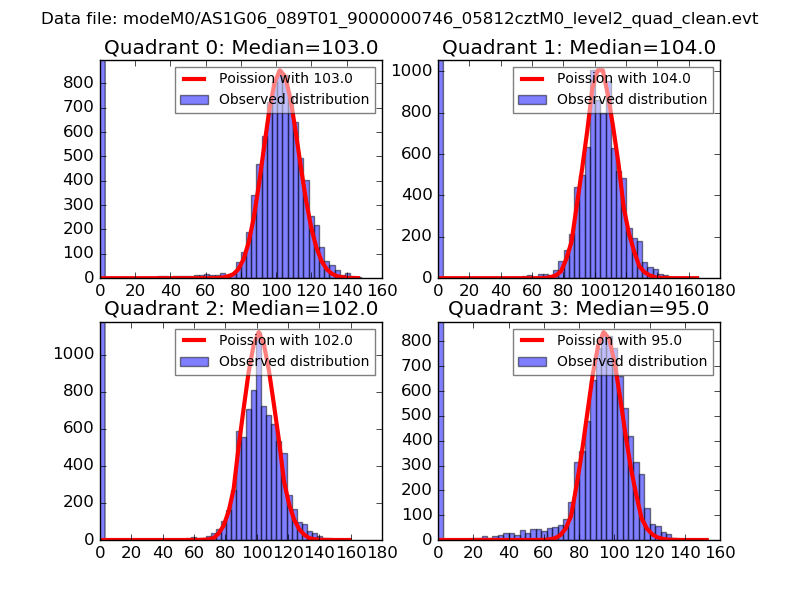
| Comparison with Poisson distribution Blue bars denote a histogram of data divided into 1 sec bins. Red curve is a Poisson curve with rate = median count rate of data. |
 |
 |
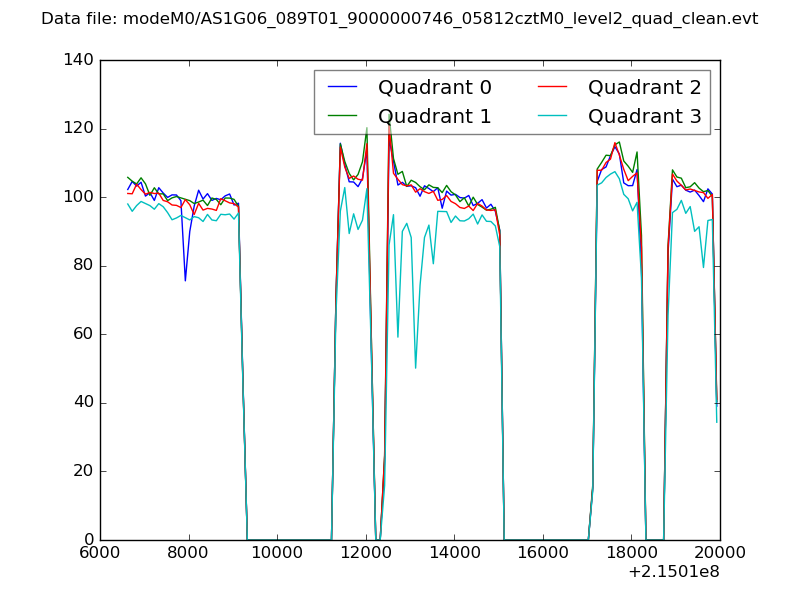
| Quadrant-wise count rates Data is divided into 100 sec bins |
 |
|
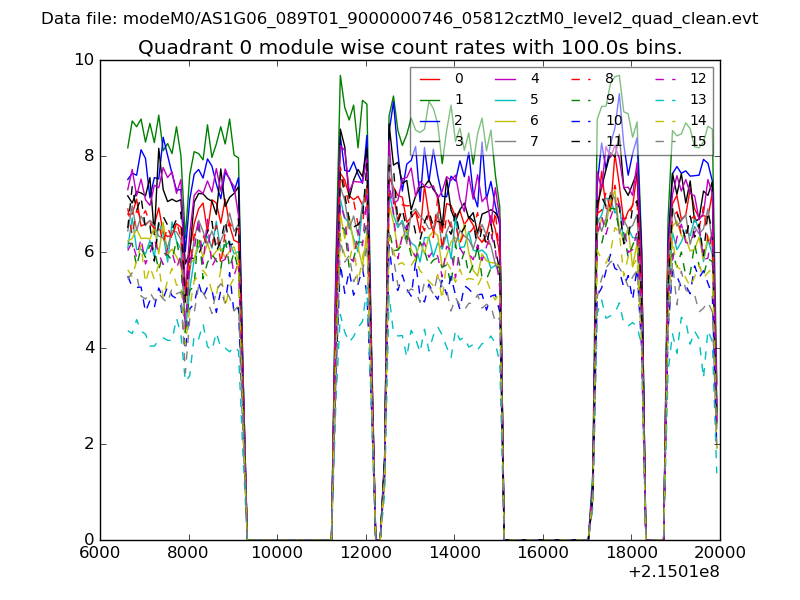
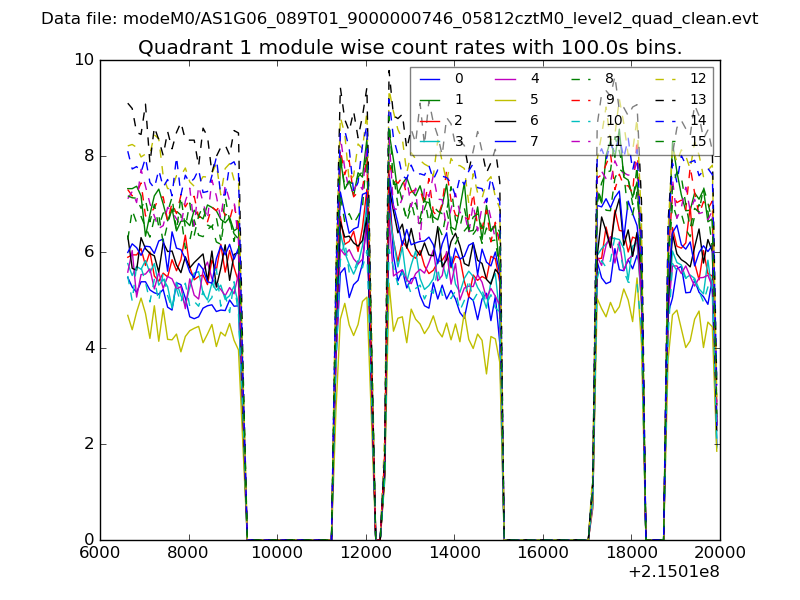
| Module-wise count rates for Quadrant A Data is divided into 100 sec bins |
 |
 |
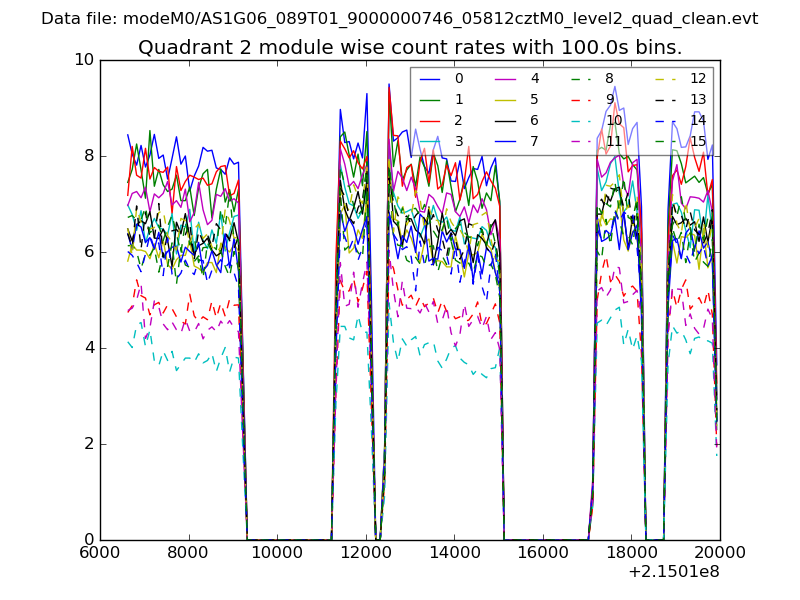
| Module-wise count rates for Quadrant B Data is divided into 100 sec bins |
 |
 |
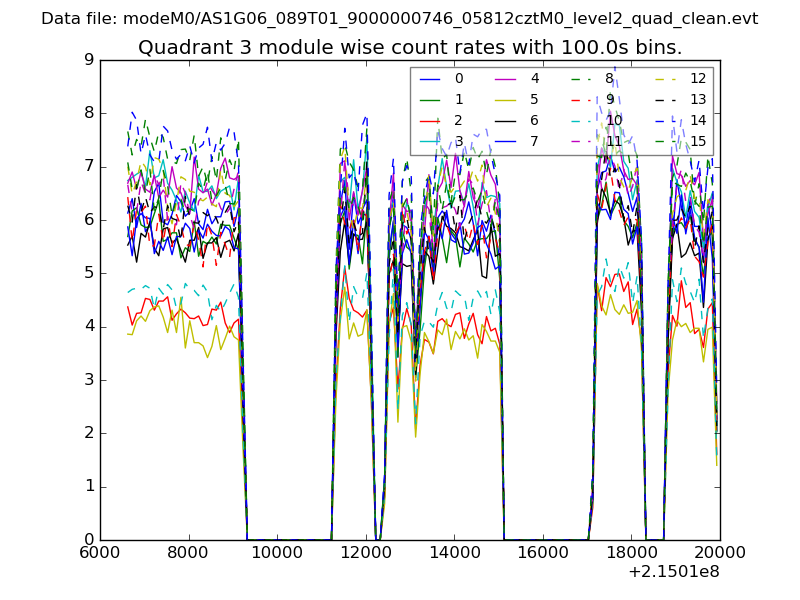
| Module-wise count rates for Quadrant C Data is divided into 100 sec bins |
 |
 |
| Module-wise count rates for Quadrant D Data is divided into 100 sec bins |
 |
 |
| Parameter | Plot |
|---|---|
| CZT HV Monitor | 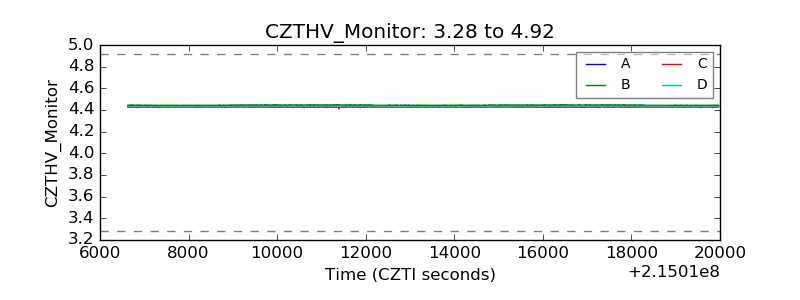 |
| D_VDD | 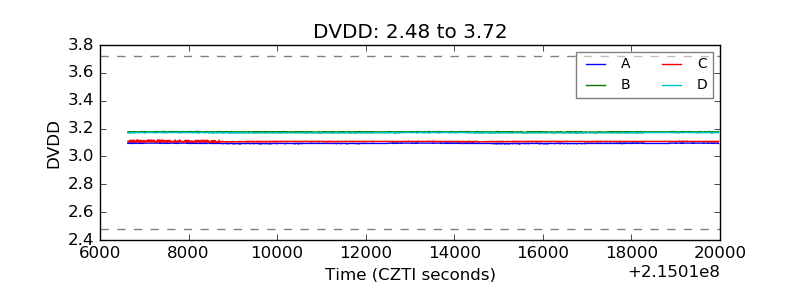 |
| Temperature 1 | 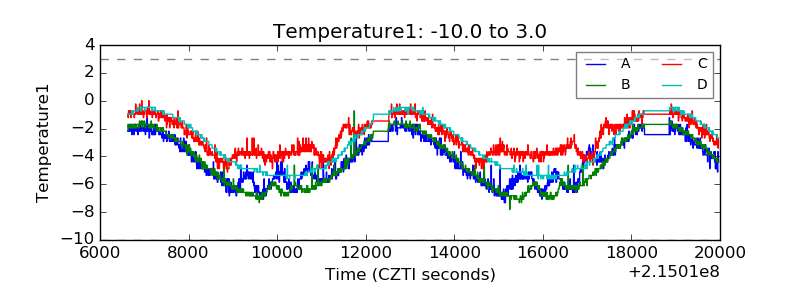 |
| Veto HV Monitor | 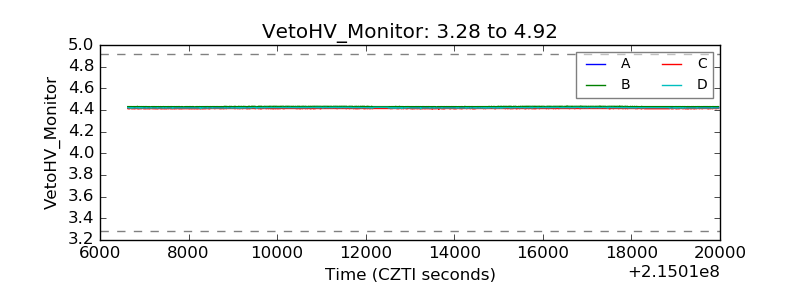 |
| Veto LLD | 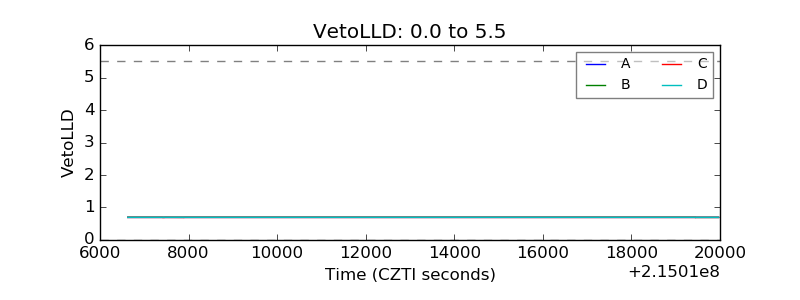 |
| Alpha Counter | 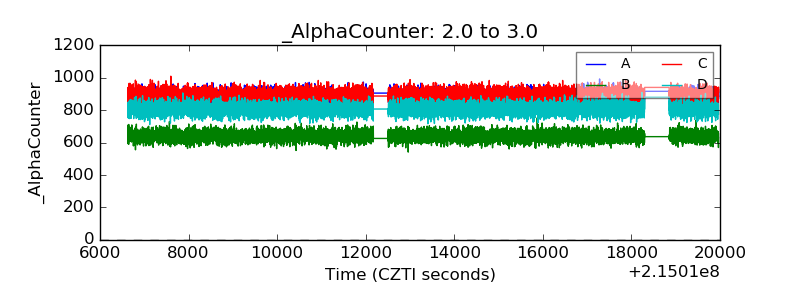 |
| _CPM_Rate | 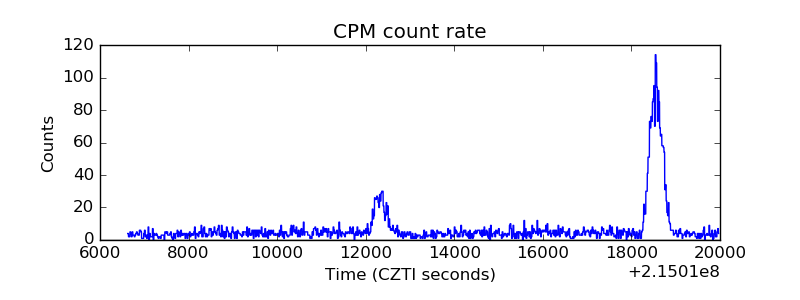 |
| CZT Counter | 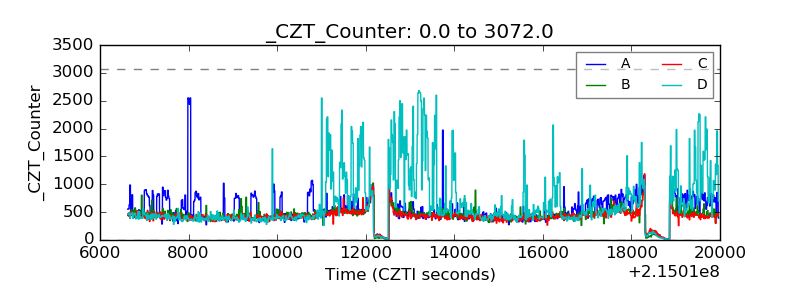 |
| +2.5 Volts monitor |  |
| +5 Volts monitor |  |
| _ROLL_ROT | 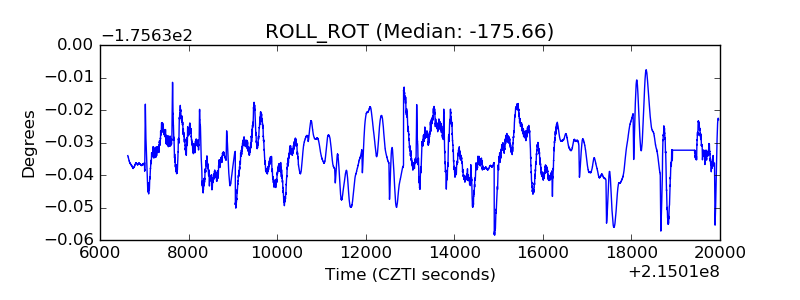 |
| _Roll_DEC | 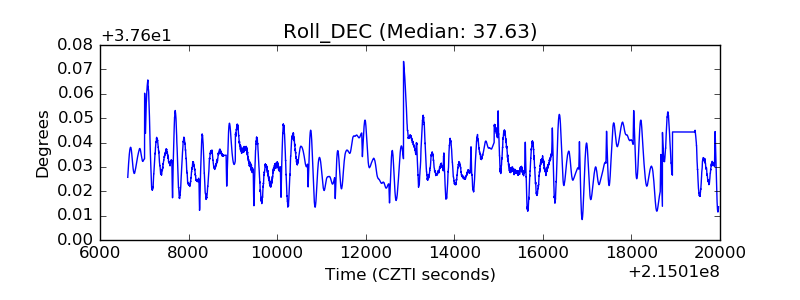 |
| _Roll_RA | 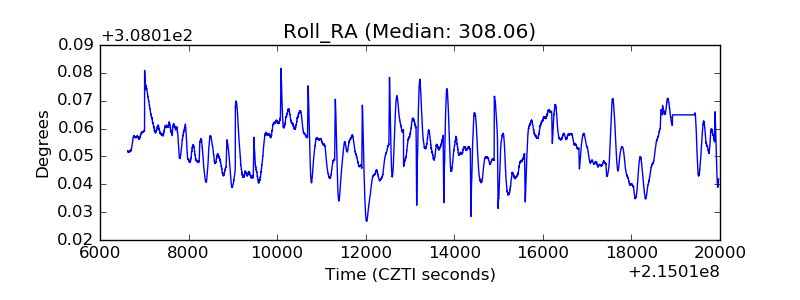 |
| Veto Counter | 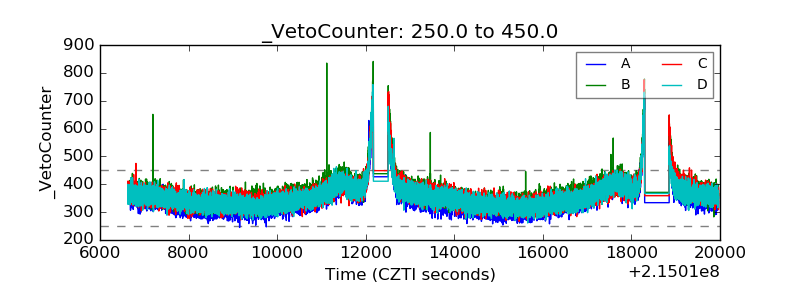 |