| Param | Original file | Final file |
|---|---|---|
| Filename | modeM0/AS1A02_197T01_9000000748cztM0_level2.fits | modeM0/AS1A02_197T01_9000000748cztM0_level2_quad_clean.evt |
| Size (bytes) | 136,488,960 | 110,082,240 |
| Size | 130.2 MB | 105.0 MB |
| Events in quadrant A | 798,912 | 582,658 |
| Events in quadrant B | 790,856 | 596,341 |
| Events in quadrant C | 800,274 | 572,796 |
| Events in quadrant D | 690,008 | 527,179 |
| Mode M0 | |||
|---|---|---|---|
| Quadrant | BADHDUFLAG | Total packets | Discarded packets |
| A | 0 | 37303 | 0 |
| B | 0 | 31207 | 0 |
| C | 0 | 31221 | 0 |
| D | 0 | 32166 | 0 |
| Mode SS | |||
|---|---|---|---|
| Quadrant | BADHDUFLAG | Total packets | Discarded packets |
| A | 0 | 312 | 0 |
| B | 0 | 312 | 0 |
| C | 0 | 312 | 0 |
| D | 0 | 312 | 0 |
| Mode M9 | |||
|---|---|---|---|
| Quadrant | BADHDUFLAG | Total packets | Discarded packets |
| A | 0 | 27 | 0 |
| B | 0 | 27 | 0 |
| C | 0 | 27 | 0 |
| D | 0 | 27 | 0 |
| Quadrant | Total seconds | Saturated seconds | Saturation percentage |
|---|---|---|---|
| A | 15268 | 116 | 0.759759% |
| B | 15265 | 63 | 0.412709% |
| C | 15266 | 71 | 0.465086% |
| D | 15270 | 69 | 0.451866% |
Noise dominated data is calculated using 1-second bins in cleaned event files. If a bin has >2000 counts, and if more than 50% of those come from <1% of pixels, then it is considered to be noise-dominated and hence unusable.
| Quadrant | # 1 sec bins | Bins with >0 counts | Bins with >2000 counts | High rate bins dominated by noise | Noise dominated (total time) | Noise dominated (detector-on time) | Marked lightcurve |
|---|---|---|---|---|---|---|---|
| A | 18031 | 15271 | 0 | 0 | 0.00% | 0.00% |  |
| B | 18031 | 15271 | 0 | 0 | 0.00% | 0.00% |  |
| C | 18031 | 15271 | 0 | 0 | 0.00% | 0.00% | 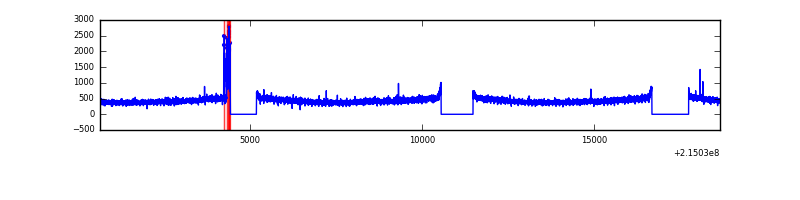 |
| D | 18031 | 15271 | 0 | 0 | 0.00% | 0.00% | 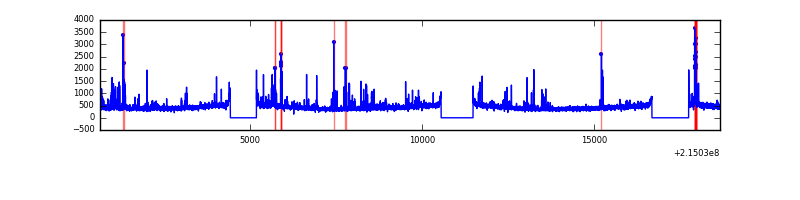 |
Top three noisy pixels from each quadrant. If the there are fewer than three noisy pixels in the level2.evt file, extra rows are filled as -1
| Pixel properties | Quadrant properties | ||||||
|---|---|---|---|---|---|---|---|
| Quadrant | DetID | PixID | Counts | Sigma | Mean | Median | Sigma |
| A | 0 | 29 | 803 | 11.01 | 207 | 194 | 55.3 |
| A | 14 | 188 | 757 | 10.18 | 207 | 194 | 55.3 |
| A | 14 | 204 | 730 | 9.69 | 207 | 194 | 55.3 |
| B | 2 | 9 | 665 | 10.45 | 208 | 197 | 44.8 |
| B | 12 | 226 | 599 | 8.98 | 208 | 197 | 44.8 |
| B | 14 | 254 | 553 | 7.95 | 208 | 197 | 44.8 |
| C | 1 | 80 | 604 | 7.07 | 211 | 196 | 57.7 |
| C | 1 | 81 | 603 | 7.06 | 211 | 196 | 57.7 |
| C | 12 | 241 | 557 | 6.26 | 211 | 196 | 57.7 |
| D | 11 | 82 | 515 | 6.15 | 196 | 178 | 54.8 |
| D | 3 | 14 | 505 | 5.97 | 196 | 178 | 54.8 |
| D | 6 | 231 | 500 | 5.88 | 196 | 178 | 54.8 |
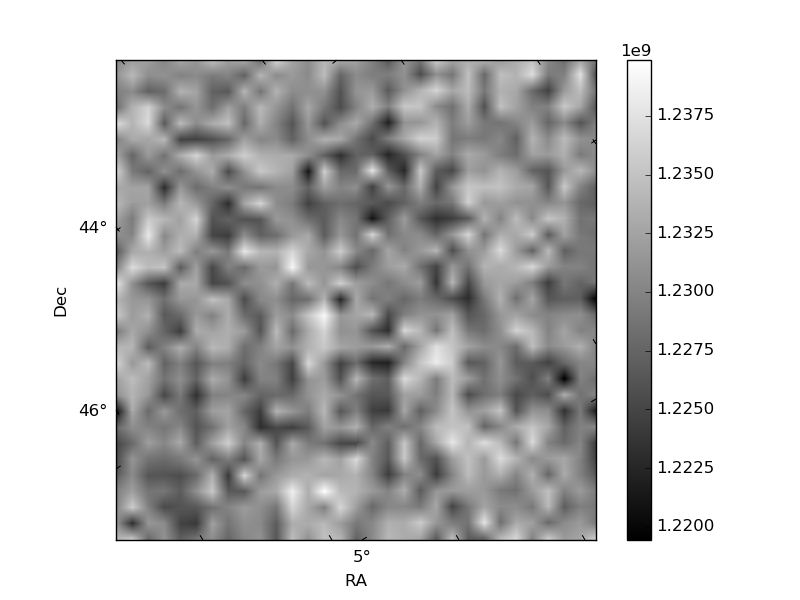
Histogram calculated using DETX and DETY for each event in the final _common_clean file
| Quadrant A | 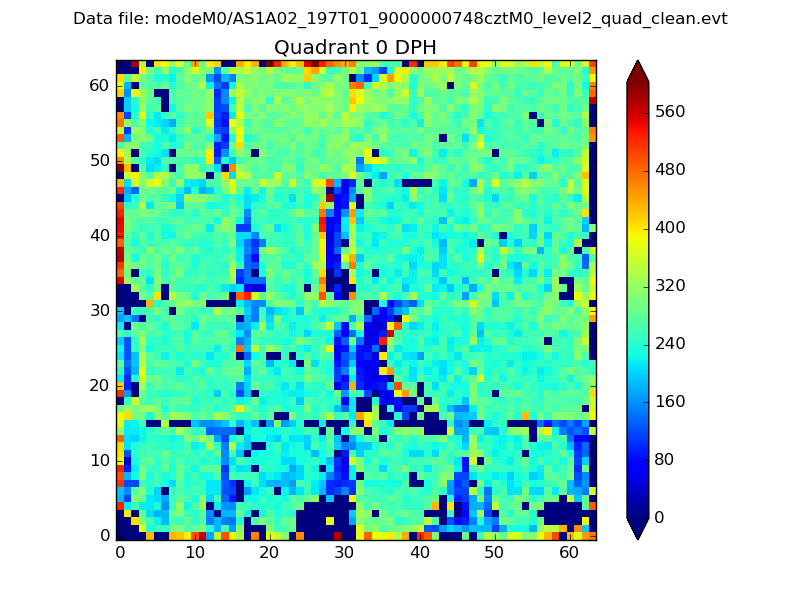 |
 |
Quadrant B |
|---|---|---|---|
| Quadrant D | 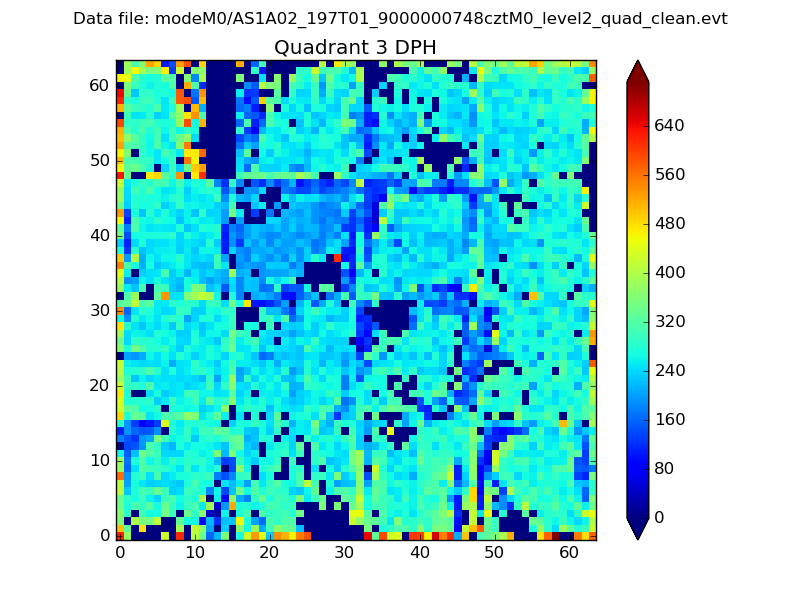 |
 |
Quadrant C |
| Plot type | Count rate plots | Images |
|---|---|---|
| Comparison with Poisson distribution Blue bars denote a histogram of data divided into 1 sec bins. Red curve is a Poisson curve with rate = median count rate of data. |
 |
 |
| Quadrant-wise count rates Data is divided into 100 sec bins |
 |
|
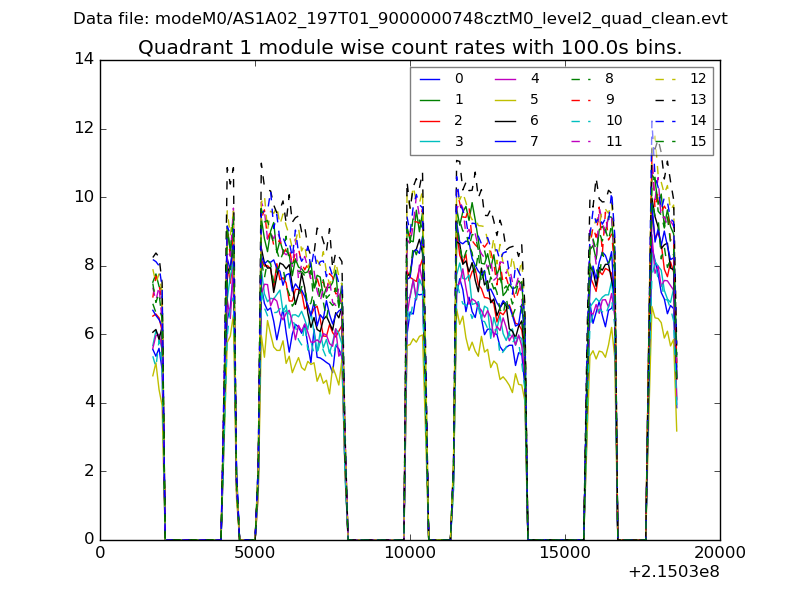
| Module-wise count rates for Quadrant A Data is divided into 100 sec bins |
 |
 |
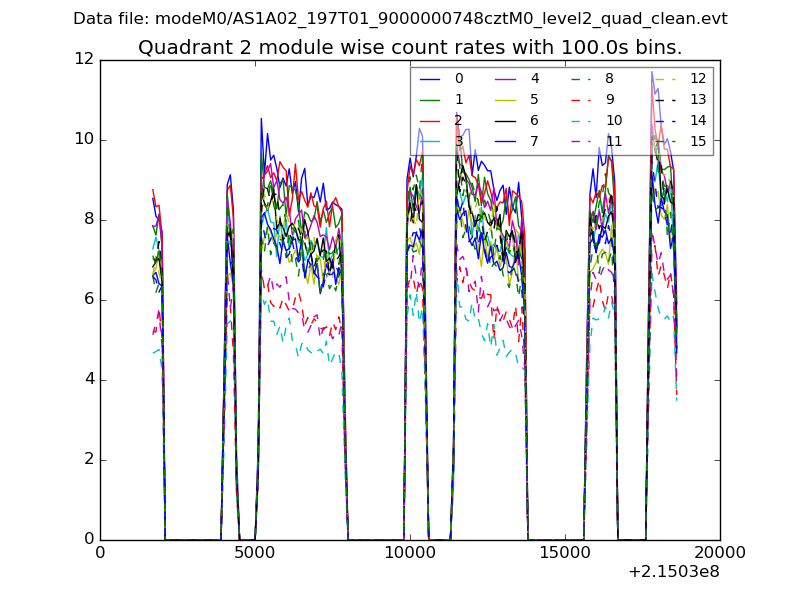
| Module-wise count rates for Quadrant B Data is divided into 100 sec bins |
 |
 |
| Module-wise count rates for Quadrant C Data is divided into 100 sec bins |
 |
 |
| Module-wise count rates for Quadrant D Data is divided into 100 sec bins |
 |
 |
| Parameter | Plot |
|---|---|
| CZT HV Monitor | 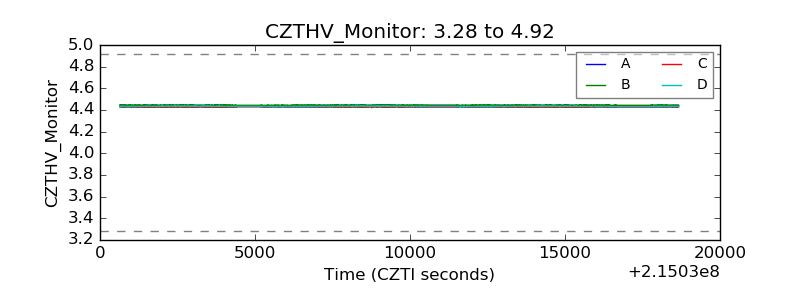 |
| D_VDD | 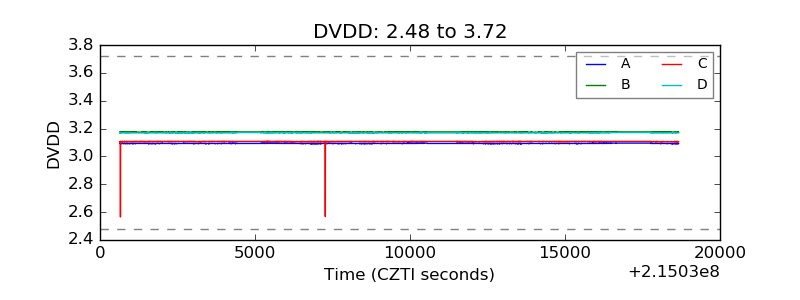 |
| Temperature 1 |  |
| Veto HV Monitor |  |
| Veto LLD |  |
| Alpha Counter |  |
| _CPM_Rate |  |
| CZT Counter | 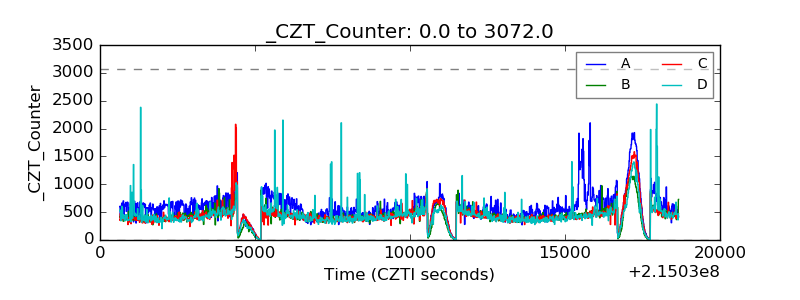 |
| +2.5 Volts monitor |  |
| +5 Volts monitor |  |
| _ROLL_ROT | 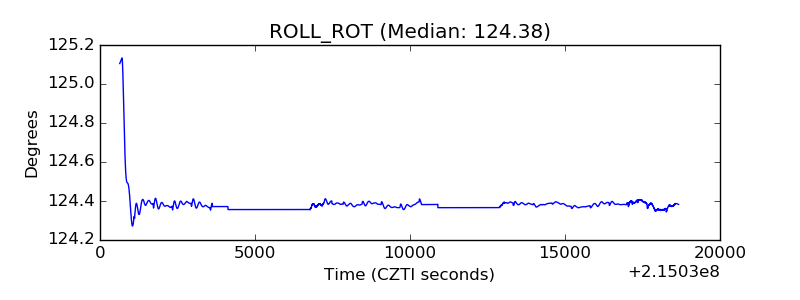 |
| _Roll_DEC |  |
| _Roll_RA |  |
| Veto Counter | 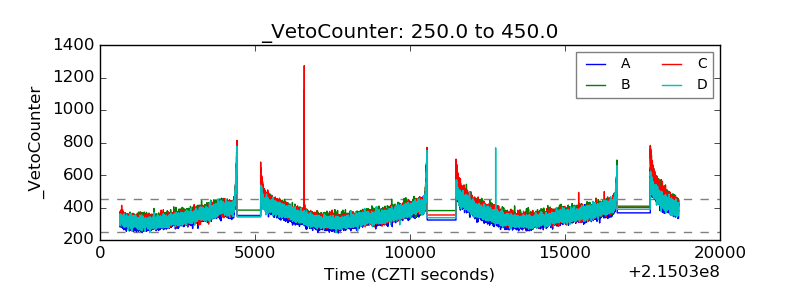 |