| Param | Original file | Final file |
|---|---|---|
| Filename | modeM0/AS1A02_197T01_9000000748_05812cztM0_level2.evt | modeM0/AS1A02_197T01_9000000748_05812cztM0_level2_quad_clean.evt |
| Size (bytes) | 362,672,640 | 55,776,960 |
| Size | 345.9 MB | 53.2 MB |
| Events in quadrant A | 3,293,491 | 326,454 |
| Events in quadrant B | 2,404,368 | 335,036 |
| Events in quadrant C | 2,409,351 | 330,729 |
| Events in quadrant D | 2,510,855 | 320,643 |
| Mode M0 | |||
|---|---|---|---|
| Quadrant | BADHDUFLAG | Total packets | Discarded packets |
| A | 0 | 13922 | 9 |
| B | 0 | 10974 | 13 |
| C | 0 | 11170 | 13 |
| D | 0 | 11474 | 3 |
| Mode SS | |||
|---|---|---|---|
| Quadrant | BADHDUFLAG | Total packets | Discarded packets |
| A | 0 | 110 | 0 |
| B | 0 | 110 | 0 |
| C | 0 | 110 | 0 |
| D | 0 | 110 | 0 |
| Mode M9 | |||
|---|---|---|---|
| Quadrant | BADHDUFLAG | Total packets | Discarded packets |
| A | 0 | 7 | 0 |
| B | 0 | 7 | 0 |
| C | 0 | 7 | 0 |
| D | 0 | 7 | 0 |
| Quadrant | Total seconds | Saturated seconds | Saturation percentage |
|---|---|---|---|
| A | 5364 | 40 | 0.745712% |
| B | 5361 | 30 | 0.559597% |
| C | 5362 | 56 | 1.044386% |
| D | 5366 | 34 | 0.633619% |
Noise dominated data is calculated using 1-second bins in cleaned event files. If a bin has >2000 counts, and if more than 50% of those come from <1% of pixels, then it is considered to be noise-dominated and hence unusable.
| Quadrant | # 1 sec bins | Bins with >0 counts | Bins with >2000 counts | High rate bins dominated by noise | Noise dominated (total time) | Noise dominated (detector-on time) | Marked lightcurve |
|---|---|---|---|---|---|---|---|
| A | 6127 | 5368 | 0 | 0 | 0.00% | 0.00% | 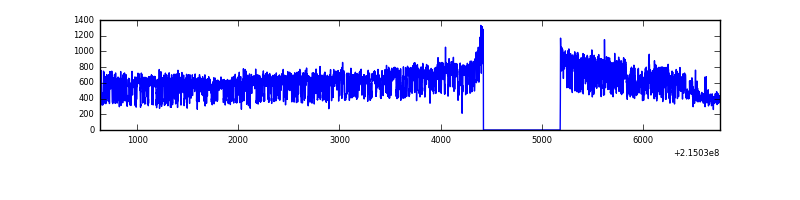 |
| B | 6127 | 5368 | 0 | 0 | 0.00% | 0.00% | 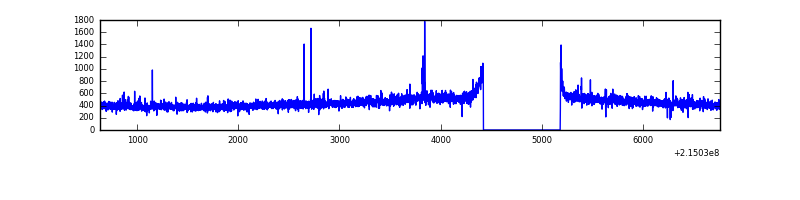 |
| C | 6127 | 5368 | 18 | 18 | 0.29% | 0.34% | 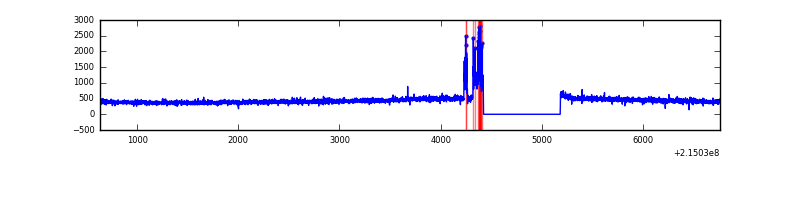 |
| D | 6127 | 5368 | 8 | 8 | 0.13% | 0.15% | 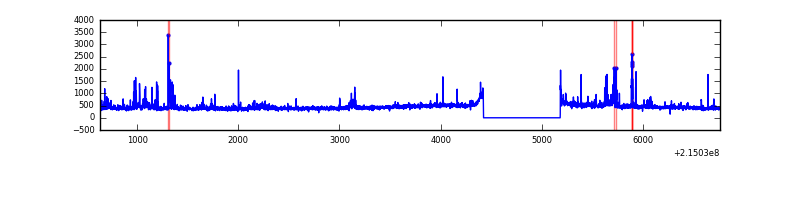 |
Top three noisy pixels from each quadrant. If the there are fewer than three noisy pixels in the level2.evt file, extra rows are filled as -1
| Pixel properties | Quadrant properties | ||||||
|---|---|---|---|---|---|---|---|
| Quadrant | DetID | PixID | Counts | Sigma | Mean | Median | Sigma |
| A | 15 | 236 | 977247 | 7867.73 | 600 | 585 | 124.1 |
| A | 0 | 226 | 5931 | 43.07 | 600 | 585 | 124.1 |
| A | 12 | 194 | 5789 | 41.92 | 600 | 585 | 124.1 |
| B | 10 | 16 | 13193 | 106.44 | 611 | 596 | 118.3 |
| B | 12 | 111 | 11306 | 90.49 | 611 | 596 | 118.3 |
| B | 15 | 204 | 9584 | 75.94 | 611 | 596 | 118.3 |
| C | 9 | 16 | 109545 | 791.16 | 588 | 589 | 137.7 |
| C | 13 | 61 | 4768 | 30.34 | 588 | 589 | 137.7 |
| C | 8 | 222 | 3675 | 22.41 | 588 | 589 | 137.7 |
| D | 8 | 230 | 146478 | 1024.27 | 587 | 569 | 142.5 |
| D | 1 | 239 | 55484 | 385.5 | 587 | 569 | 142.5 |
| D | 9 | 85 | 29228 | 201.18 | 587 | 569 | 142.5 |
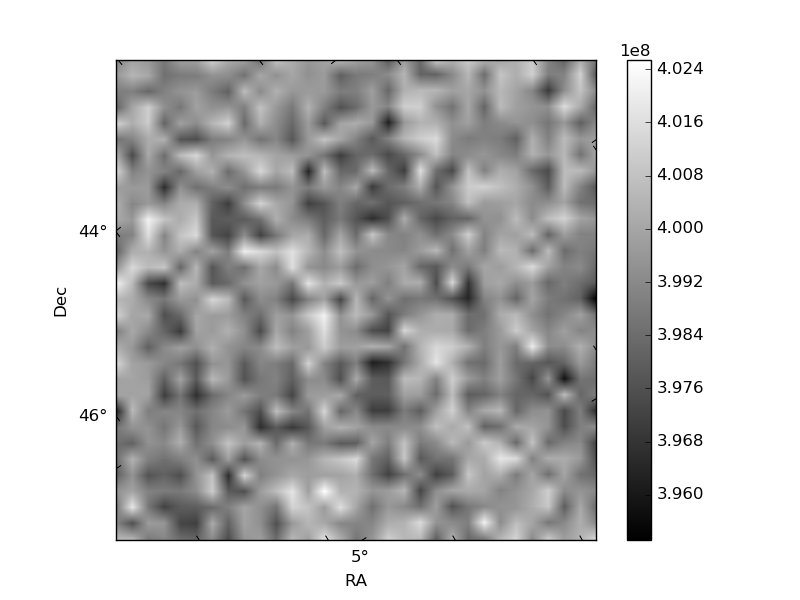
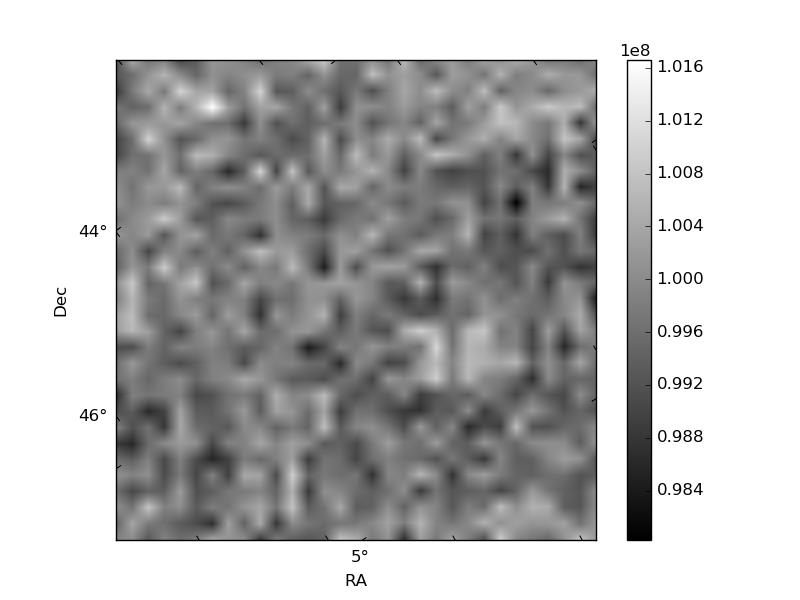
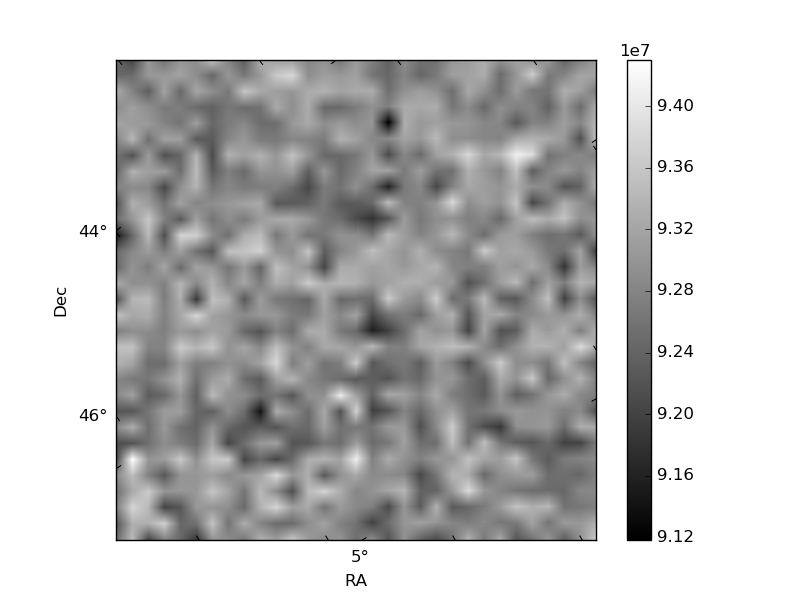
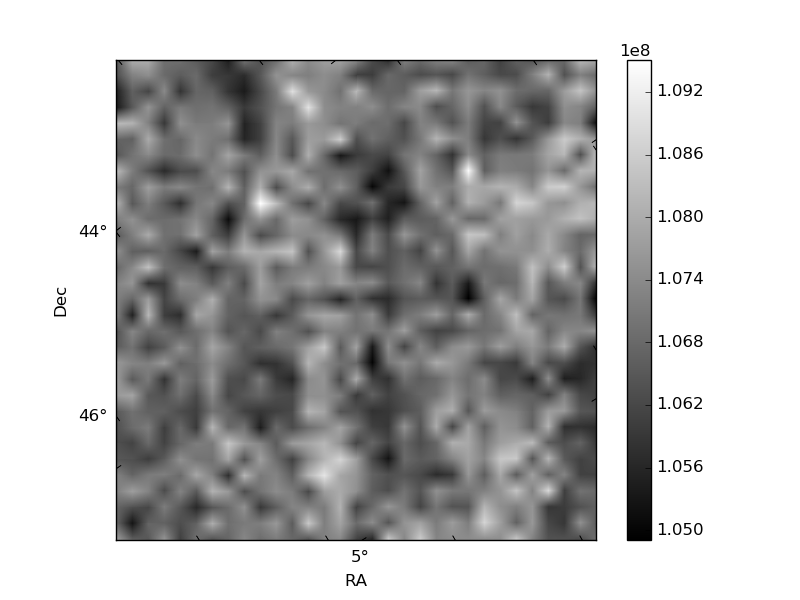
Histogram calculated using DETX and DETY for each event in the final _common_clean file
| Quadrant A | 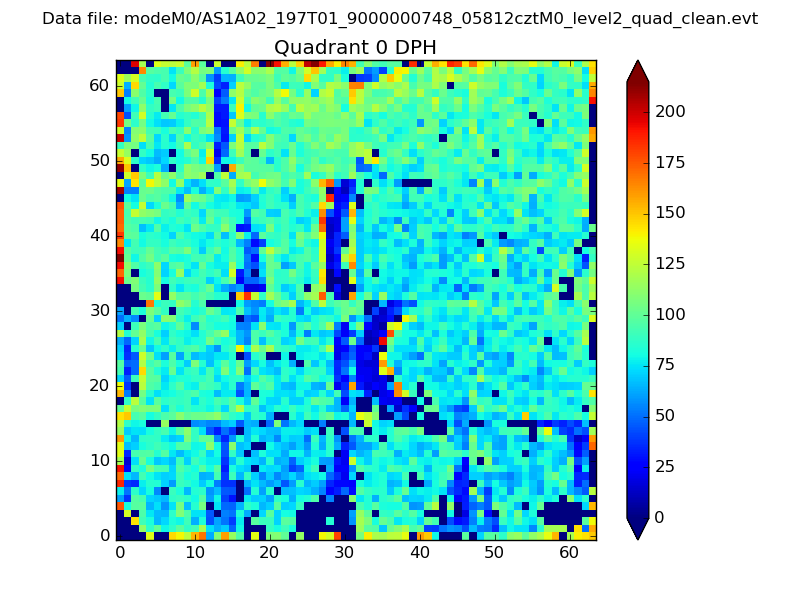 |
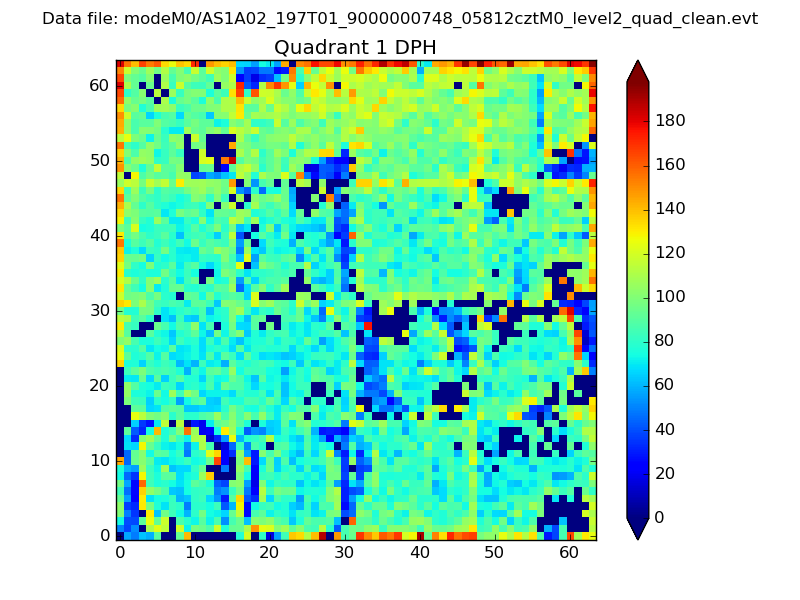 |
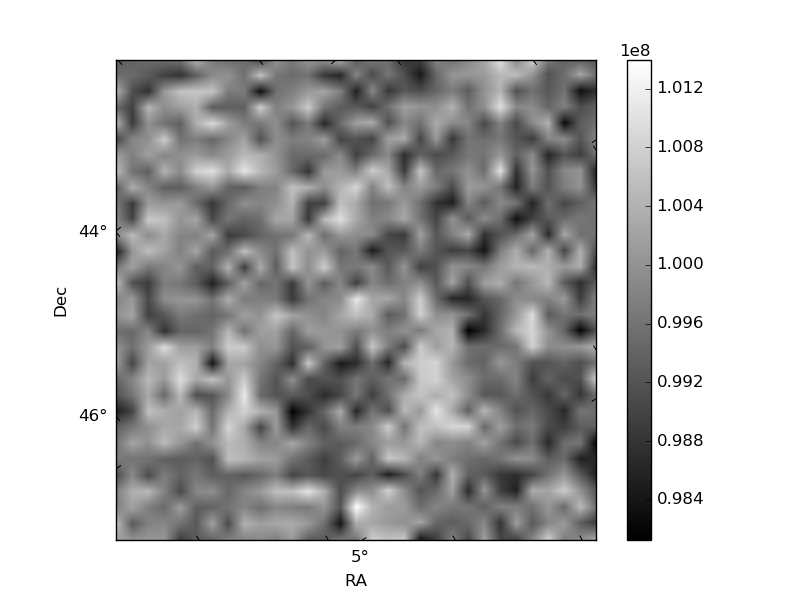
Quadrant B |
|---|---|---|---|
| Quadrant D | 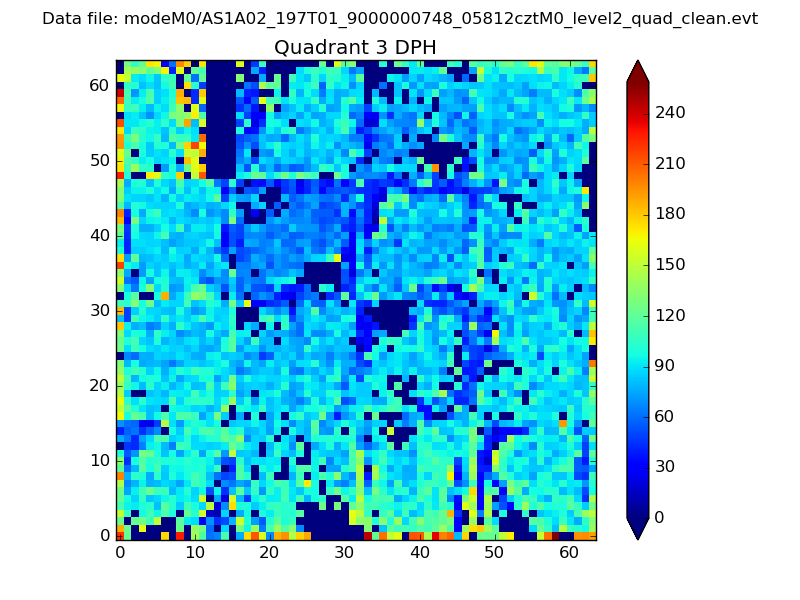 |
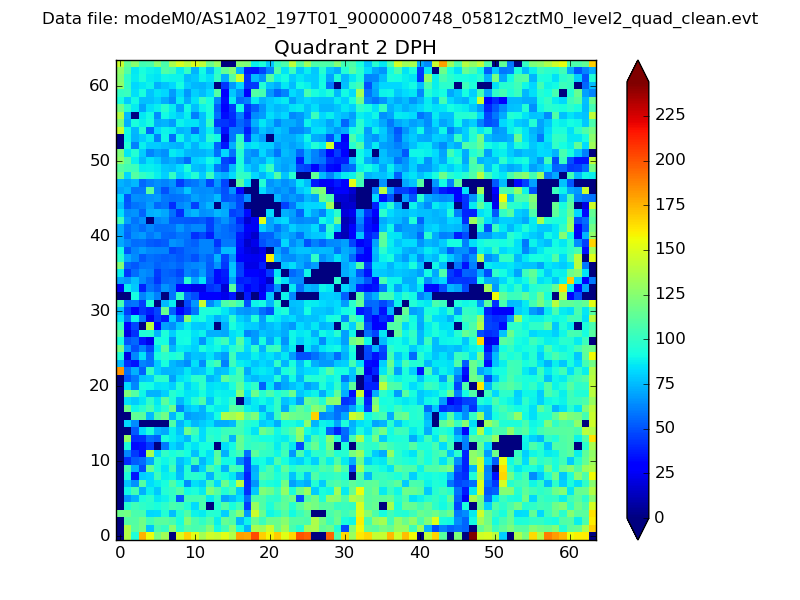 |
Quadrant C |
| Plot type | Count rate plots | Images |
|---|---|---|
| Comparison with Poisson distribution Blue bars denote a histogram of data divided into 1 sec bins. Red curve is a Poisson curve with rate = median count rate of data. |
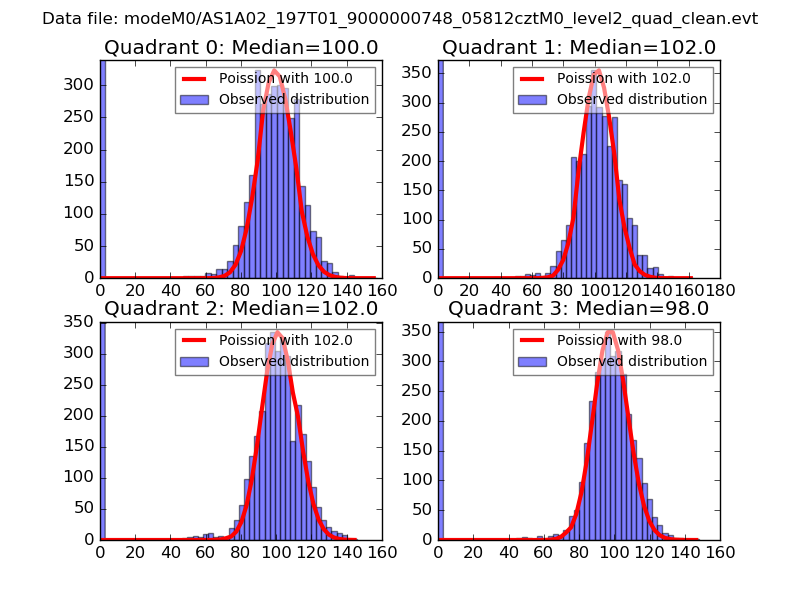 |
 |
| Quadrant-wise count rates Data is divided into 100 sec bins |
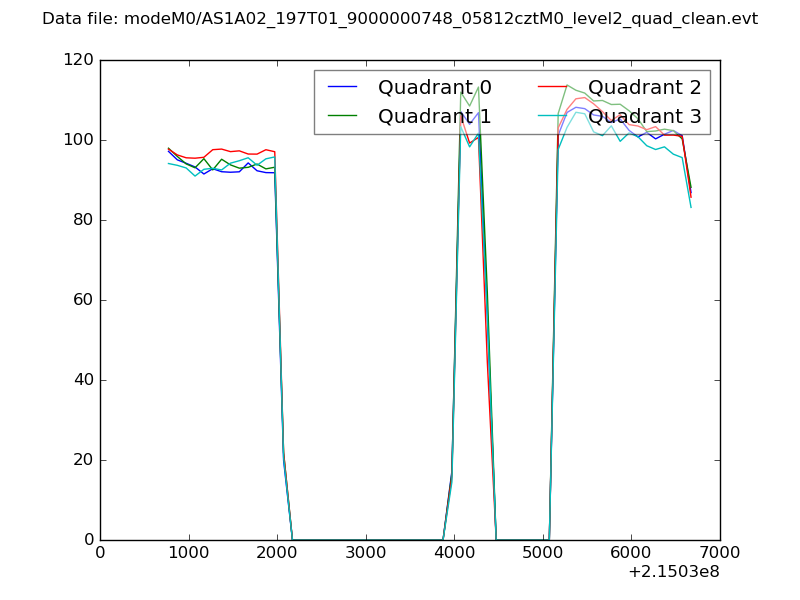 |
|
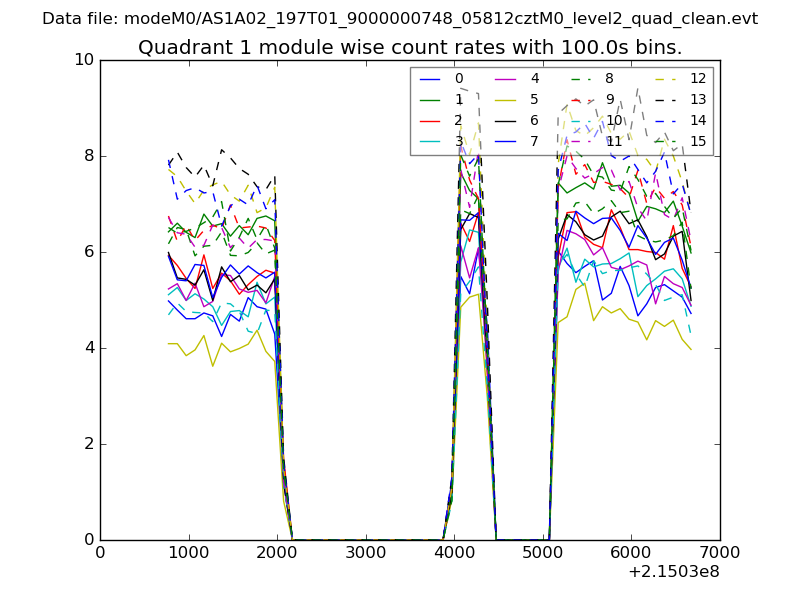
| Module-wise count rates for Quadrant A Data is divided into 100 sec bins |
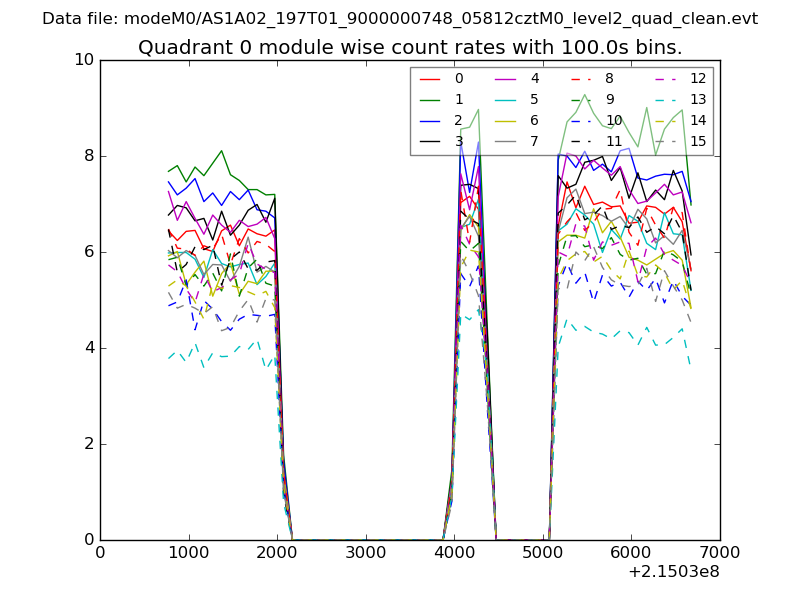 |
 |
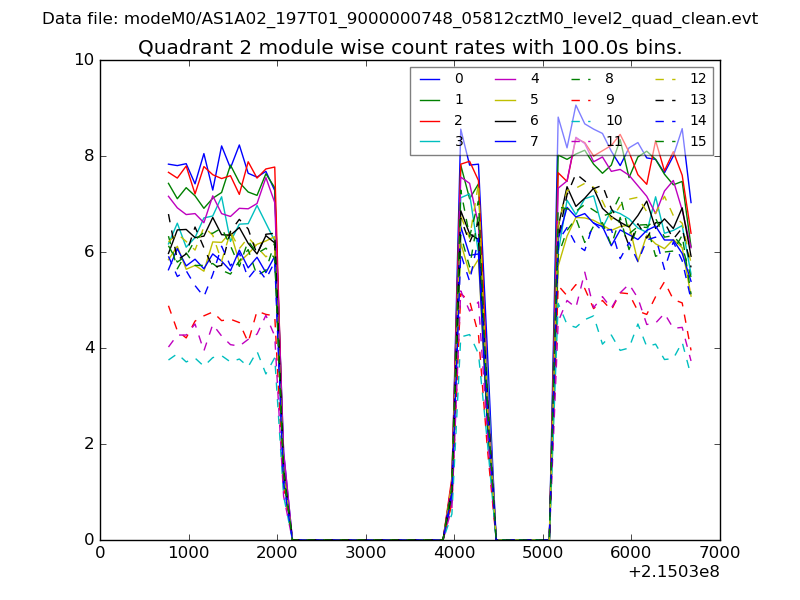
| Module-wise count rates for Quadrant B Data is divided into 100 sec bins |
 |
 |
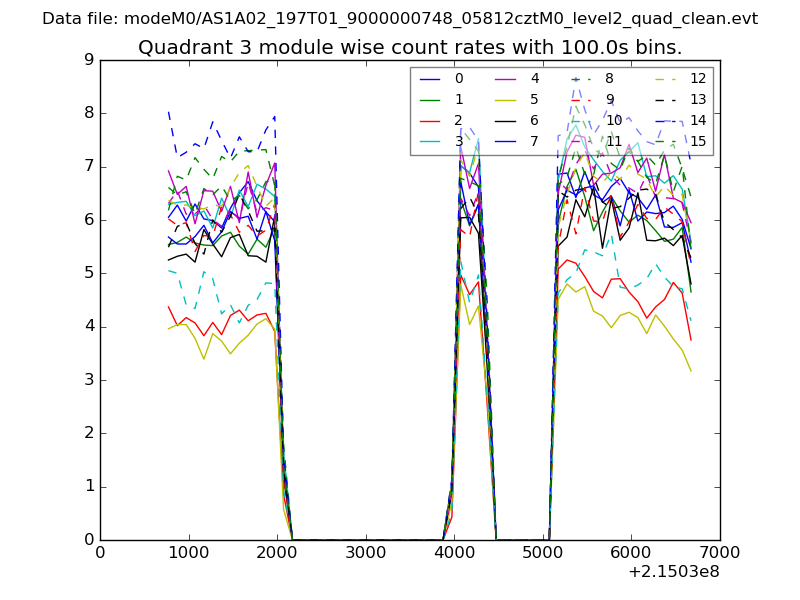
| Module-wise count rates for Quadrant C Data is divided into 100 sec bins |
 |
 |
| Module-wise count rates for Quadrant D Data is divided into 100 sec bins |
 |
 |
| Parameter | Plot |
|---|---|
| CZT HV Monitor | 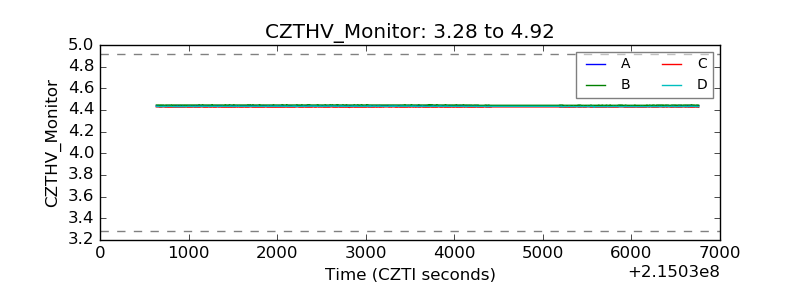 |
| D_VDD | 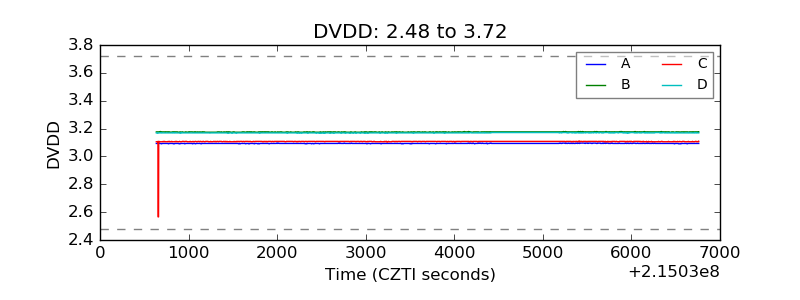 |
| Temperature 1 | 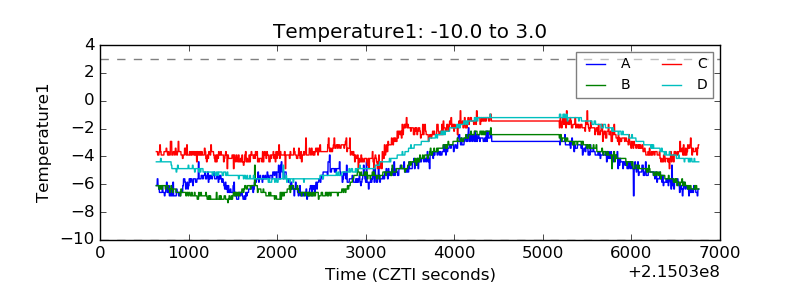 |
| Veto HV Monitor | 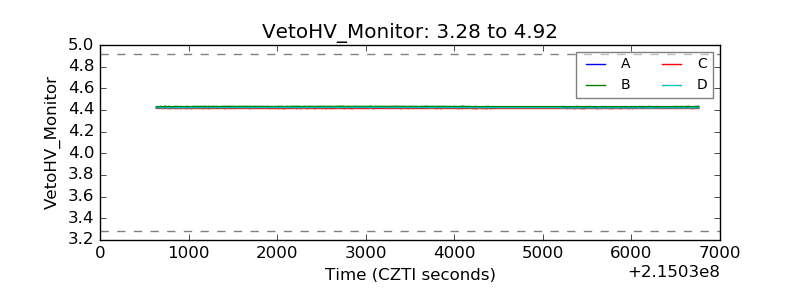 |
| Veto LLD | 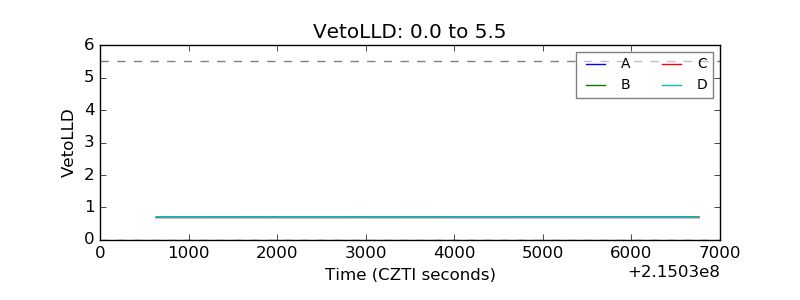 |
| Alpha Counter | 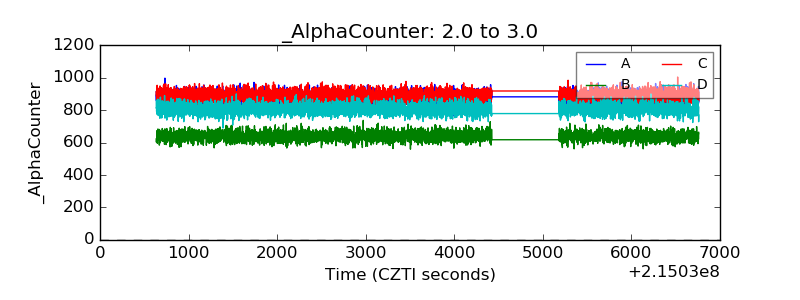 |
| _CPM_Rate | 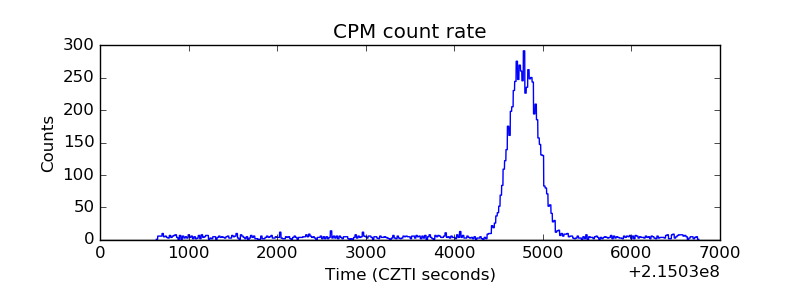 |
| CZT Counter | 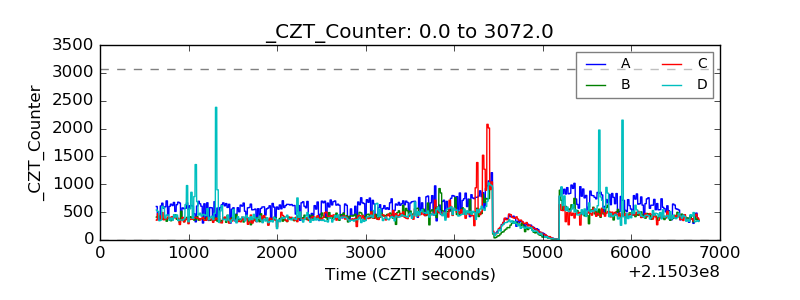 |
| +2.5 Volts monitor | 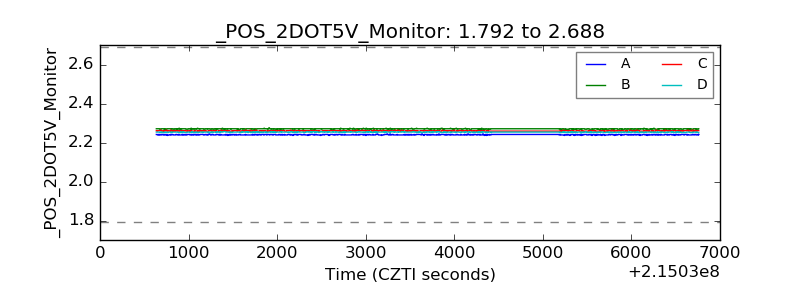 |
| +5 Volts monitor |  |
| _ROLL_ROT | 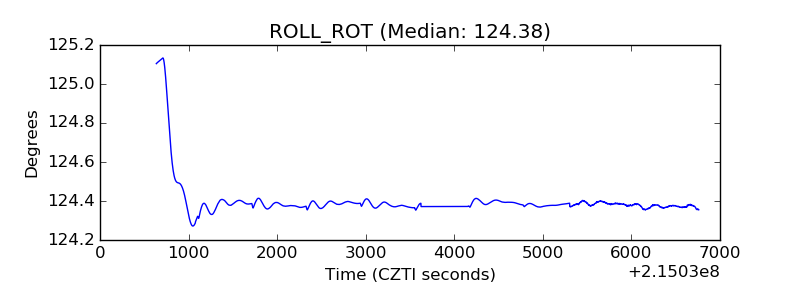 |
| _Roll_DEC | 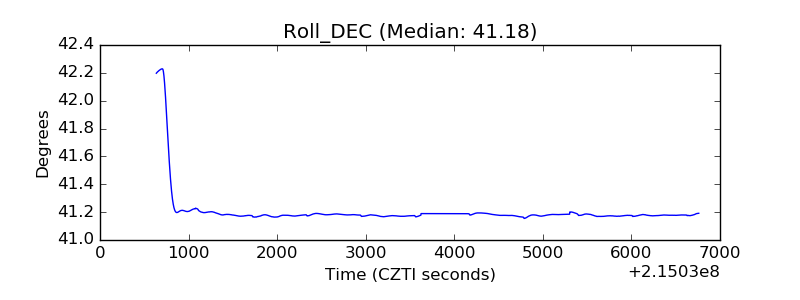 |
| _Roll_RA | 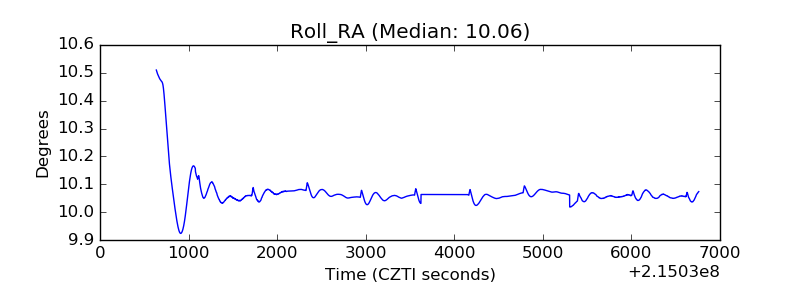 |
| Veto Counter | 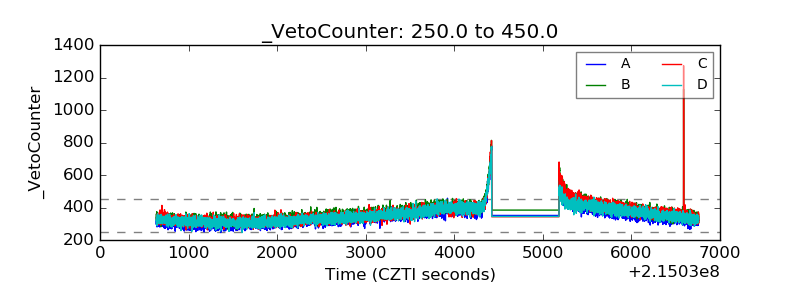 |