| Param | Original file | Final file |
|---|---|---|
| Filename | modeM0/AS1A02_197T02_9000000752cztM0_level2.fits | modeM0/AS1A02_197T02_9000000752cztM0_level2_quad_clean.evt |
| Size (bytes) | 135,688,320 | 132,344,640 |
| Size | 129.4 MB | 126.2 MB |
| Events in quadrant A | 804,408 | 773,243 |
| Events in quadrant B | 787,576 | 779,981 |
| Events in quadrant C | 798,368 | 741,002 |
| Events in quadrant D | 687,646 | 682,092 |
| Mode M9 | |||
|---|---|---|---|
| Quadrant | BADHDUFLAG | Total packets | Discarded packets |
| A | 0 | 5 | 0 |
| B | 0 | 5 | 0 |
| C | 0 | 5 | 0 |
| D | 0 | 5 | 0 |
| Mode SS | |||
|---|---|---|---|
| Quadrant | BADHDUFLAG | Total packets | Discarded packets |
| A | 0 | 302 | 0 |
| B | 0 | 300 | 0 |
| C | 0 | 300 | 0 |
| D | 0 | 300 | 0 |
| Mode M0 | |||
|---|---|---|---|
| Quadrant | BADHDUFLAG | Total packets | Discarded packets |
| A | 0 | 31129 | 0 |
| B | 0 | 31250 | 0 |
| C | 0 | 30811 | 0 |
| D | 0 | 32070 | 0 |
| Quadrant | Total seconds | Saturated seconds | Saturation percentage |
|---|---|---|---|
| A | 14957 | 426 | 2.848165% |
| B | 14943 | 412 | 2.757144% |
| C | 14938 | 284 | 1.901192% |
| D | 14944 | 328 | 2.194861% |
Noise dominated data is calculated using 1-second bins in cleaned event files. If a bin has >2000 counts, and if more than 50% of those come from <1% of pixels, then it is considered to be noise-dominated and hence unusable.
| Quadrant | # 1 sec bins | Bins with >0 counts | Bins with >2000 counts | High rate bins dominated by noise | Noise dominated (total time) | Noise dominated (detector-on time) | Marked lightcurve |
|---|---|---|---|---|---|---|---|
| A | 15146 | 15045 | 0 | 0 | 0.00% | 0.00% |  |
| B | 15146 | 15044 | 0 | 0 | 0.00% | 0.00% |  |
| C | 15146 | 15047 | 0 | 0 | 0.00% | 0.00% |  |
| D | 15146 | 15043 | 0 | 0 | 0.00% | 0.00% | 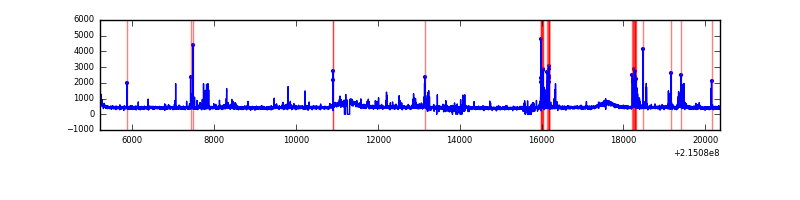 |
Top three noisy pixels from each quadrant. If the there are fewer than three noisy pixels in the level2.evt file, extra rows are filled as -1
| Pixel properties | Quadrant properties | ||||||
|---|---|---|---|---|---|---|---|
| Quadrant | DetID | PixID | Counts | Sigma | Mean | Median | Sigma |
| A | 0 | 29 | 770 | 10.46 | 209 | 196 | 54.9 |
| A | 7 | 110 | 708 | 9.33 | 209 | 196 | 54.9 |
| A | 9 | 19 | 604 | 7.44 | 209 | 196 | 54.9 |
| B | 2 | 9 | 699 | 11.2 | 207 | 197 | 44.8 |
| B | 12 | 226 | 574 | 8.41 | 207 | 197 | 44.8 |
| B | 2 | 8 | 539 | 7.63 | 207 | 197 | 44.8 |
| C | 12 | 241 | 576 | 6.67 | 210 | 193 | 57.5 |
| C | 7 | 111 | 548 | 6.18 | 210 | 193 | 57.5 |
| C | 9 | 188 | 541 | 6.06 | 210 | 193 | 57.5 |
| D | 11 | 82 | 542 | 6.84 | 196 | 178 | 53.2 |
| D | 3 | 14 | 519 | 6.41 | 196 | 178 | 53.2 |
| D | 6 | 231 | 516 | 6.35 | 196 | 178 | 53.2 |
Histogram calculated using DETX and DETY for each event in the final _common_clean file
| Quadrant A |  |
 |
Quadrant B |
|---|---|---|---|
| Quadrant D | 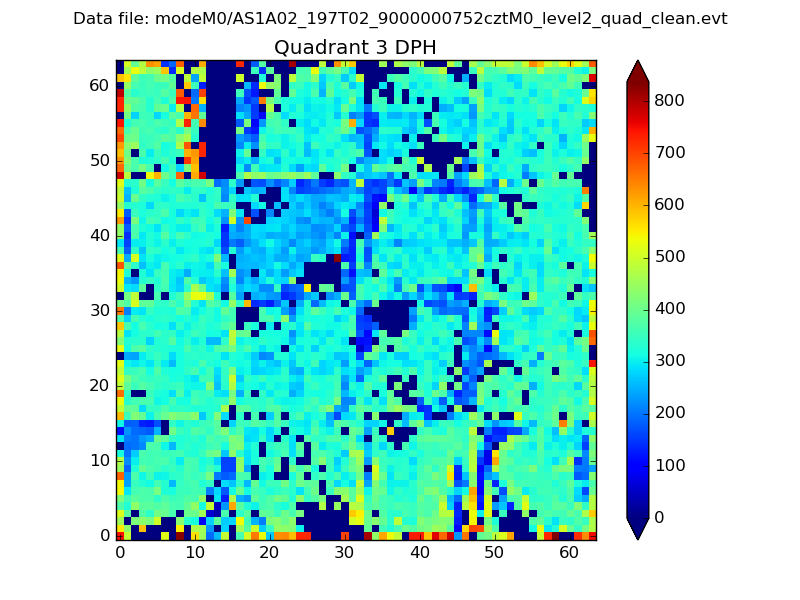 |
 |
Quadrant C |
| Plot type | Count rate plots | Images |
|---|---|---|
| Comparison with Poisson distribution Blue bars denote a histogram of data divided into 1 sec bins. Red curve is a Poisson curve with rate = median count rate of data. |
 |
 |
| Quadrant-wise count rates Data is divided into 100 sec bins |
 |
|
| Module-wise count rates for Quadrant A Data is divided into 100 sec bins |
 |
 |
| Module-wise count rates for Quadrant B Data is divided into 100 sec bins |
 |
 |
| Module-wise count rates for Quadrant C Data is divided into 100 sec bins |
 |
 |
| Module-wise count rates for Quadrant D Data is divided into 100 sec bins |
 |
 |
| Parameter | Plot |
|---|---|
| CZT HV Monitor |  |
| D_VDD | 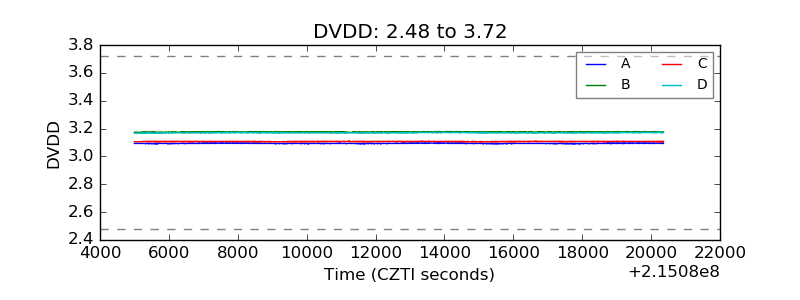 |
| Temperature 1 | 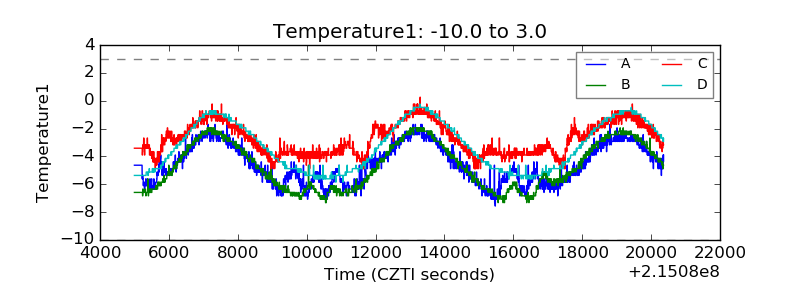 |
| Veto HV Monitor |  |
| Veto LLD |  |
| Alpha Counter |  |
| _CPM_Rate |  |
| CZT Counter |  |
| +2.5 Volts monitor | 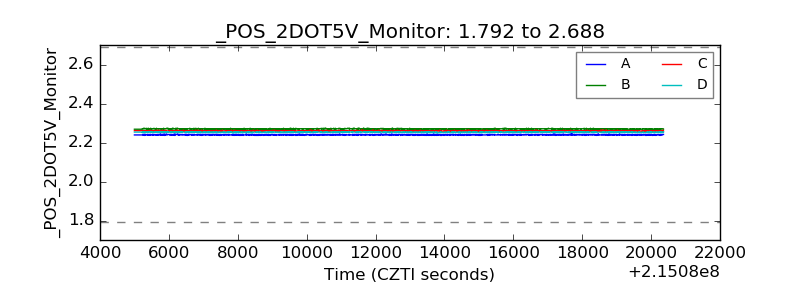 |
| +5 Volts monitor |  |
| _ROLL_ROT |  |
| _Roll_DEC |  |
| _Roll_RA |  |
| Veto Counter |  |