| Param | Original file | Final file |
|---|---|---|
| Filename | modeM0/AS1A02_197T02_9000000752_05821cztM0_level2.evt | modeM0/AS1A02_197T02_9000000752_05821cztM0_level2_quad_clean.evt |
| Size (bytes) | 115,686,720 | 9,216,000 |
| Size | 110.3 MB | 8.8 MB |
| Events in quadrant A | 884,054 | 36,796 |
| Events in quadrant B | 874,467 | 38,106 |
| Events in quadrant C | 820,758 | 35,452 |
| Events in quadrant D | 796,924 | 34,005 |
| Mode M9 | |||
|---|---|---|---|
| Quadrant | BADHDUFLAG | Total packets | Discarded packets |
| A | 0 | 3 | 0 |
| B | 0 | 3 | 0 |
| C | 0 | 3 | 0 |
| D | 0 | 3 | 0 |
| Mode SS | |||
|---|---|---|---|
| Quadrant | BADHDUFLAG | Total packets | Discarded packets |
| A | 0 | 36 | 0 |
| B | 0 | 36 | 0 |
| C | 0 | 36 | 0 |
| D | 0 | 36 | 0 |
| Mode M0 | |||
|---|---|---|---|
| Quadrant | BADHDUFLAG | Total packets | Discarded packets |
| A | 0 | 3868 | 2 |
| B | 0 | 3769 | 1 |
| C | 0 | 3741 | 1 |
| D | 0 | 3747 | 1 |
| Quadrant | Total seconds | Saturated seconds | Saturation percentage |
|---|---|---|---|
| A | 1832 | 32 | 1.746725% |
| B | 1832 | 20 | 1.091703% |
| C | 1832 | 10 | 0.545852% |
| D | 1832 | 9 | 0.491266% |
Noise dominated data is calculated using 1-second bins in cleaned event files. If a bin has >2000 counts, and if more than 50% of those come from <1% of pixels, then it is considered to be noise-dominated and hence unusable.
| Quadrant | # 1 sec bins | Bins with >0 counts | Bins with >2000 counts | High rate bins dominated by noise | Noise dominated (total time) | Noise dominated (detector-on time) | Marked lightcurve |
|---|---|---|---|---|---|---|---|
| A | 1832 | 1832 | 0 | 0 | 0.00% | 0.00% | 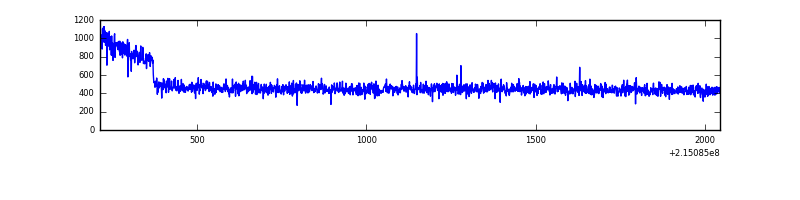 |
| B | 1832 | 1832 | 0 | 0 | 0.00% | 0.00% | 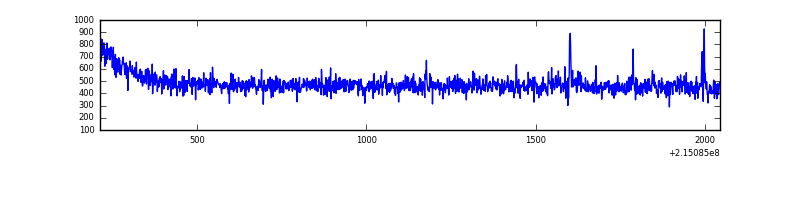 |
| C | 1832 | 1832 | 0 | 0 | 0.00% | 0.00% | 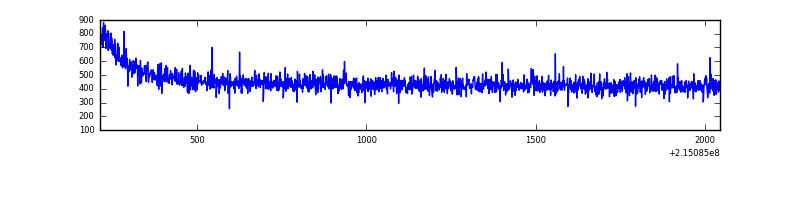 |
| D | 1832 | 1832 | 1 | 1 | 0.05% | 0.05% | 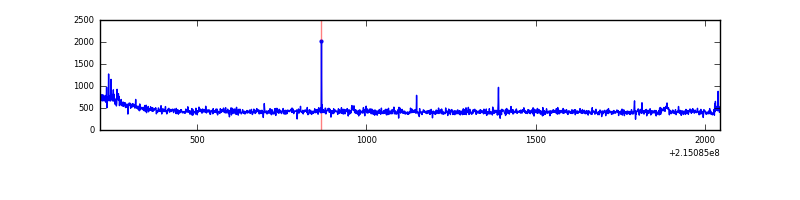 |
Top three noisy pixels from each quadrant. If the there are fewer than three noisy pixels in the level2.evt file, extra rows are filled as -1
| Pixel properties | Quadrant properties | ||||||
|---|---|---|---|---|---|---|---|
| Quadrant | DetID | PixID | Counts | Sigma | Mean | Median | Sigma |
| A | 15 | 236 | 42577 | 898.94 | 218 | 214 | 47.1 |
| A | 0 | 226 | 2094 | 39.89 | 218 | 214 | 47.1 |
| A | 12 | 194 | 2042 | 38.79 | 218 | 214 | 47.1 |
| B | 15 | 204 | 9866 | 214.25 | 222 | 216 | 45.0 |
| B | 4 | 81 | 7114 | 153.15 | 222 | 216 | 45.0 |
| B | 12 | 111 | 4414 | 93.21 | 222 | 216 | 45.0 |
| C | 14 | 67 | 4888 | 93.43 | 208 | 209 | 50.1 |
| C | 13 | 61 | 1764 | 31.05 | 208 | 209 | 50.1 |
| C | 9 | 16 | 1473 | 25.24 | 208 | 209 | 50.1 |
| D | 2 | 206 | 3014 | 52.97 | 207 | 200 | 53.1 |
| D | 1 | 239 | 2814 | 49.2 | 207 | 200 | 53.1 |
| D | 3 | 238 | 2554 | 44.31 | 207 | 200 | 53.1 |
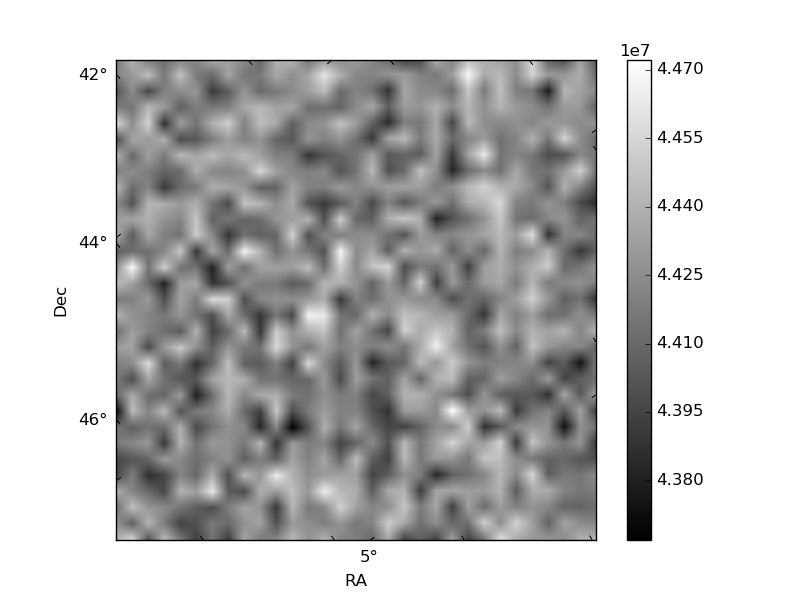
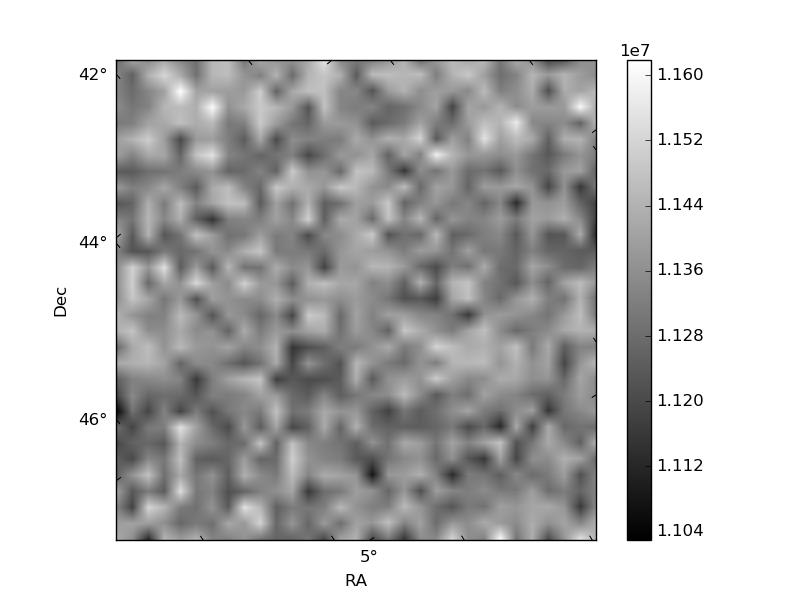
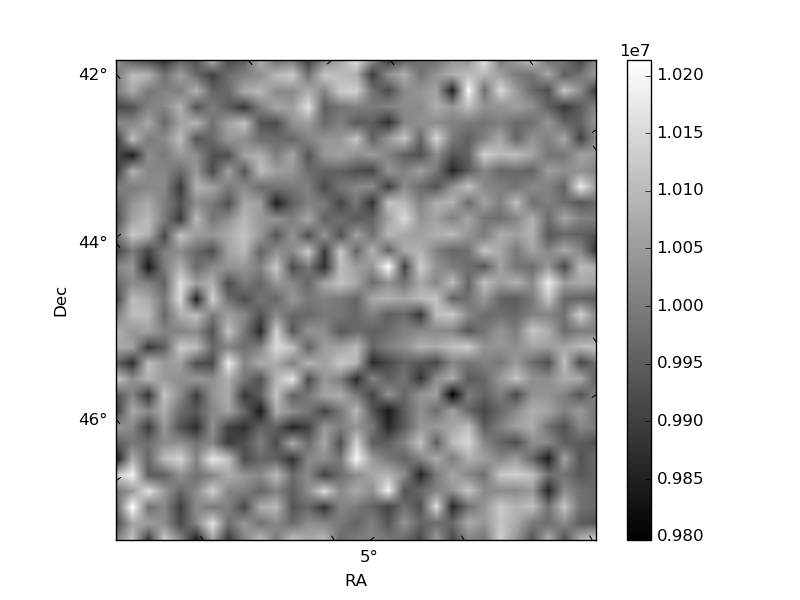
Histogram calculated using DETX and DETY for each event in the final _common_clean file
| Quadrant A | 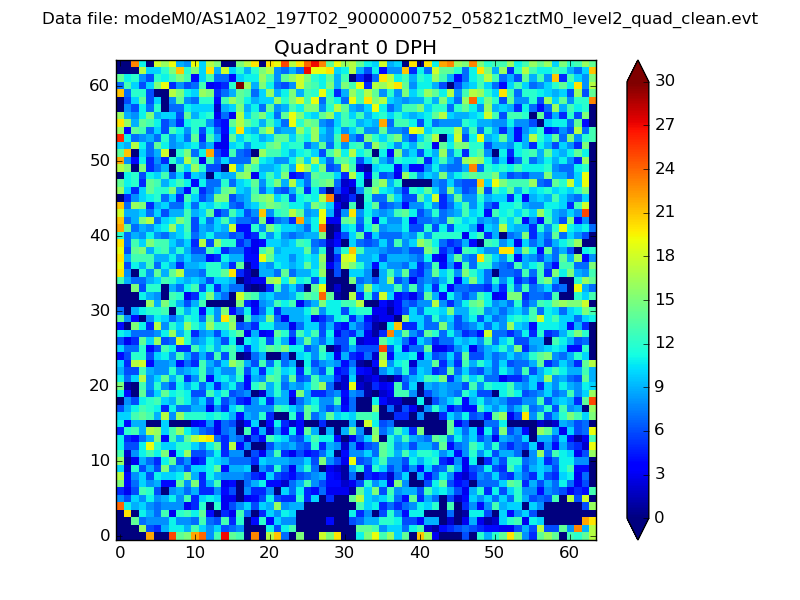 |
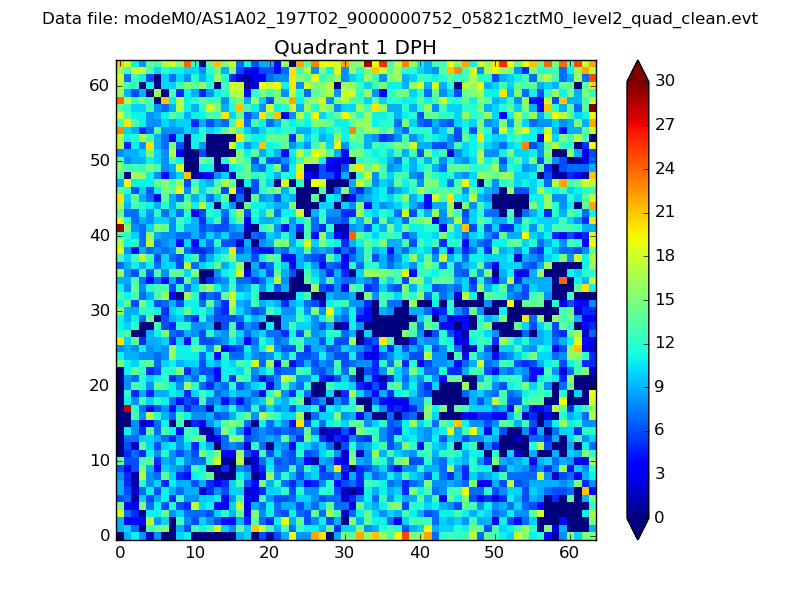 |
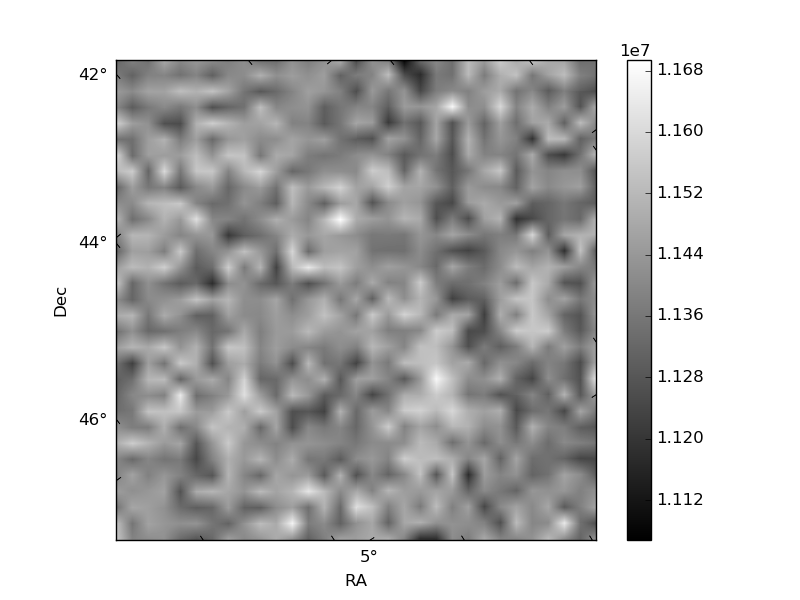
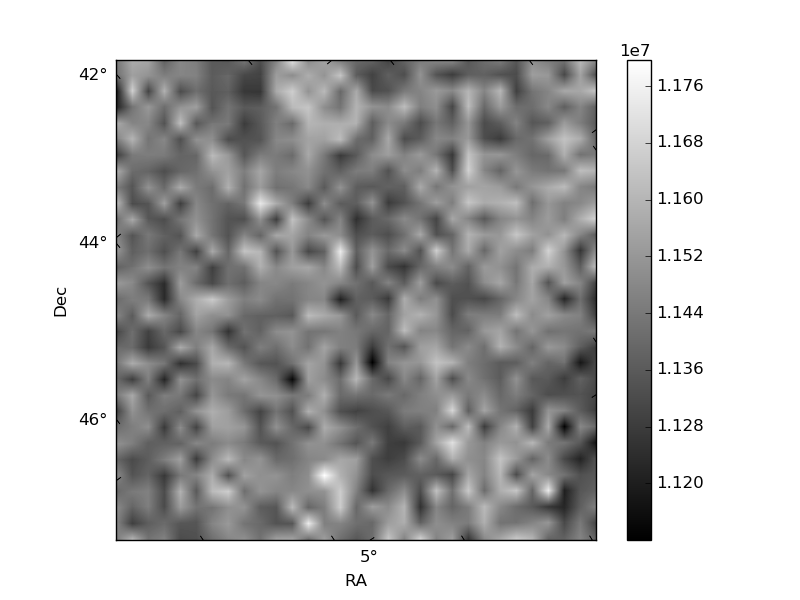
Quadrant B |
|---|---|---|---|
| Quadrant D | 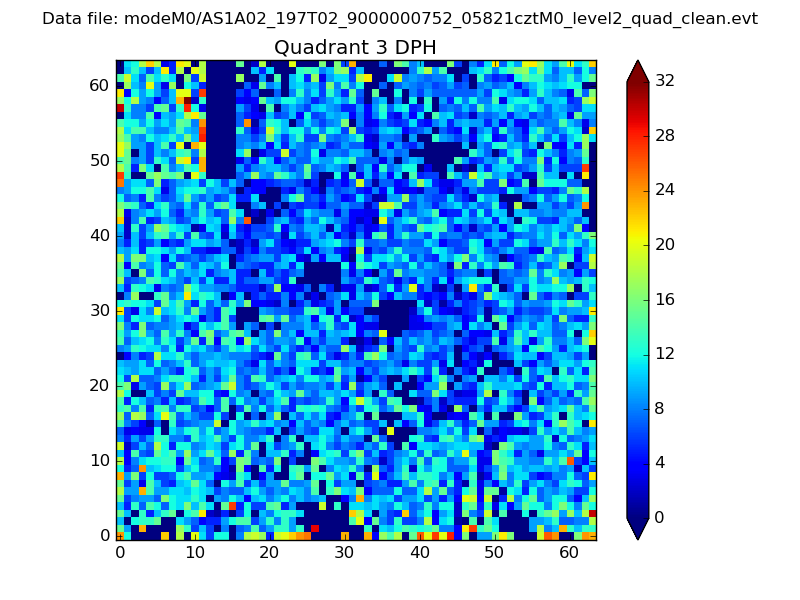 |
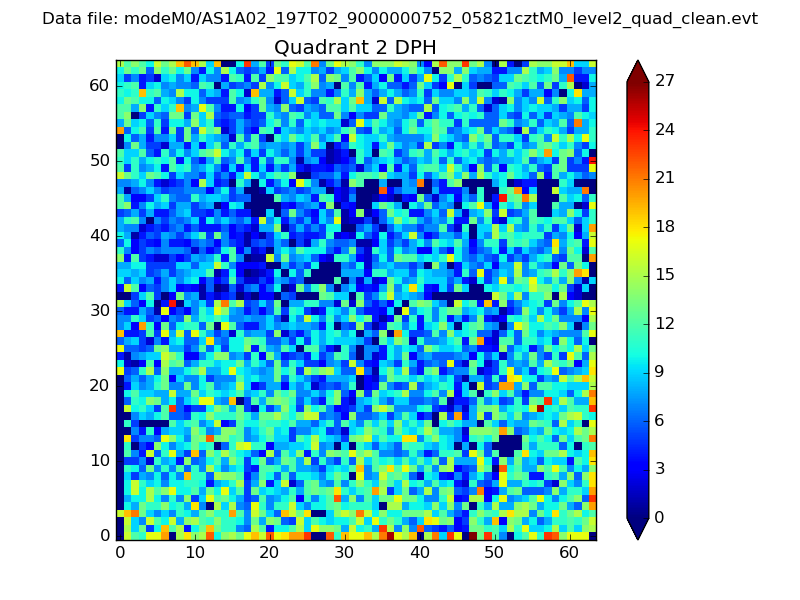 |
Quadrant C |
| Plot type | Count rate plots | Images |
|---|---|---|
| Comparison with Poisson distribution Blue bars denote a histogram of data divided into 1 sec bins. Red curve is a Poisson curve with rate = median count rate of data. |
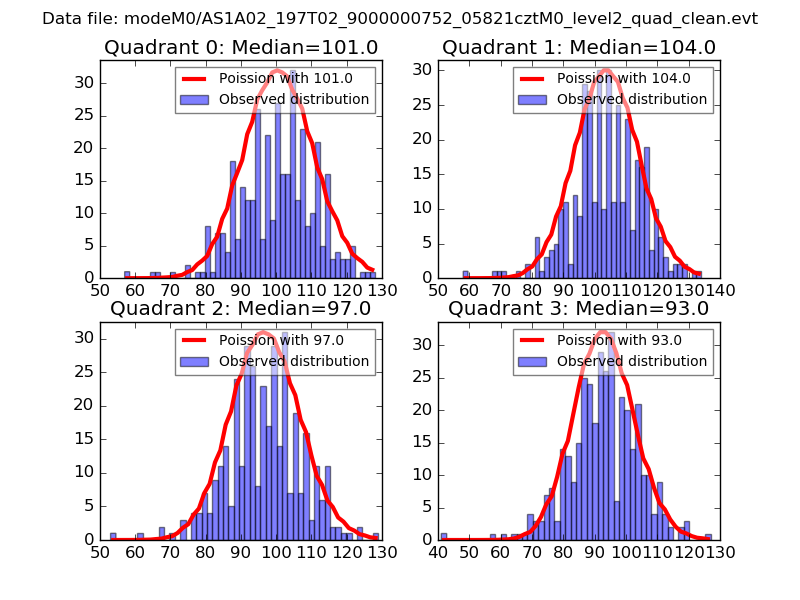 |
 |
| Quadrant-wise count rates Data is divided into 100 sec bins |
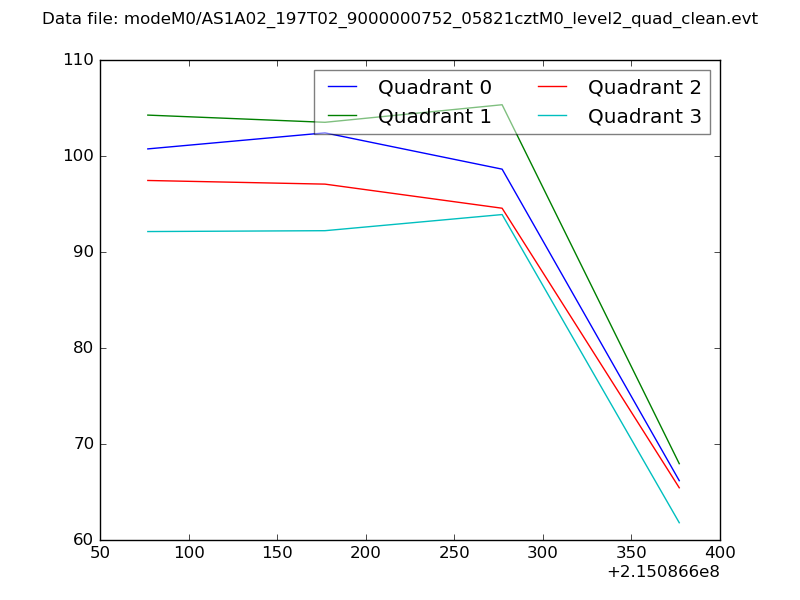 |
|
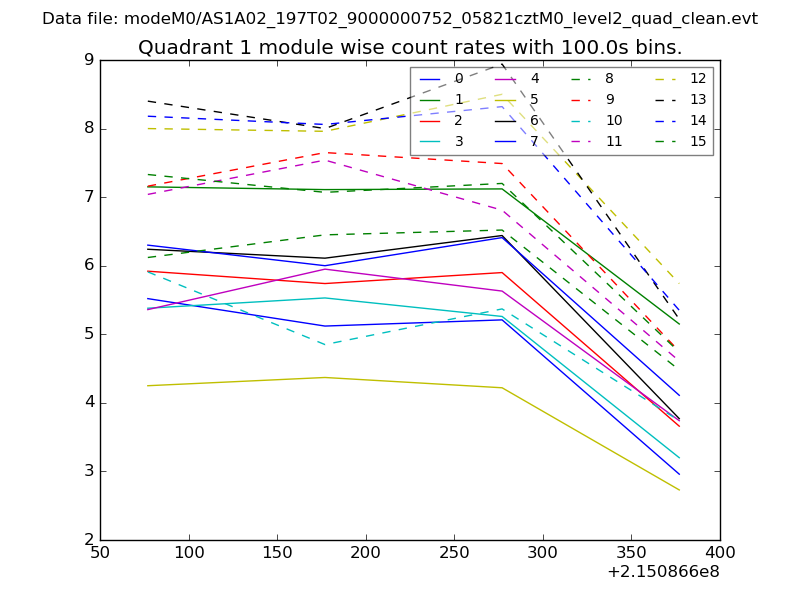
| Module-wise count rates for Quadrant A Data is divided into 100 sec bins |
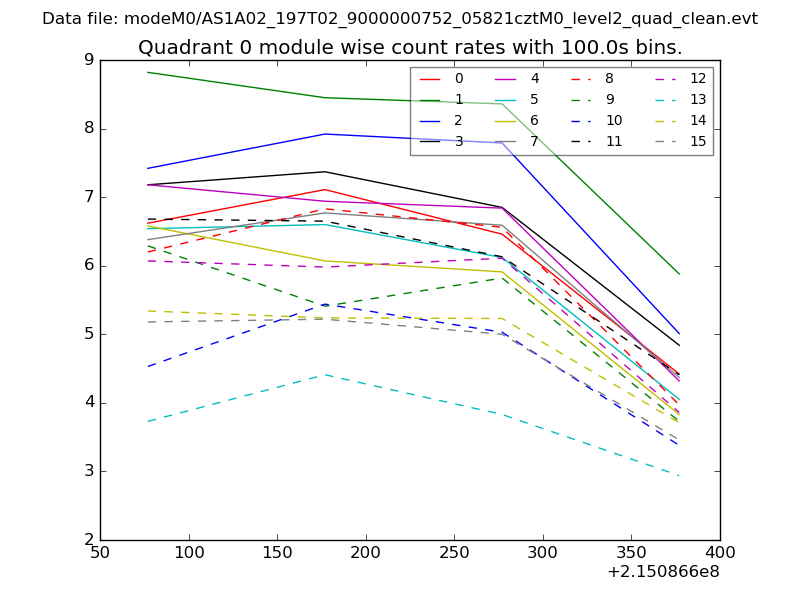 |
 |
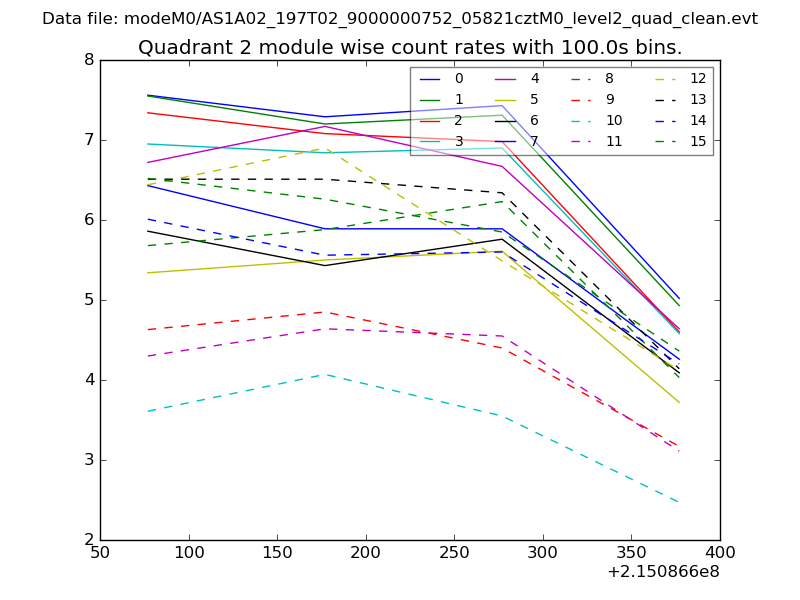
| Module-wise count rates for Quadrant B Data is divided into 100 sec bins |
 |
 |
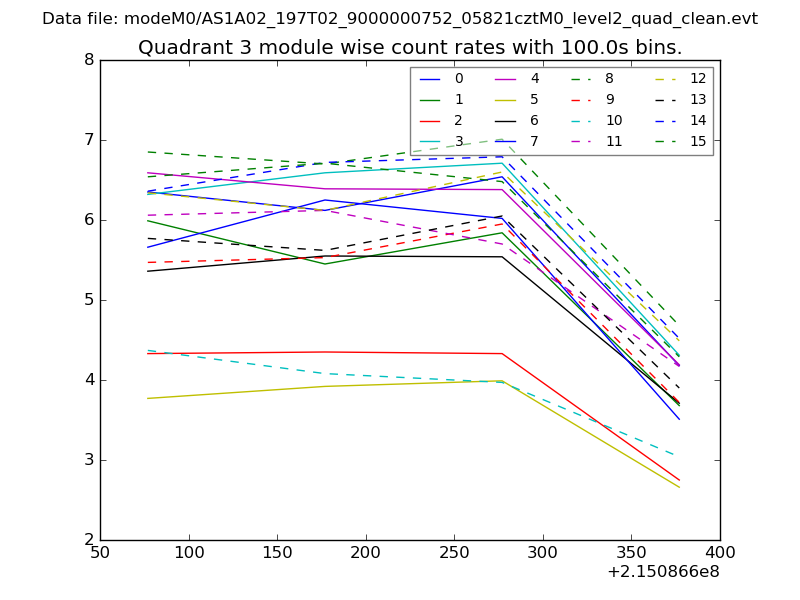
| Module-wise count rates for Quadrant C Data is divided into 100 sec bins |
 |
 |
| Module-wise count rates for Quadrant D Data is divided into 100 sec bins |
 |
 |
| Parameter | Plot |
|---|---|
| CZT HV Monitor | 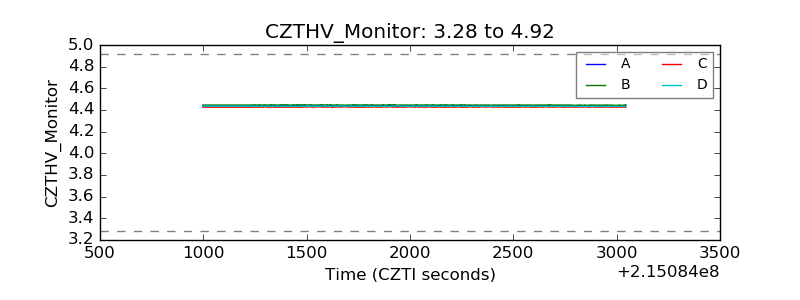 |
| D_VDD | 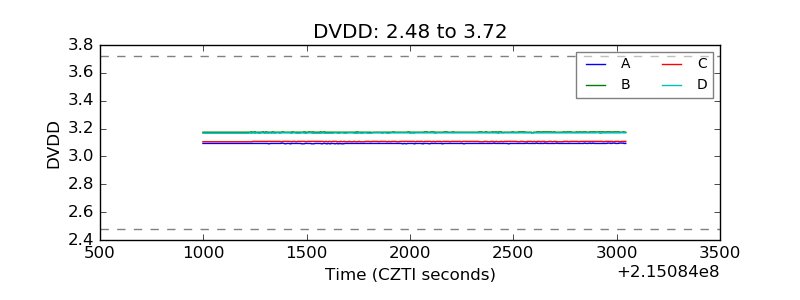 |
| Temperature 1 | 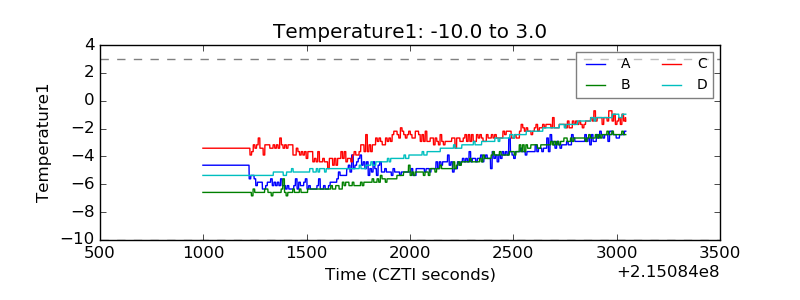 |
| Veto HV Monitor | 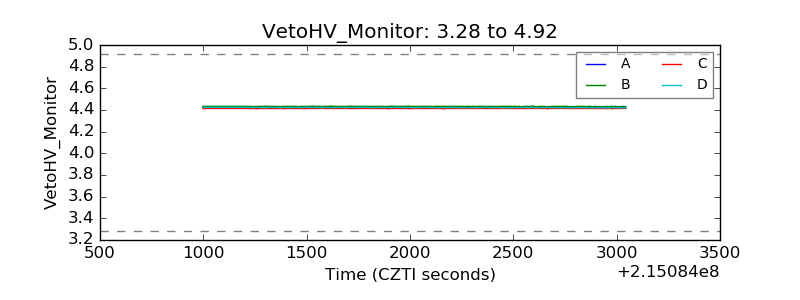 |
| Veto LLD | 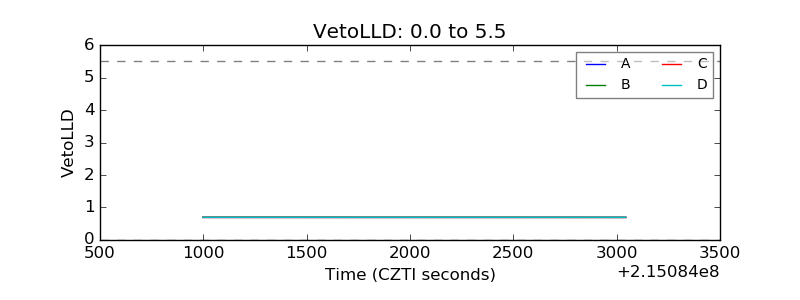 |
| Alpha Counter | 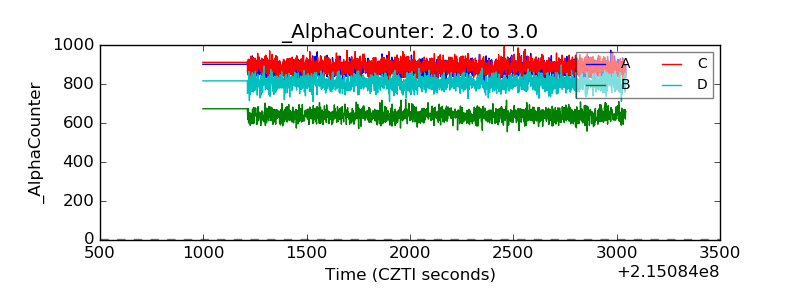 |
| _CPM_Rate | 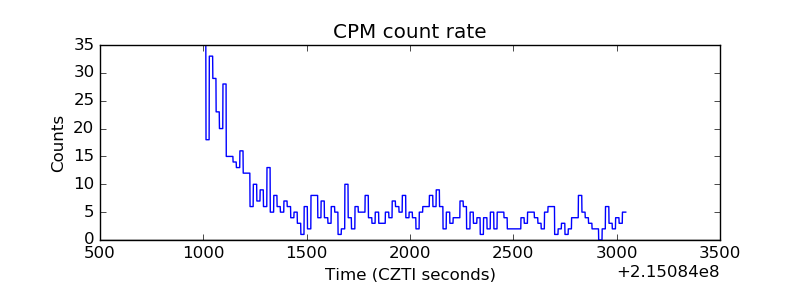 |
| CZT Counter | 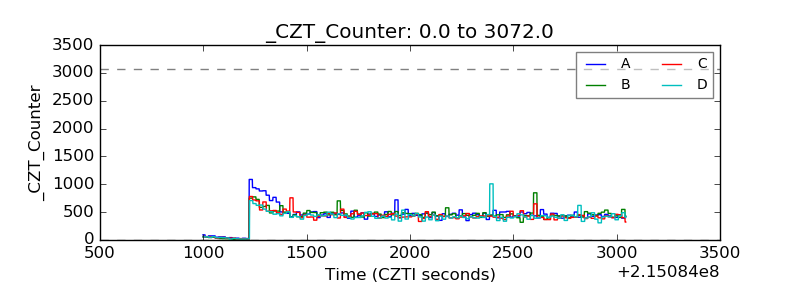 |
| +2.5 Volts monitor |  |
| +5 Volts monitor |  |
| _ROLL_ROT | 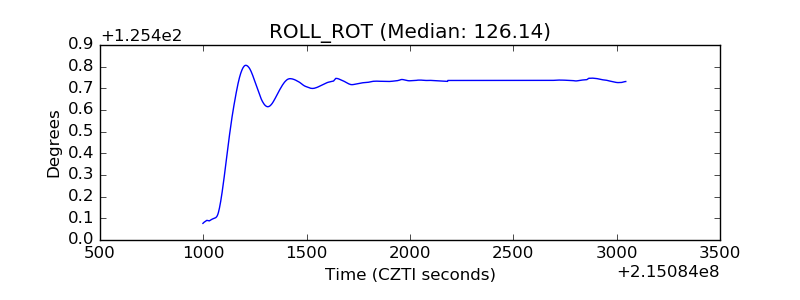 |
| _Roll_DEC | 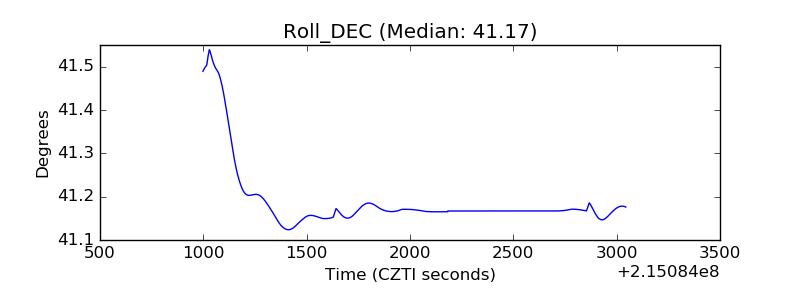 |
| _Roll_RA | 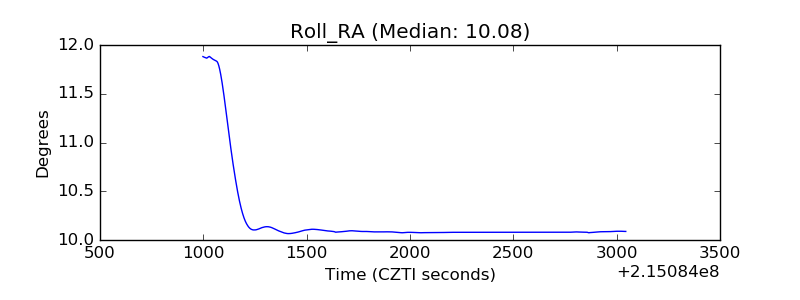 |
| Veto Counter | 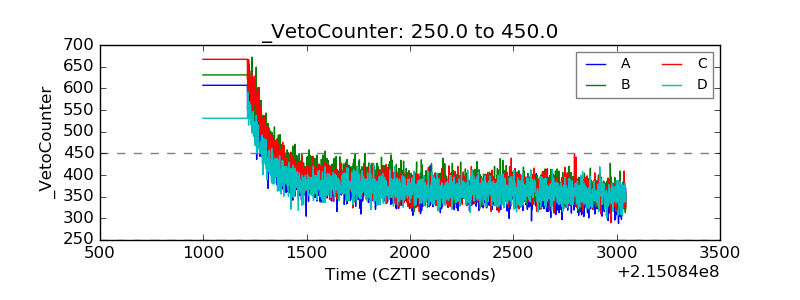 |