| Param | Original file | Final file |
|---|---|---|
| Filename | modeM0/AS1A02_197T02_9000000752_05822cztM0_level2.evt | modeM0/AS1A02_197T02_9000000752_05822cztM0_level2_quad_clean.evt |
| Size (bytes) | 503,951,040 | 79,223,040 |
| Size | 480.6 MB | 75.6 MB |
| Events in quadrant A | 3,688,943 | 468,144 |
| Events in quadrant B | 3,800,300 | 473,745 |
| Events in quadrant C | 3,572,640 | 463,408 |
| Events in quadrant D | 3,664,259 | 445,636 |
| Mode M9 | |||
|---|---|---|---|
| Quadrant | BADHDUFLAG | Total packets | Discarded packets |
| A | 0 | 5 | 0 |
| B | 0 | 5 | 0 |
| C | 0 | 5 | 0 |
| D | 0 | 5 | 0 |
| Mode SS | |||
|---|---|---|---|
| Quadrant | BADHDUFLAG | Total packets | Discarded packets |
| A | 0 | 158 | 0 |
| B | 0 | 158 | 0 |
| C | 0 | 158 | 0 |
| D | 0 | 158 | 0 |
| Mode M0 | |||
|---|---|---|---|
| Quadrant | BADHDUFLAG | Total packets | Discarded packets |
| A | 0 | 16563 | 3 |
| B | 0 | 16533 | 2 |
| C | 0 | 16305 | 2 |
| D | 0 | 16669 | 2 |
| Quadrant | Total seconds | Saturated seconds | Saturation percentage |
|---|---|---|---|
| A | 7892 | 318 | 4.029397% |
| B | 7892 | 318 | 4.029397% |
| C | 7892 | 220 | 2.787633% |
| D | 7892 | 245 | 3.104410% |
Noise dominated data is calculated using 1-second bins in cleaned event files. If a bin has >2000 counts, and if more than 50% of those come from <1% of pixels, then it is considered to be noise-dominated and hence unusable.
| Quadrant | # 1 sec bins | Bins with >0 counts | Bins with >2000 counts | High rate bins dominated by noise | Noise dominated (total time) | Noise dominated (detector-on time) | Marked lightcurve |
|---|---|---|---|---|---|---|---|
| A | 7977 | 7894 | 2 | 2 | 0.03% | 0.03% |  |
| B | 7977 | 7894 | 5 | 5 | 0.06% | 0.06% |  |
| C | 7977 | 7894 | 0 | 0 | 0.00% | 0.00% | 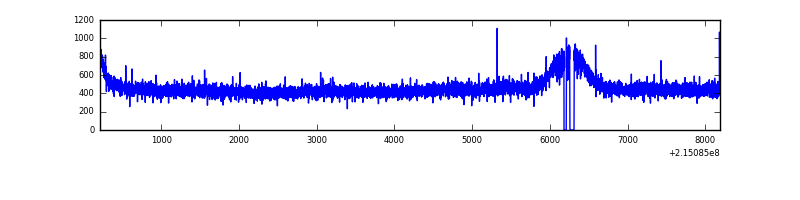 |
| D | 7977 | 7894 | 6 | 6 | 0.08% | 0.08% |  |
Top three noisy pixels from each quadrant. If the there are fewer than three noisy pixels in the level2.evt file, extra rows are filled as -1
| Pixel properties | Quadrant properties | ||||||
|---|---|---|---|---|---|---|---|
| Quadrant | DetID | PixID | Counts | Sigma | Mean | Median | Sigma |
| A | 15 | 236 | 43695 | 222.29 | 932 | 909 | 192.5 |
| A | 4 | 2 | 38389 | 194.72 | 932 | 909 | 192.5 |
| A | 12 | 194 | 9036 | 42.22 | 932 | 909 | 192.5 |
| B | 15 | 204 | 109335 | 596.55 | 944 | 917 | 181.7 |
| B | 4 | 81 | 35728 | 191.54 | 944 | 917 | 181.7 |
| B | 12 | 111 | 17987 | 93.92 | 944 | 917 | 181.7 |
| C | 14 | 67 | 12504 | 55.1 | 910 | 912 | 210.4 |
| C | 9 | 16 | 7593 | 31.76 | 910 | 912 | 210.4 |
| C | 13 | 61 | 7516 | 31.39 | 910 | 912 | 210.4 |
| D | 1 | 239 | 106021 | 476.29 | 905 | 875 | 220.8 |
| D | 2 | 63 | 37640 | 166.54 | 905 | 875 | 220.8 |
| D | 8 | 195 | 35699 | 157.74 | 905 | 875 | 220.8 |
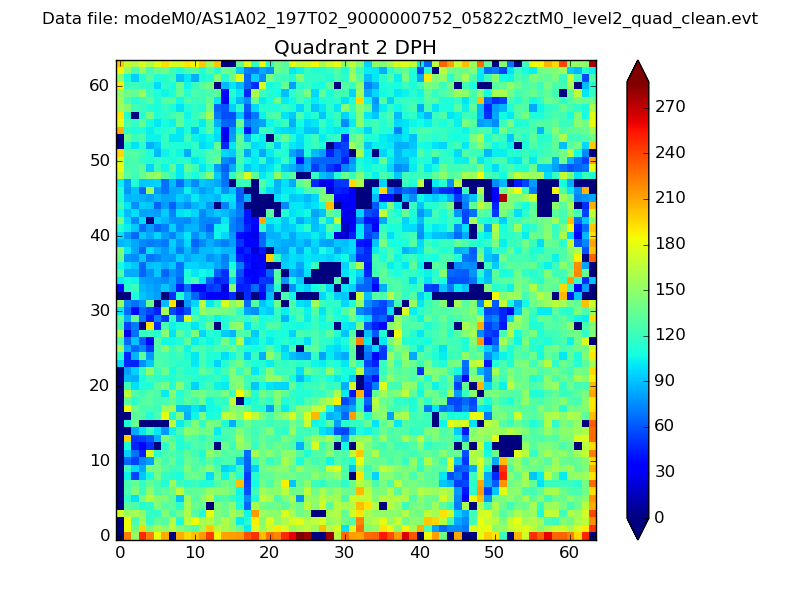
Histogram calculated using DETX and DETY for each event in the final _common_clean file
| Quadrant A | 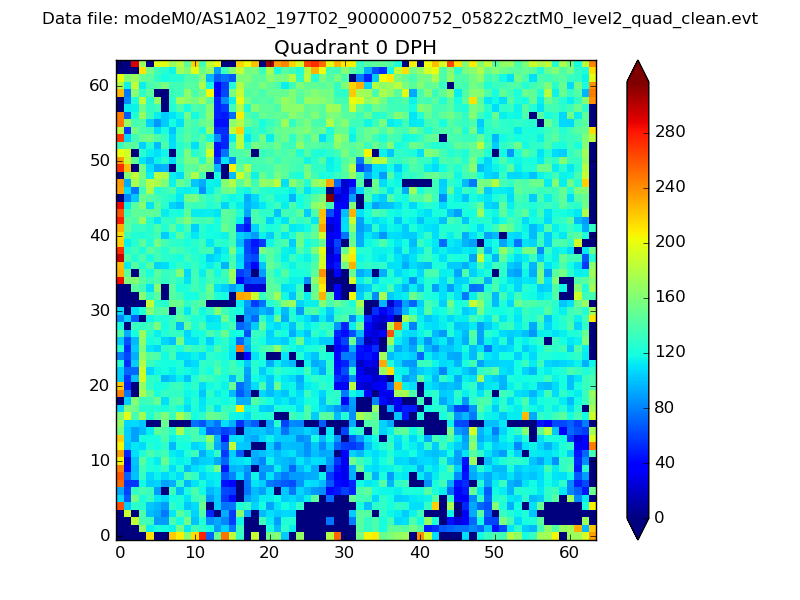 |
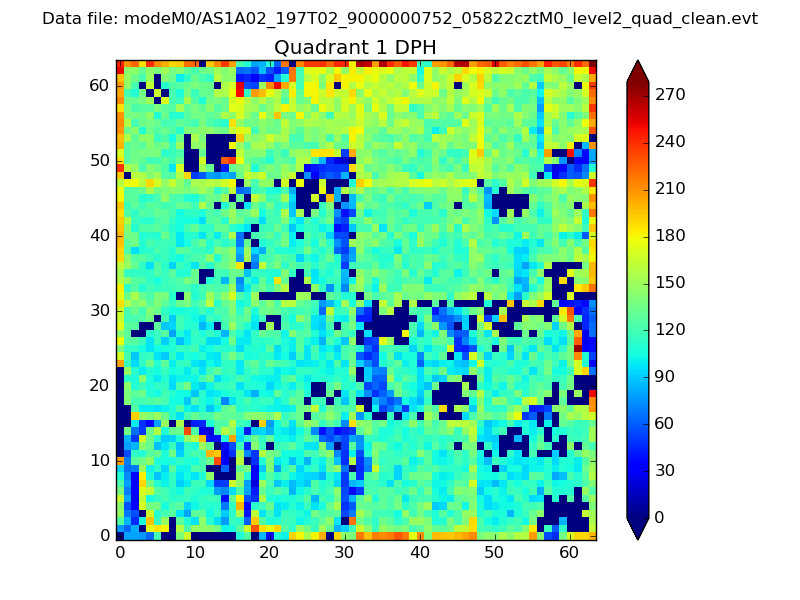 |
Quadrant B |
|---|---|---|---|
| Quadrant D | 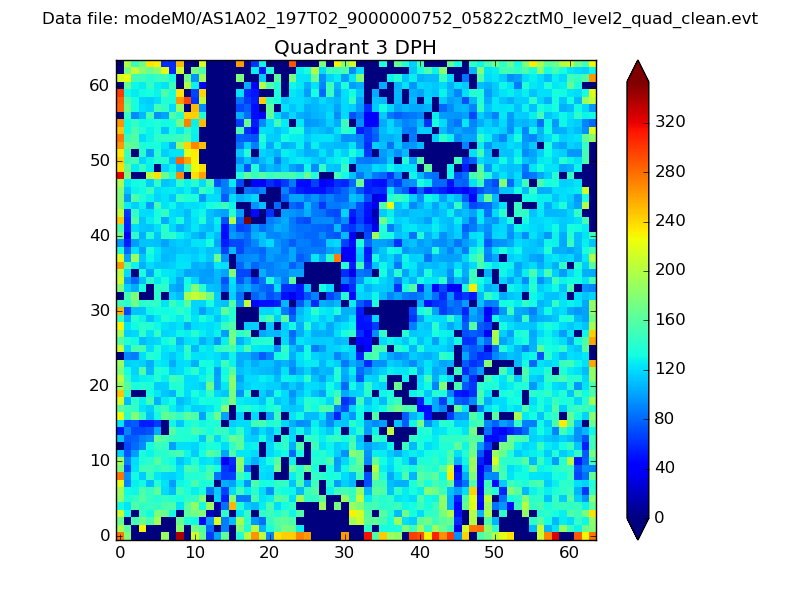 |
 |
Quadrant C |
| Plot type | Count rate plots | Images |
|---|---|---|
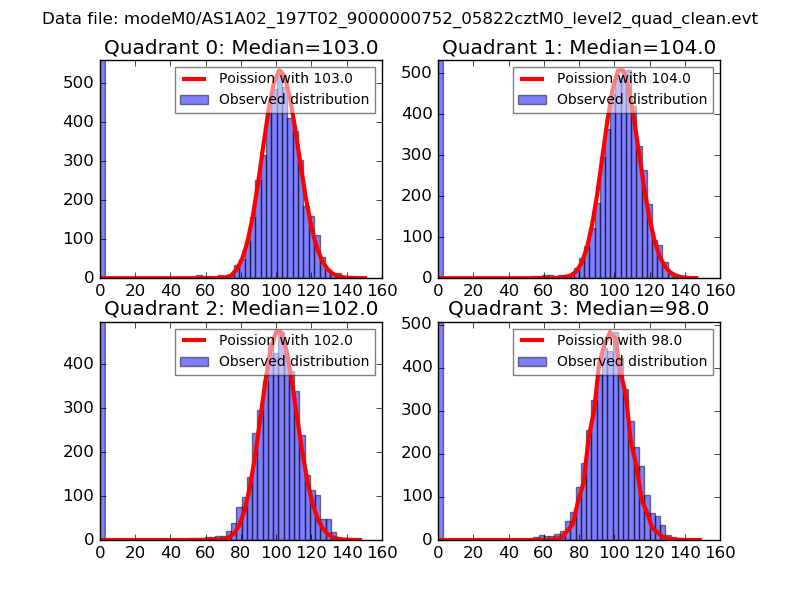
| Comparison with Poisson distribution Blue bars denote a histogram of data divided into 1 sec bins. Red curve is a Poisson curve with rate = median count rate of data. |
 |
 |
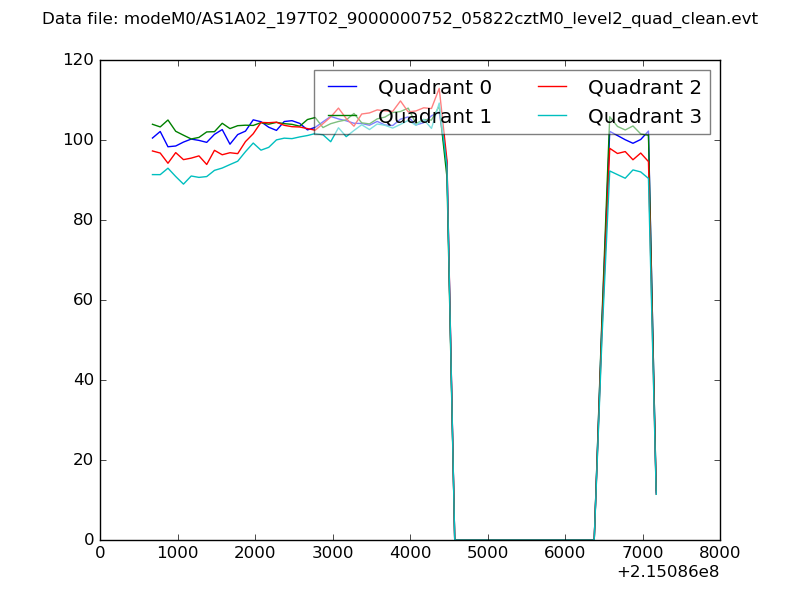
| Quadrant-wise count rates Data is divided into 100 sec bins |
 |
|
| Module-wise count rates for Quadrant A Data is divided into 100 sec bins |
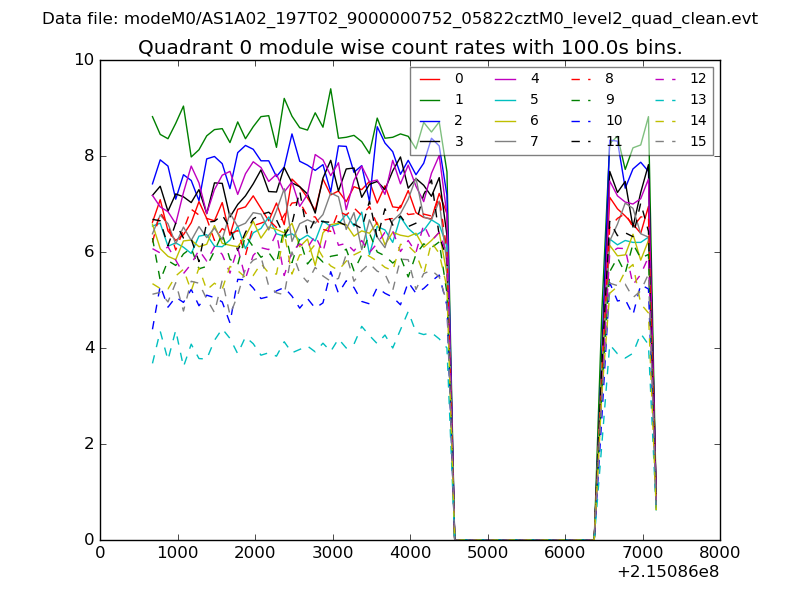 |
 |
| Module-wise count rates for Quadrant B Data is divided into 100 sec bins |
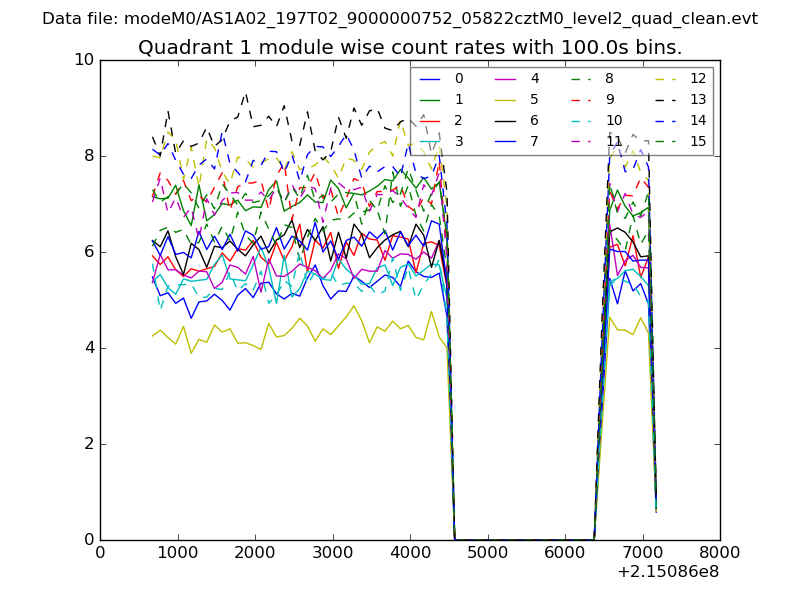 |
 |
| Module-wise count rates for Quadrant C Data is divided into 100 sec bins |
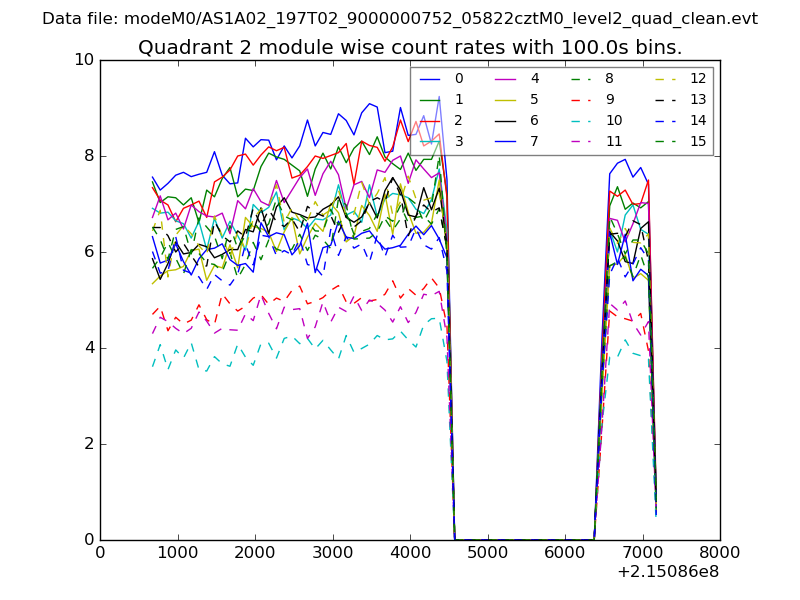 |
 |
| Module-wise count rates for Quadrant D Data is divided into 100 sec bins |
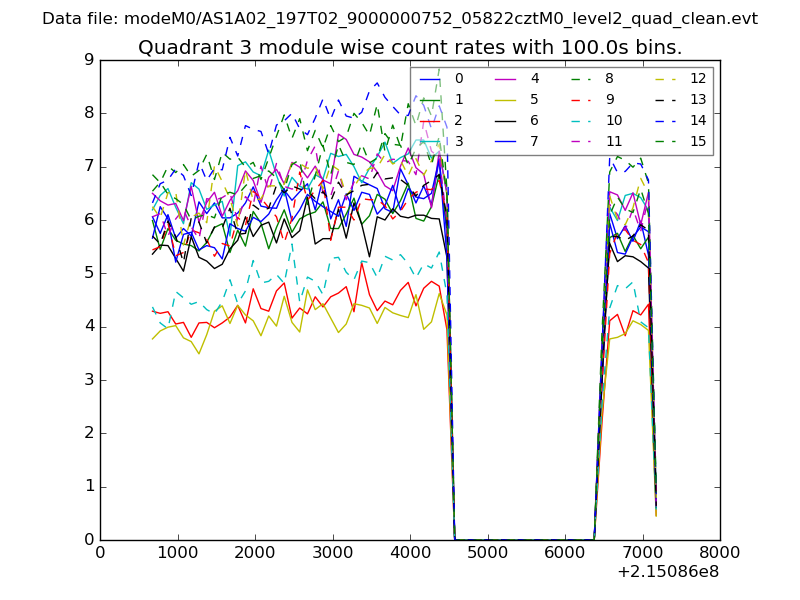 |
 |
| Parameter | Plot |
|---|---|
| CZT HV Monitor | 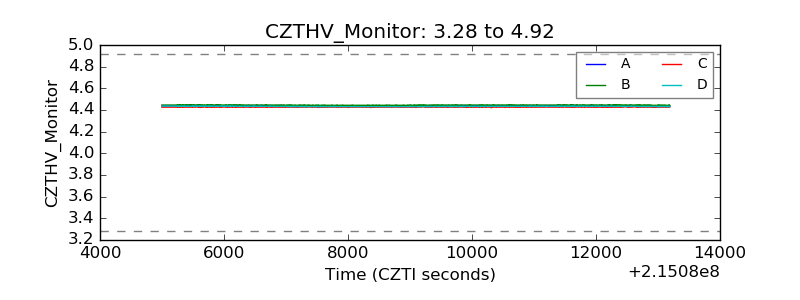 |
| D_VDD | 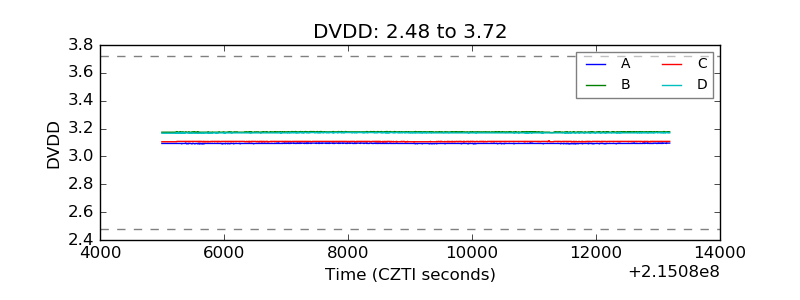 |
| Temperature 1 | 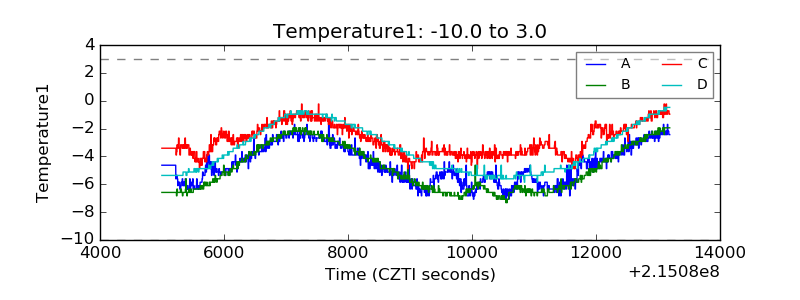 |
| Veto HV Monitor | 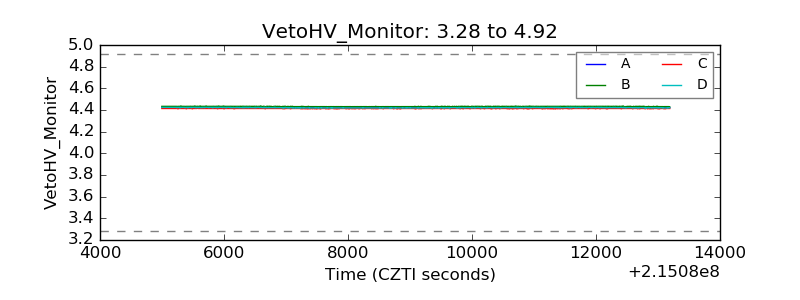 |
| Veto LLD | 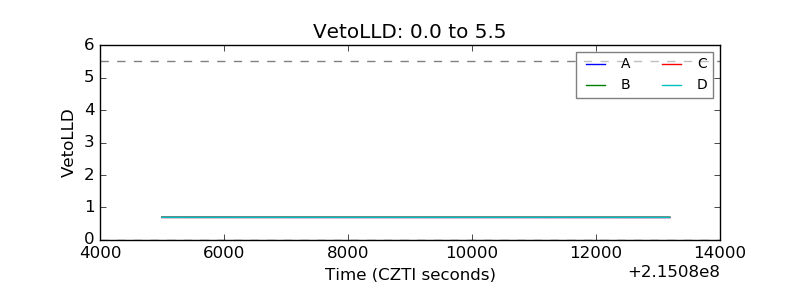 |
| Alpha Counter | 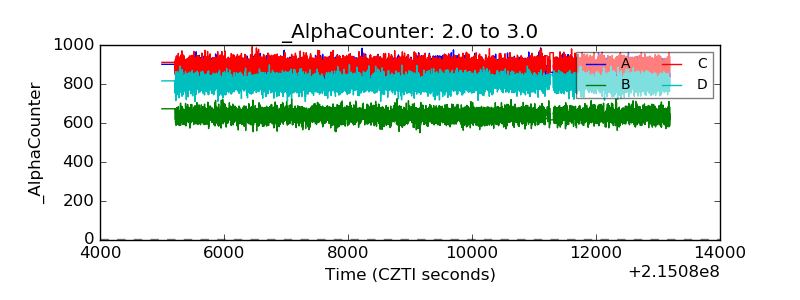 |
| _CPM_Rate | 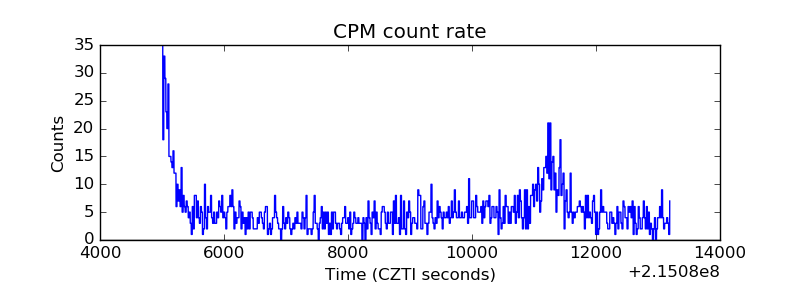 |
| CZT Counter | 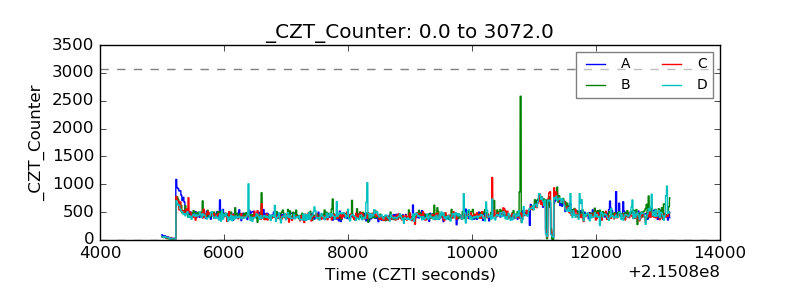 |
| +2.5 Volts monitor |  |
| +5 Volts monitor |  |
| _ROLL_ROT | 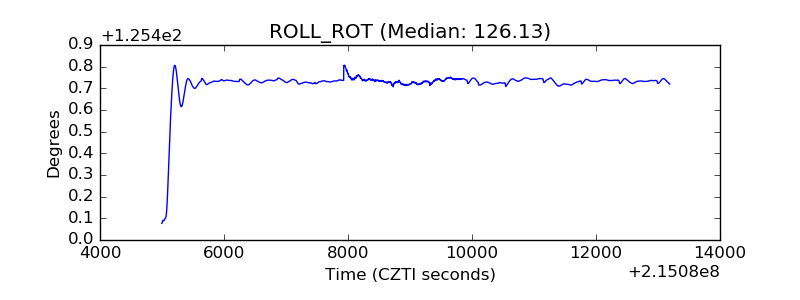 |
| _Roll_DEC | 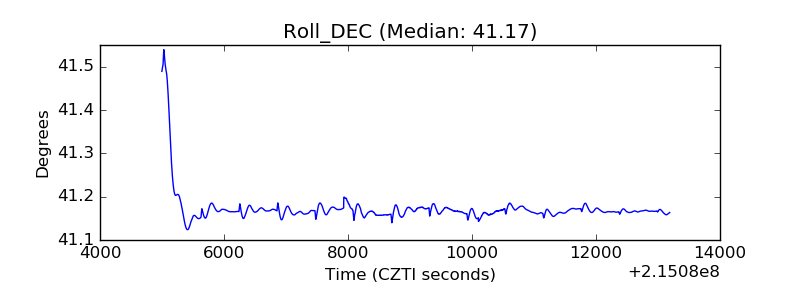 |
| _Roll_RA | 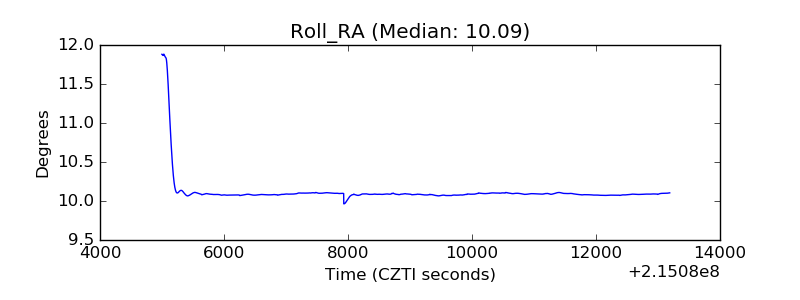 |
| Veto Counter | 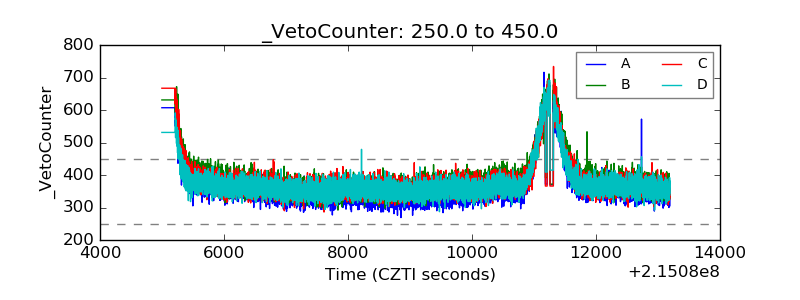 |