| Param | Original file | Final file |
|---|---|---|
| Filename | modeM0/AS1A02_197T02_9000000752_05823cztM0_level2.evt | modeM0/AS1A02_197T02_9000000752_05823cztM0_level2_quad_clean.evt |
| Size (bytes) | 483,373,440 | 80,147,520 |
| Size | 461.0 MB | 76.4 MB |
| Events in quadrant A | 3,484,150 | 481,702 |
| Events in quadrant B | 3,607,301 | 487,745 |
| Events in quadrant C | 3,381,435 | 475,176 |
| Events in quadrant D | 3,651,679 | 455,998 |
| Mode SS | |||
|---|---|---|---|
| Quadrant | BADHDUFLAG | Total packets | Discarded packets |
| A | 0 | 154 | 0 |
| B | 0 | 154 | 2 |
| C | 0 | 154 | 2 |
| D | 0 | 154 | 4 |
| Mode M0 | |||
|---|---|---|---|
| Quadrant | BADHDUFLAG | Total packets | Discarded packets |
| A | 0 | 16010 | 344 |
| B | 0 | 16132 | 329 |
| C | 0 | 15856 | 334 |
| D | 0 | 16769 | 382 |
| Quadrant | Total seconds | Saturated seconds | Saturation percentage |
|---|---|---|---|
| A | 7557 | 111 | 1.468837% |
| B | 7567 | 95 | 1.255451% |
| C | 7559 | 63 | 0.833444% |
| D | 7551 | 81 | 1.072706% |
Noise dominated data is calculated using 1-second bins in cleaned event files. If a bin has >2000 counts, and if more than 50% of those come from <1% of pixels, then it is considered to be noise-dominated and hence unusable.
| Quadrant | # 1 sec bins | Bins with >0 counts | Bins with >2000 counts | High rate bins dominated by noise | Noise dominated (total time) | Noise dominated (detector-on time) | Marked lightcurve |
|---|---|---|---|---|---|---|---|
| A | 7726 | 7695 | 1 | 1 | 0.01% | 0.01% | 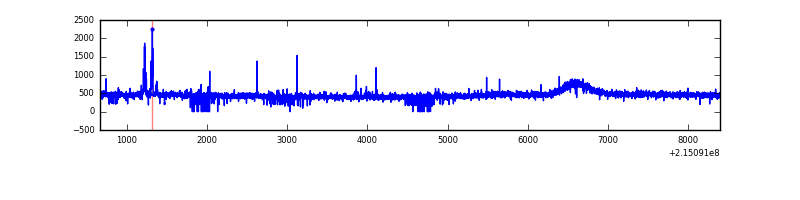 |
| B | 7727 | 7704 | 0 | 0 | 0.00% | 0.00% | 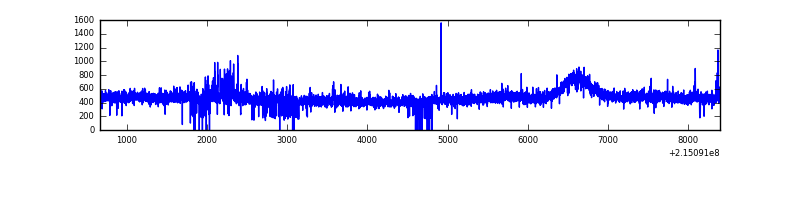 |
| C | 7727 | 7712 | 0 | 0 | 0.00% | 0.00% | 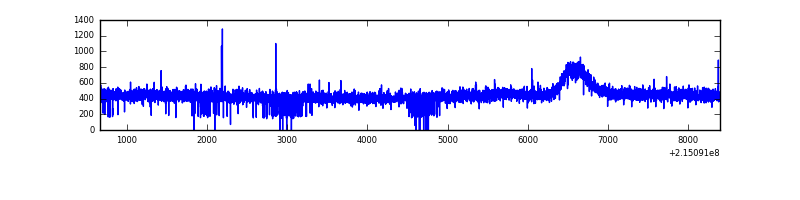 |
| D | 7727 | 7707 | 26 | 26 | 0.34% | 0.34% | 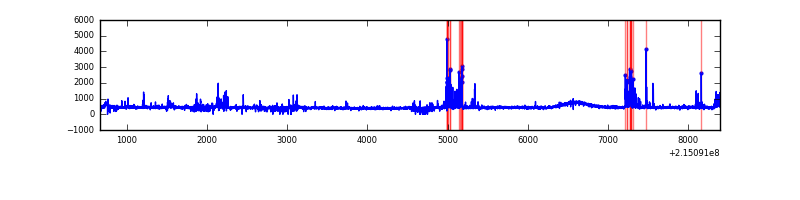 |
Top three noisy pixels from each quadrant. If the there are fewer than three noisy pixels in the level2.evt file, extra rows are filled as -1
| Pixel properties | Quadrant properties | ||||||
|---|---|---|---|---|---|---|---|
| Quadrant | DetID | PixID | Counts | Sigma | Mean | Median | Sigma |
| A | 4 | 2 | 37745 | 203.41 | 886 | 865 | 181.3 |
| A | 15 | 223 | 20082 | 105.99 | 886 | 865 | 181.3 |
| A | 0 | 226 | 8595 | 42.63 | 886 | 865 | 181.3 |
| B | 15 | 204 | 134951 | 784.61 | 896 | 873 | 170.9 |
| B | 12 | 111 | 16769 | 93.02 | 896 | 873 | 170.9 |
| B | 11 | 111 | 13142 | 71.8 | 896 | 873 | 170.9 |
| C | 9 | 16 | 8134 | 36.43 | 862 | 864 | 199.6 |
| C | 13 | 61 | 6991 | 30.7 | 862 | 864 | 199.6 |
| C | 8 | 222 | 5192 | 21.69 | 862 | 864 | 199.6 |
| D | 12 | 233 | 210979 | 1001.14 | 858 | 831 | 209.9 |
| D | 1 | 239 | 68801 | 323.81 | 858 | 831 | 209.9 |
| D | 13 | 172 | 57000 | 267.59 | 858 | 831 | 209.9 |
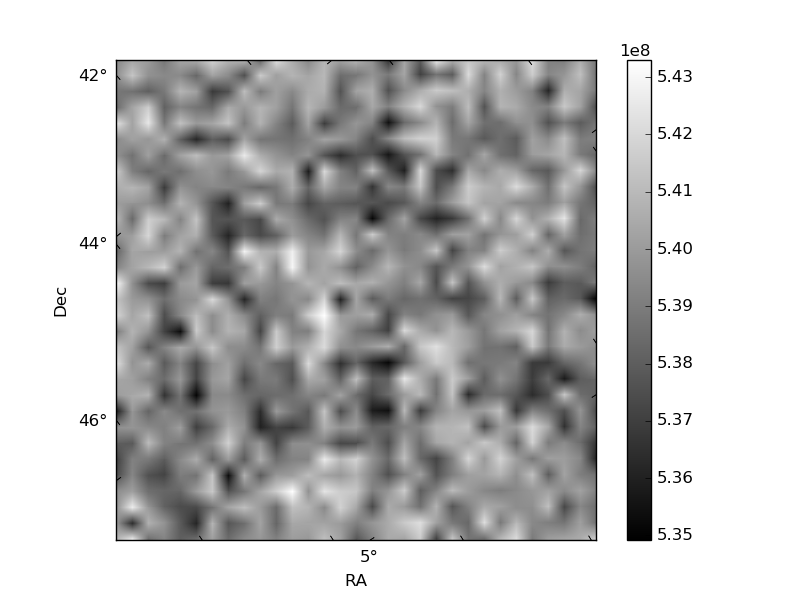
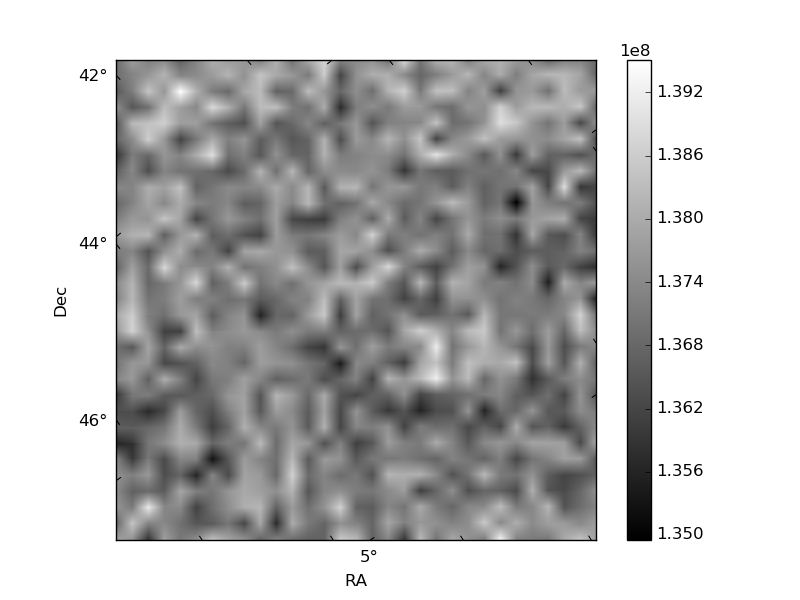
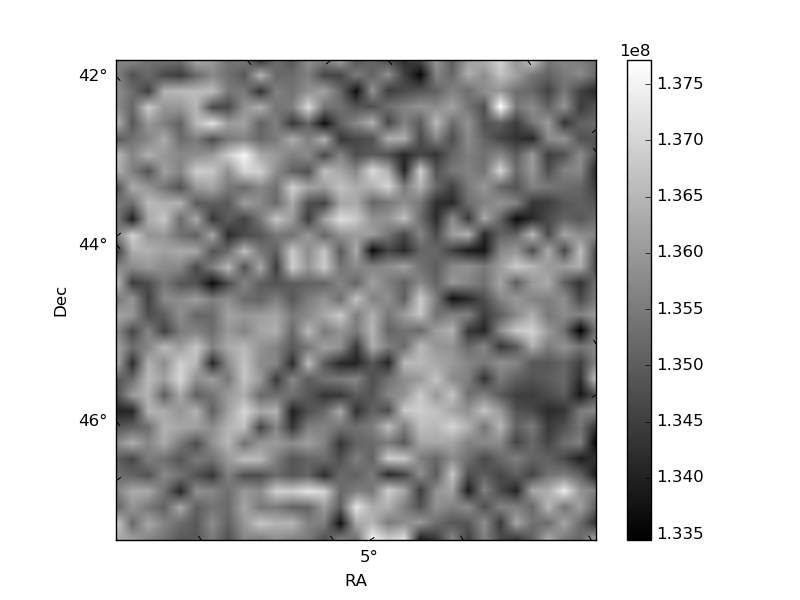
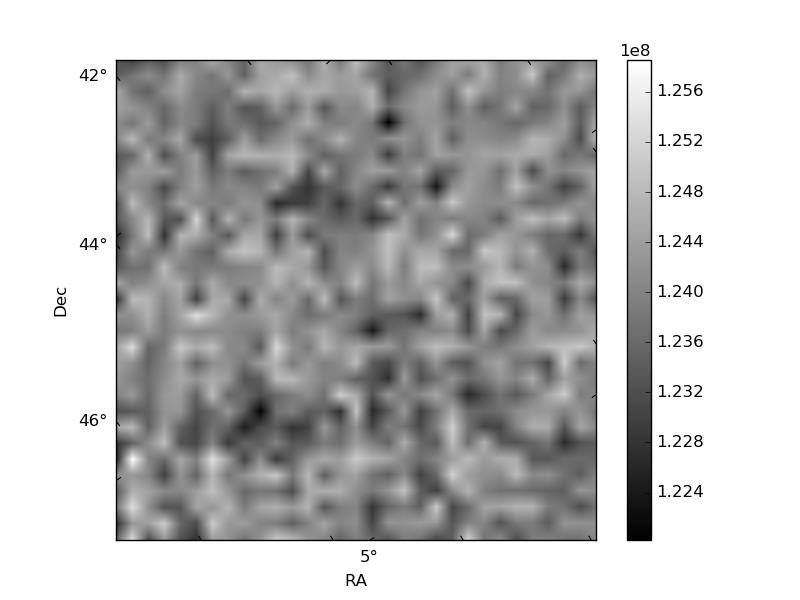
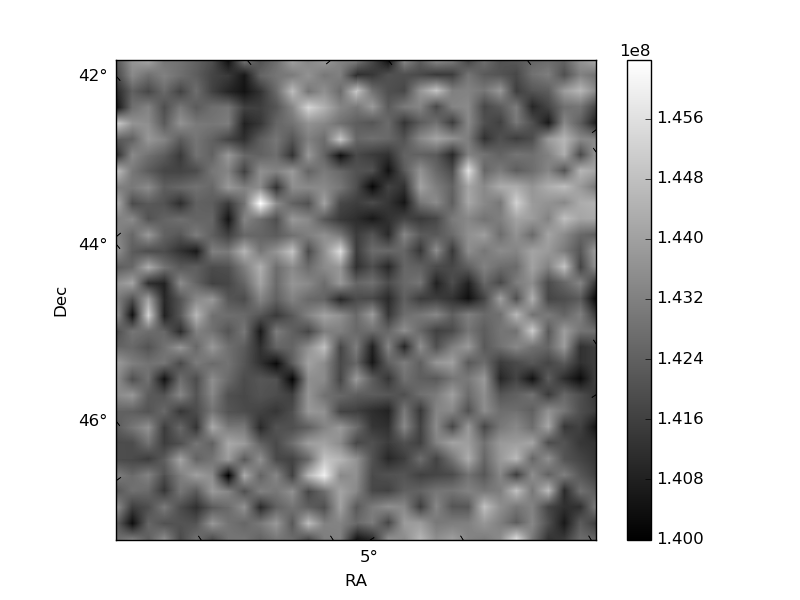
Histogram calculated using DETX and DETY for each event in the final _common_clean file
| Quadrant A | 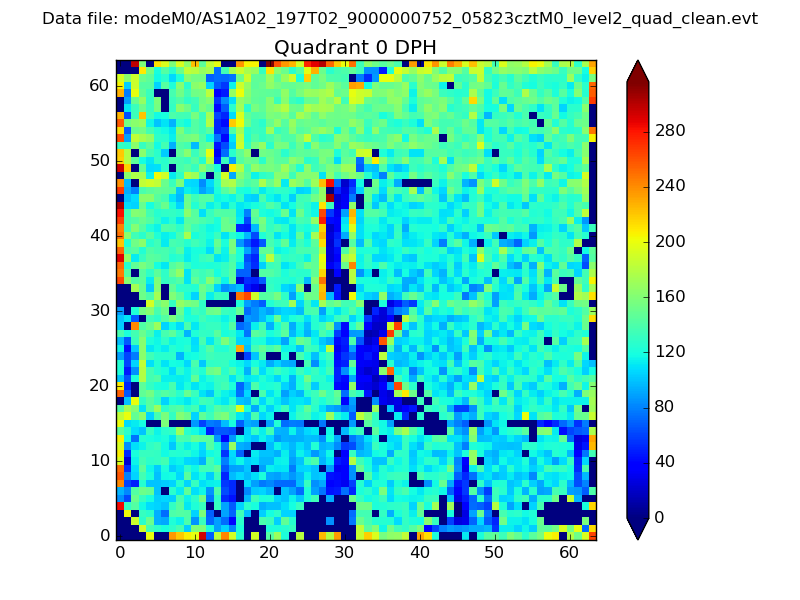 |
 |
Quadrant B |
|---|---|---|---|
| Quadrant D | 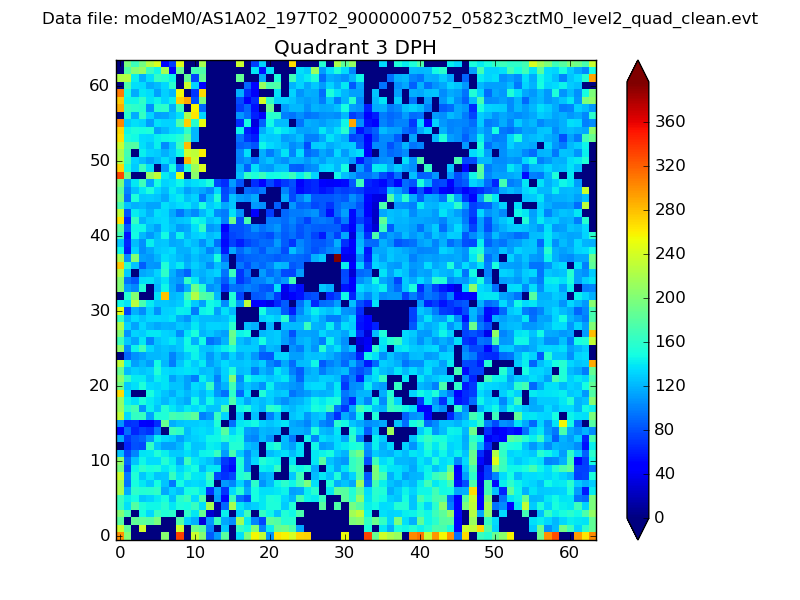 |
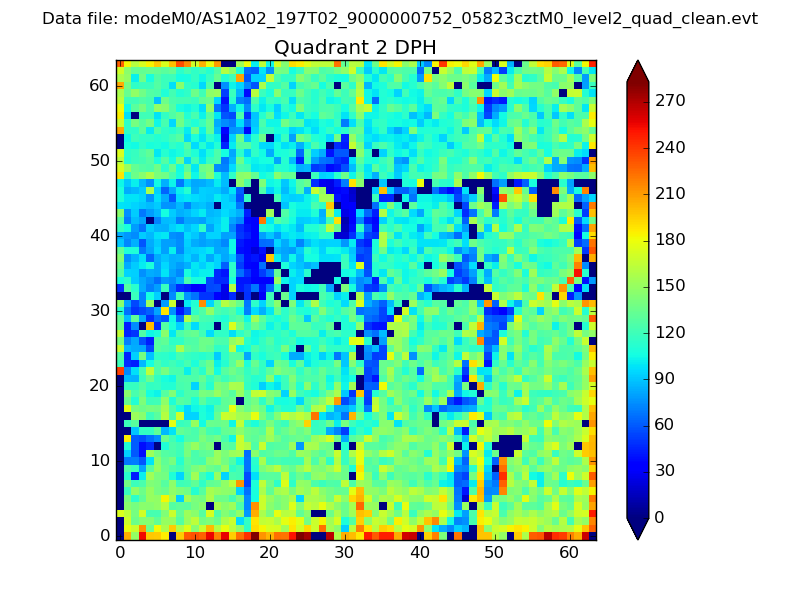 |
Quadrant C |
| Plot type | Count rate plots | Images |
|---|---|---|
| Comparison with Poisson distribution Blue bars denote a histogram of data divided into 1 sec bins. Red curve is a Poisson curve with rate = median count rate of data. |
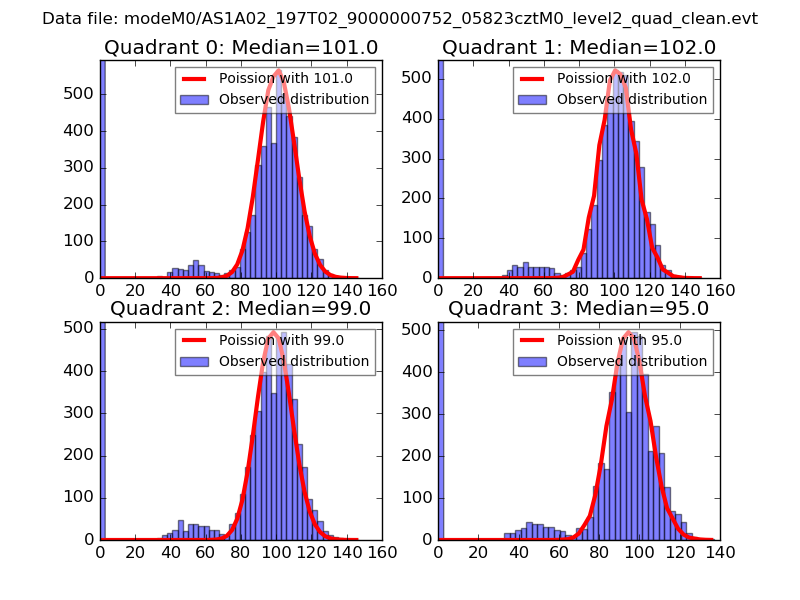 |
 |
| Quadrant-wise count rates Data is divided into 100 sec bins |
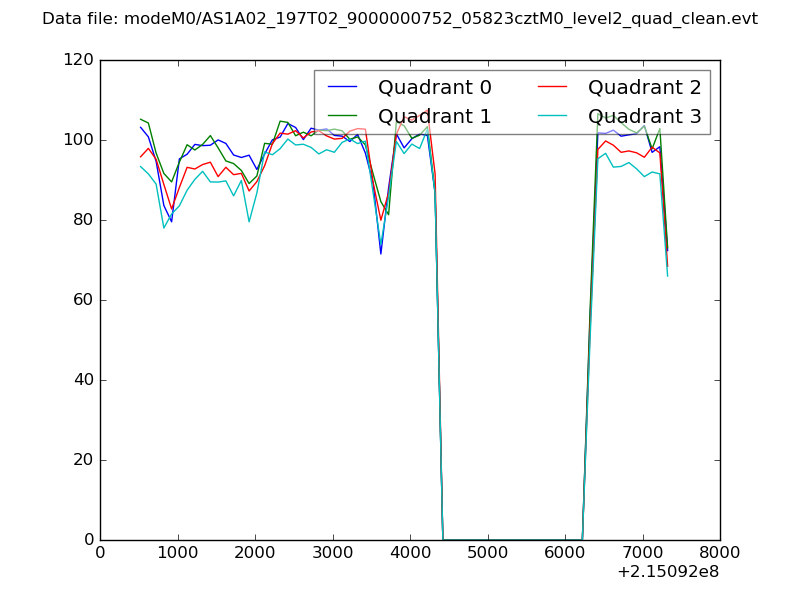 |
|
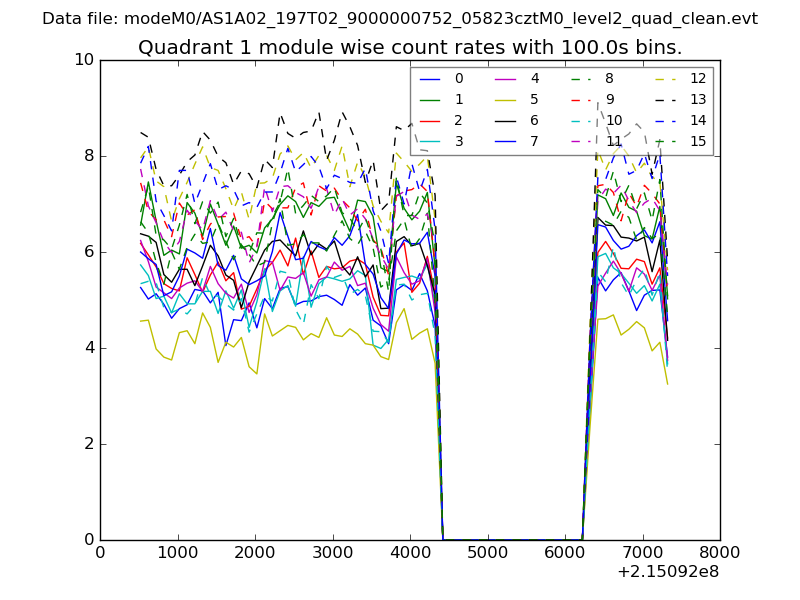
| Module-wise count rates for Quadrant A Data is divided into 100 sec bins |
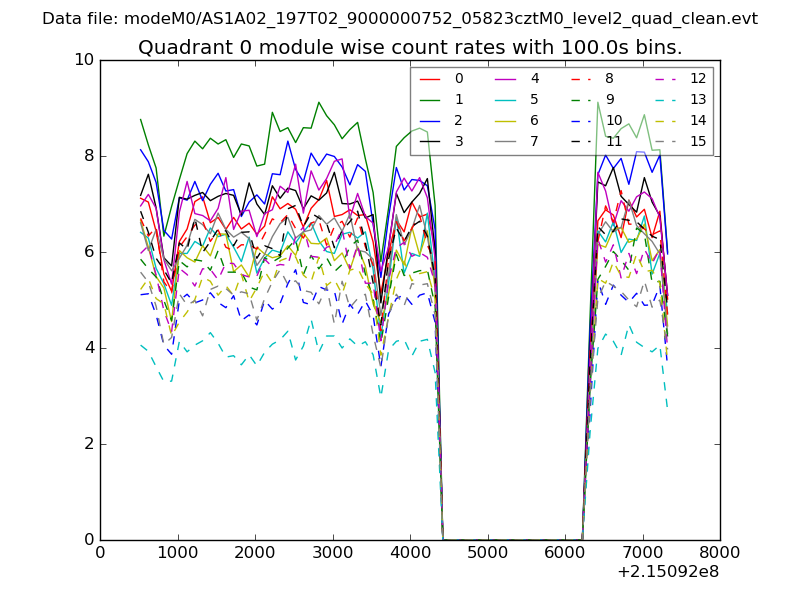 |
 |
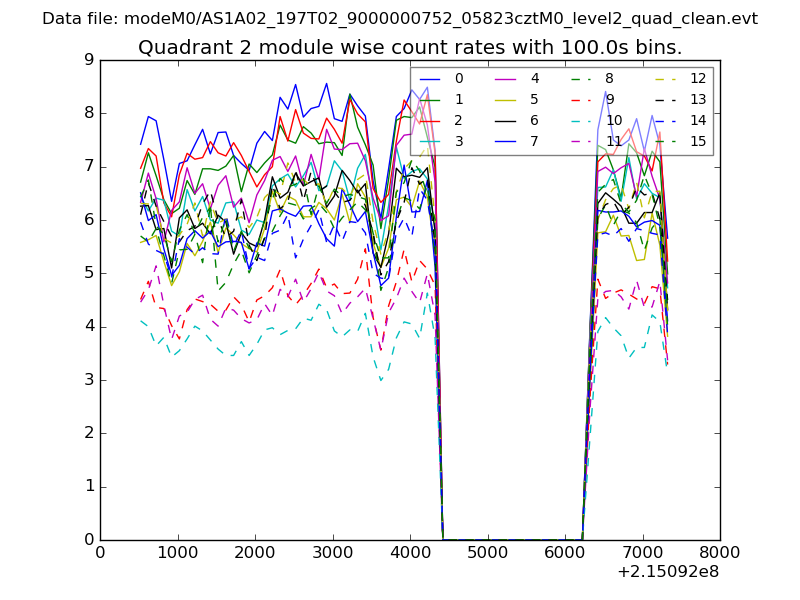
| Module-wise count rates for Quadrant B Data is divided into 100 sec bins |
 |
 |
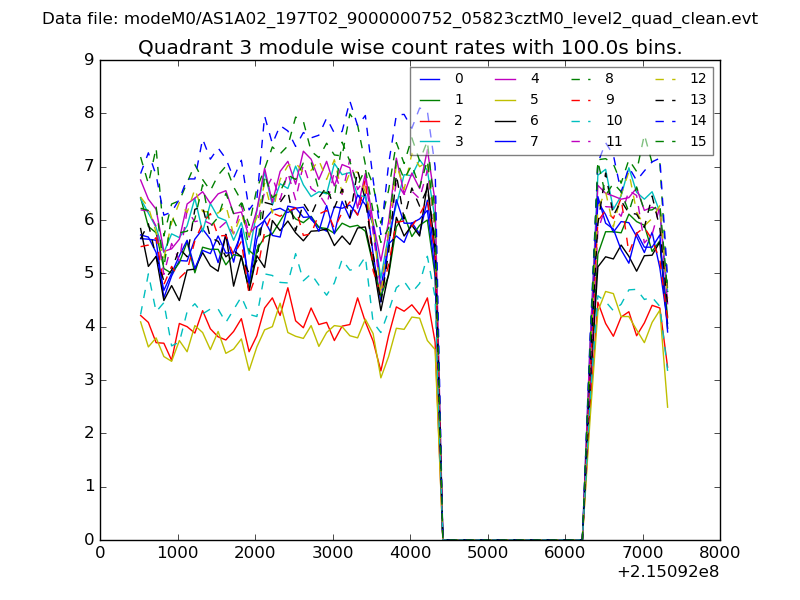
| Module-wise count rates for Quadrant C Data is divided into 100 sec bins |
 |
 |
| Module-wise count rates for Quadrant D Data is divided into 100 sec bins |
 |
 |
| Parameter | Plot |
|---|---|
| CZT HV Monitor | 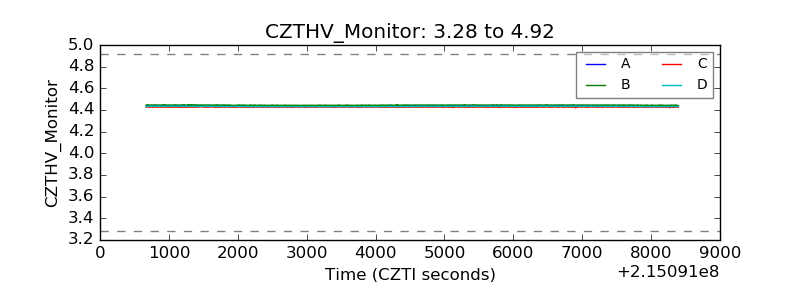 |
| D_VDD |  |
| Temperature 1 | 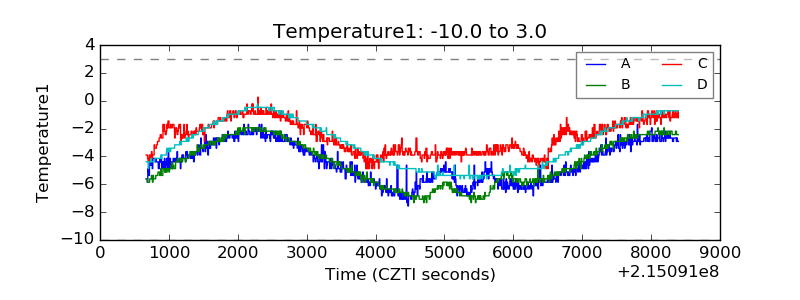 |
| Veto HV Monitor | 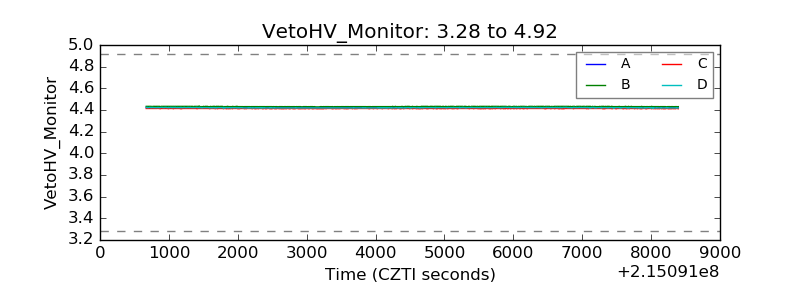 |
| Veto LLD | 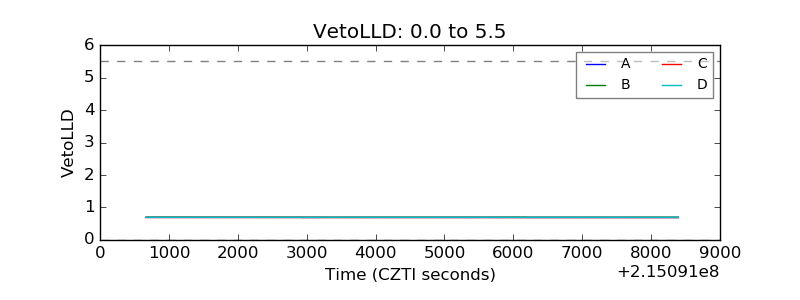 |
| Alpha Counter | 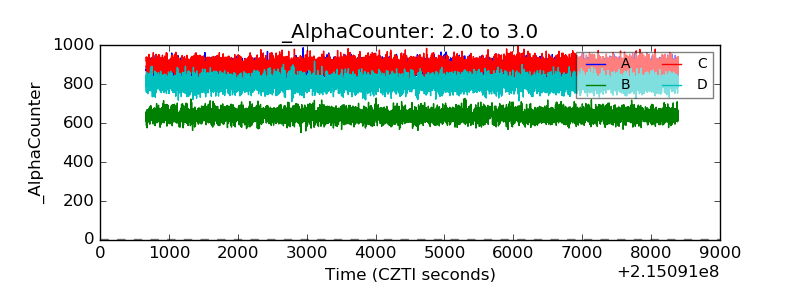 |
| _CPM_Rate | 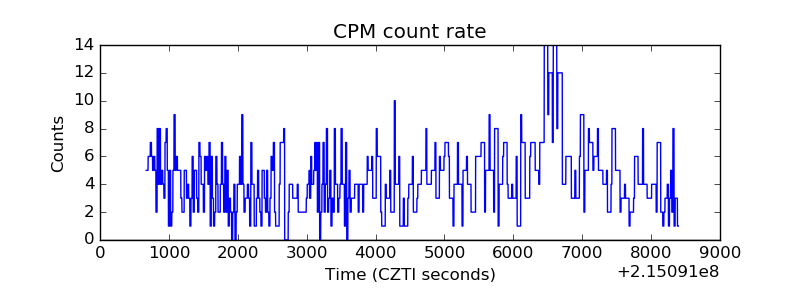 |
| CZT Counter | 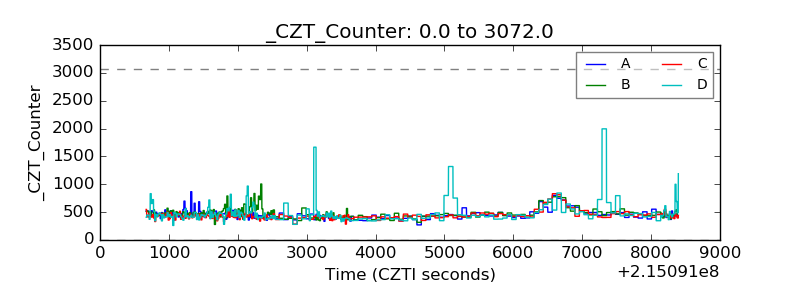 |
| +2.5 Volts monitor |  |
| +5 Volts monitor |  |
| _ROLL_ROT | 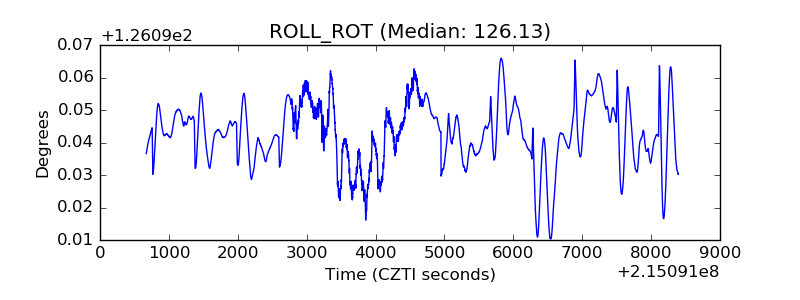 |
| _Roll_DEC | 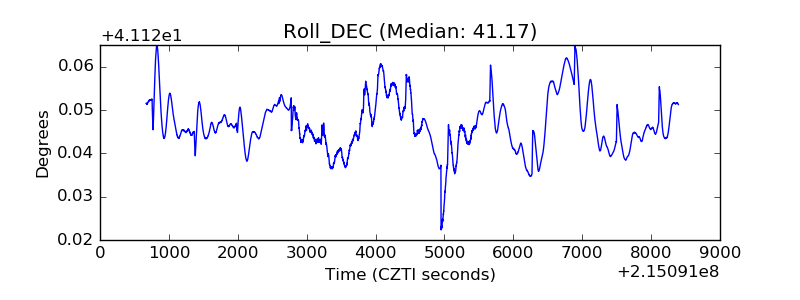 |
| _Roll_RA | 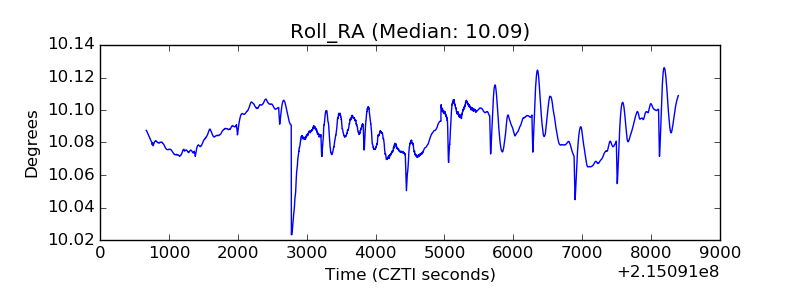 |
| Veto Counter | 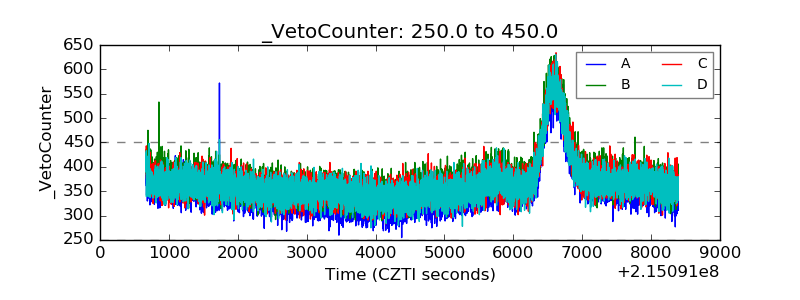 |