| Param | Original file | Final file |
|---|---|---|
| Filename | modeM0/AS1A02_197T02_9000000752_05824cztM0_level2.evt | modeM0/AS1A02_197T02_9000000752_05824cztM0_level2_quad_clean.evt |
| Size (bytes) | 211,504,320 | 33,206,400 |
| Size | 201.7 MB | 31.7 MB |
| Events in quadrant A | 1,508,215 | 199,172 |
| Events in quadrant B | 1,558,837 | 203,147 |
| Events in quadrant C | 1,489,458 | 194,598 |
| Events in quadrant D | 1,635,219 | 186,443 |
| Mode SS | |||
|---|---|---|---|
| Quadrant | BADHDUFLAG | Total packets | Discarded packets |
| A | 0 | 62 | 0 |
| B | 0 | 62 | 0 |
| C | 0 | 62 | 4 |
| D | 0 | 62 | 0 |
| Mode M0 | |||
|---|---|---|---|
| Quadrant | BADHDUFLAG | Total packets | Discarded packets |
| A | 0 | 6701 | 58 |
| B | 0 | 6771 | 63 |
| C | 0 | 6692 | 47 |
| D | 0 | 7162 | 65 |
| Quadrant | Total seconds | Saturated seconds | Saturation percentage |
|---|---|---|---|
| A | 3119 | 104 | 3.334402% |
| B | 3118 | 89 | 2.854394% |
| C | 3124 | 62 | 1.984635% |
| D | 3117 | 69 | 2.213667% |
Noise dominated data is calculated using 1-second bins in cleaned event files. If a bin has >2000 counts, and if more than 50% of those come from <1% of pixels, then it is considered to be noise-dominated and hence unusable.
| Quadrant | # 1 sec bins | Bins with >0 counts | Bins with >2000 counts | High rate bins dominated by noise | Noise dominated (total time) | Noise dominated (detector-on time) | Marked lightcurve |
|---|---|---|---|---|---|---|---|
| A | 3147 | 3143 | 0 | 0 | 0.00% | 0.00% | 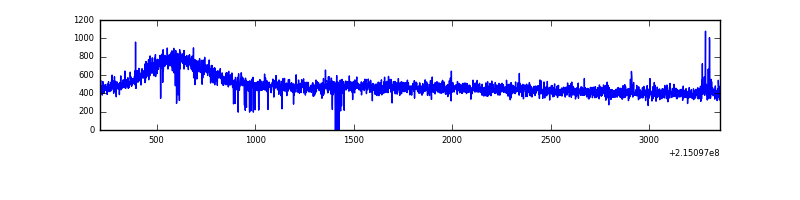 |
| B | 3147 | 3146 | 0 | 0 | 0.00% | 0.00% | 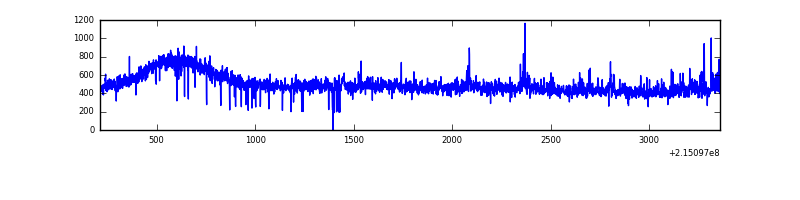 |
| C | 3147 | 3144 | 0 | 0 | 0.00% | 0.00% | 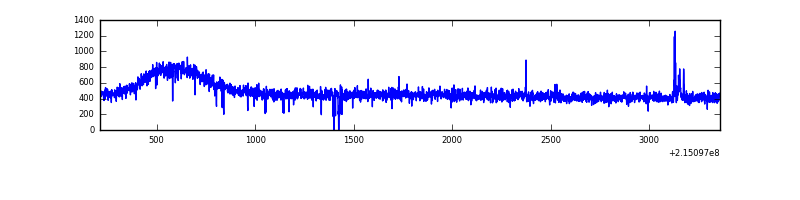 |
| D | 3147 | 3144 | 14 | 14 | 0.44% | 0.45% | 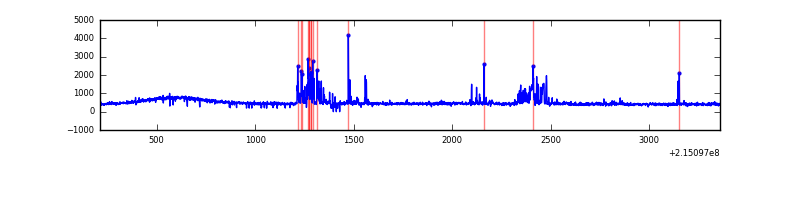 |
Top three noisy pixels from each quadrant. If the there are fewer than three noisy pixels in the level2.evt file, extra rows are filled as -1
| Pixel properties | Quadrant properties | ||||||
|---|---|---|---|---|---|---|---|
| Quadrant | DetID | PixID | Counts | Sigma | Mean | Median | Sigma |
| A | 15 | 223 | 7260 | 84.43 | 388 | 378 | 81.5 |
| A | 13 | 210 | 4615 | 51.98 | 388 | 378 | 81.5 |
| A | 0 | 226 | 3739 | 41.23 | 388 | 378 | 81.5 |
| B | 15 | 204 | 47868 | 615.56 | 389 | 379 | 77.1 |
| B | 12 | 111 | 7214 | 88.6 | 389 | 379 | 77.1 |
| B | 11 | 111 | 5741 | 69.5 | 389 | 379 | 77.1 |
| C | 1 | 16 | 6326 | 66.63 | 378 | 378 | 89.3 |
| C | 9 | 16 | 3315 | 32.9 | 378 | 378 | 89.3 |
| C | 13 | 61 | 3106 | 30.56 | 378 | 378 | 89.3 |
| D | 12 | 233 | 88129 | 929.46 | 380 | 365 | 94.4 |
| D | 13 | 172 | 82532 | 870.18 | 380 | 365 | 94.4 |
| D | 8 | 195 | 8670 | 87.95 | 380 | 365 | 94.4 |
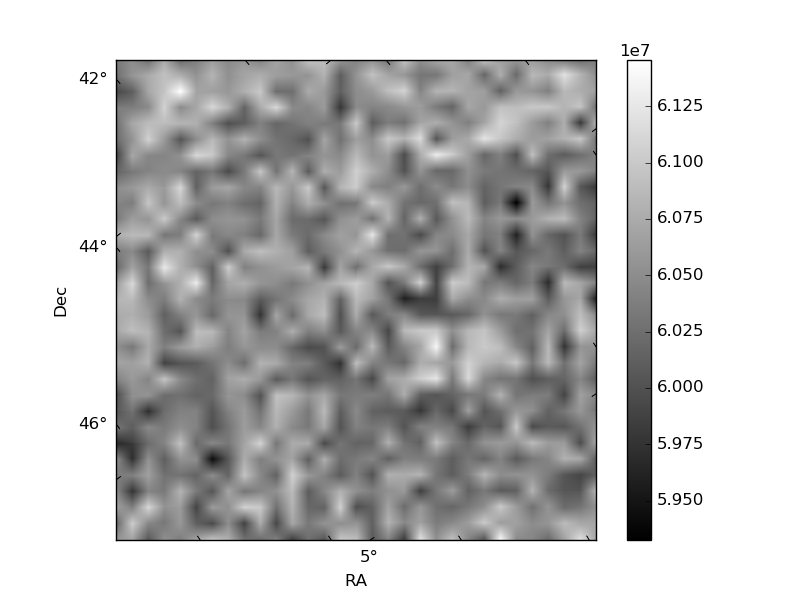
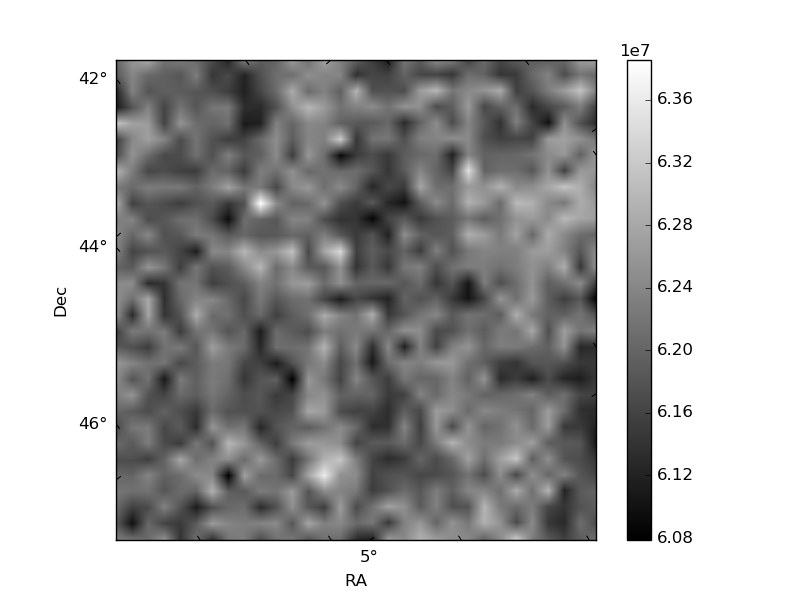
Histogram calculated using DETX and DETY for each event in the final _common_clean file
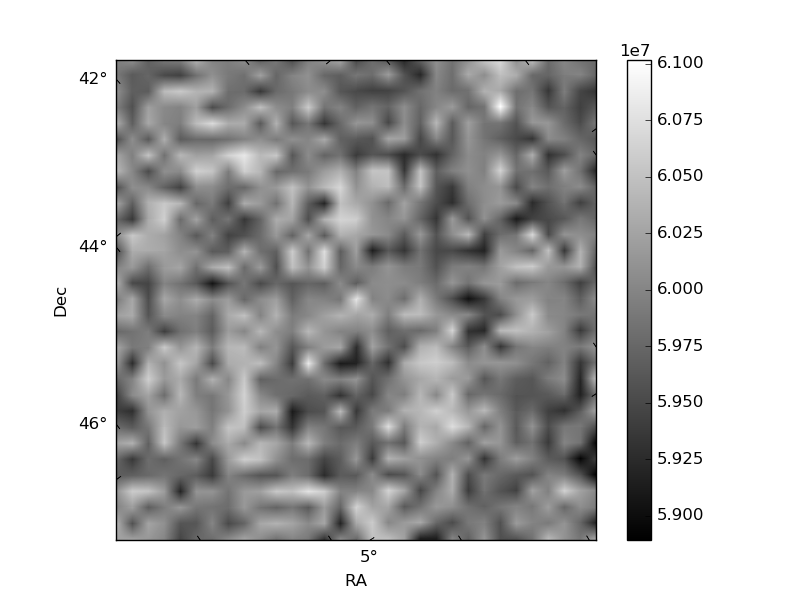
| Quadrant A | 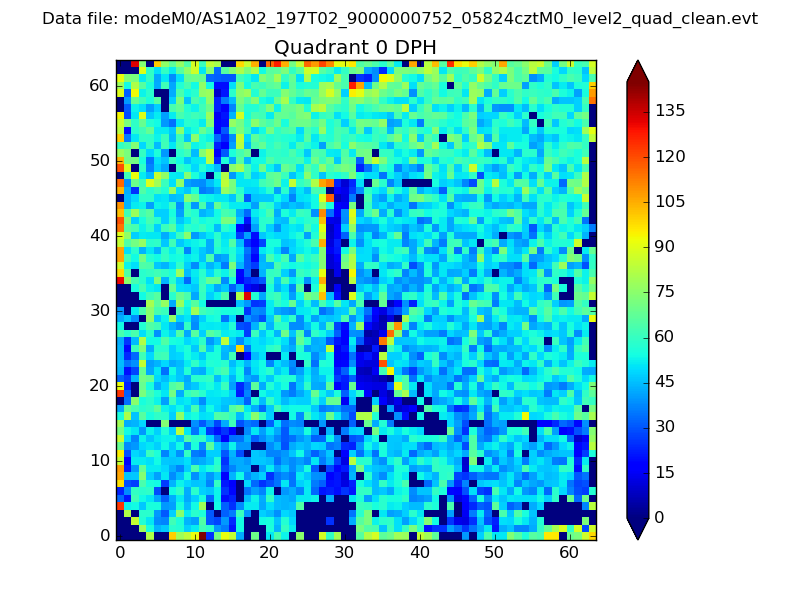 |
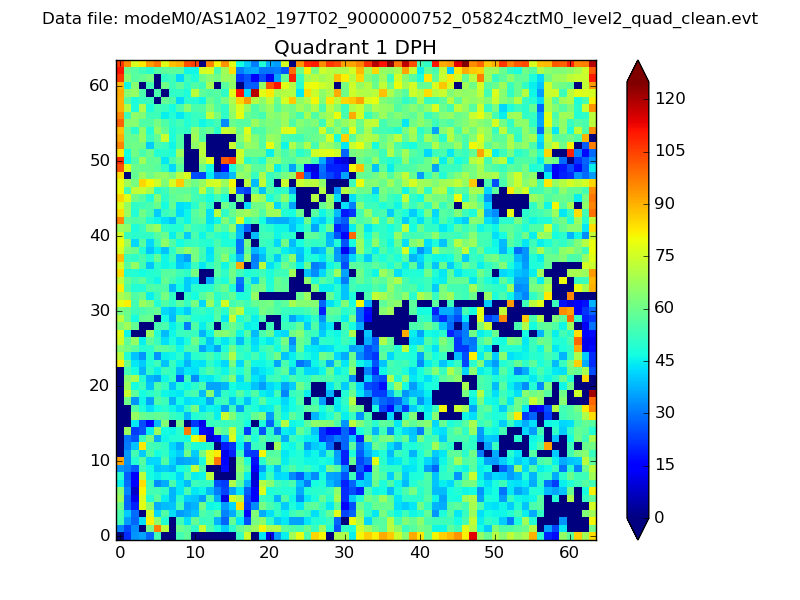 |
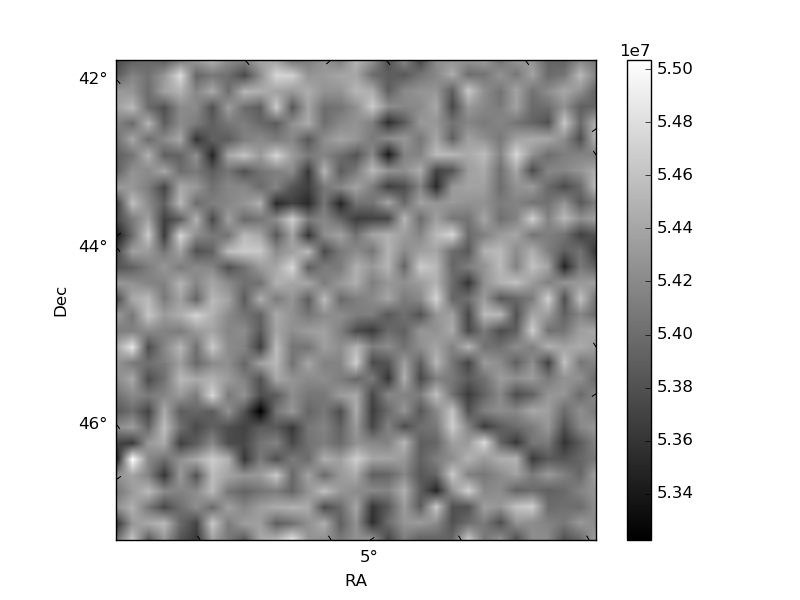
Quadrant B |
|---|---|---|---|
| Quadrant D | 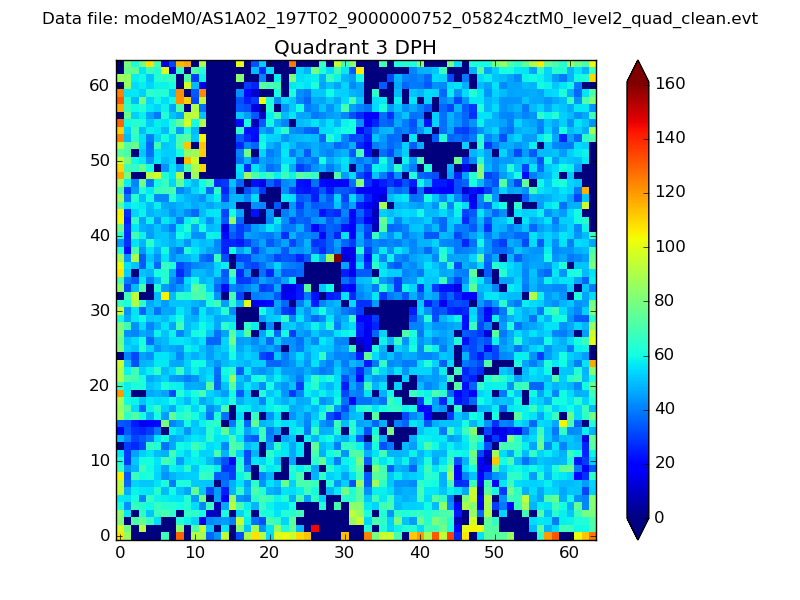 |
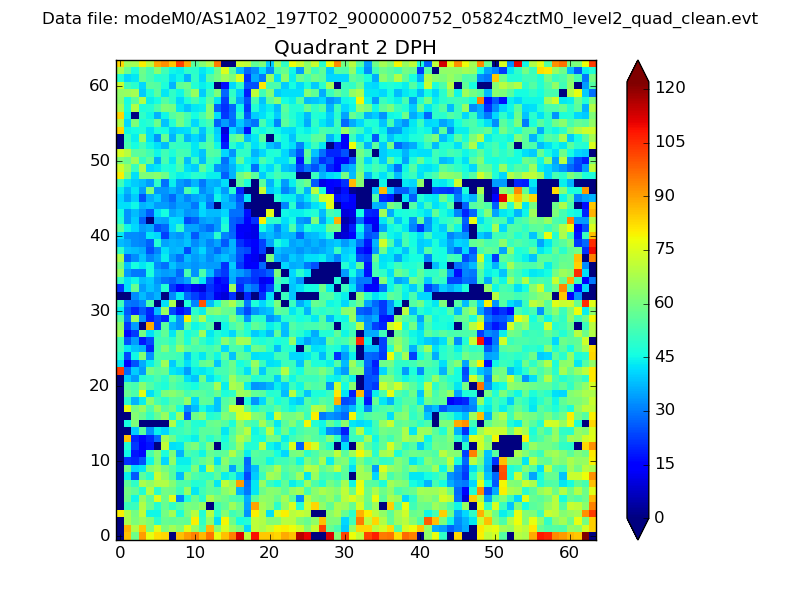 |
Quadrant C |
| Plot type | Count rate plots | Images |
|---|---|---|
| Comparison with Poisson distribution Blue bars denote a histogram of data divided into 1 sec bins. Red curve is a Poisson curve with rate = median count rate of data. |
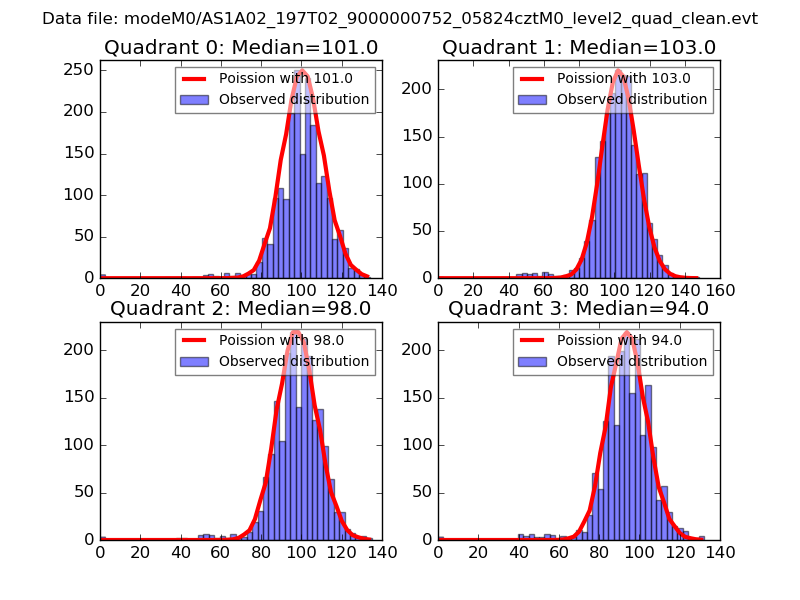 |
 |
| Quadrant-wise count rates Data is divided into 100 sec bins |
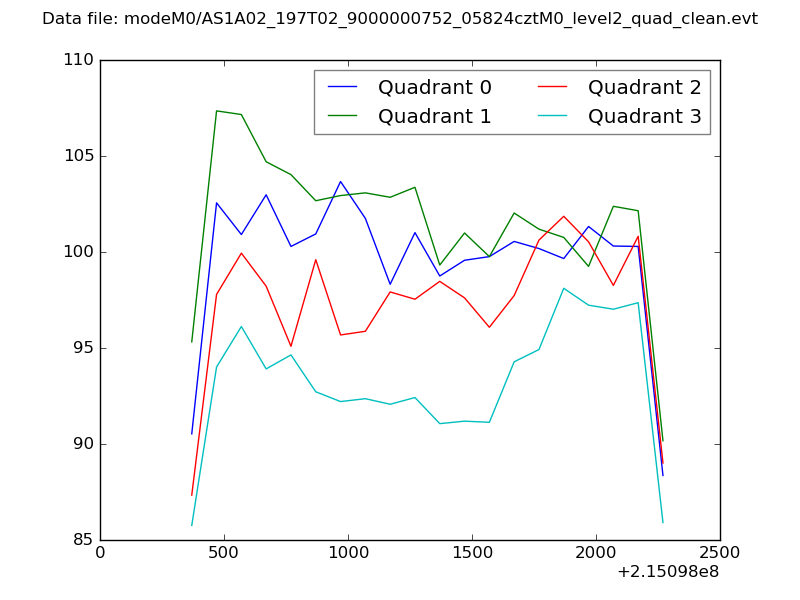 |
|
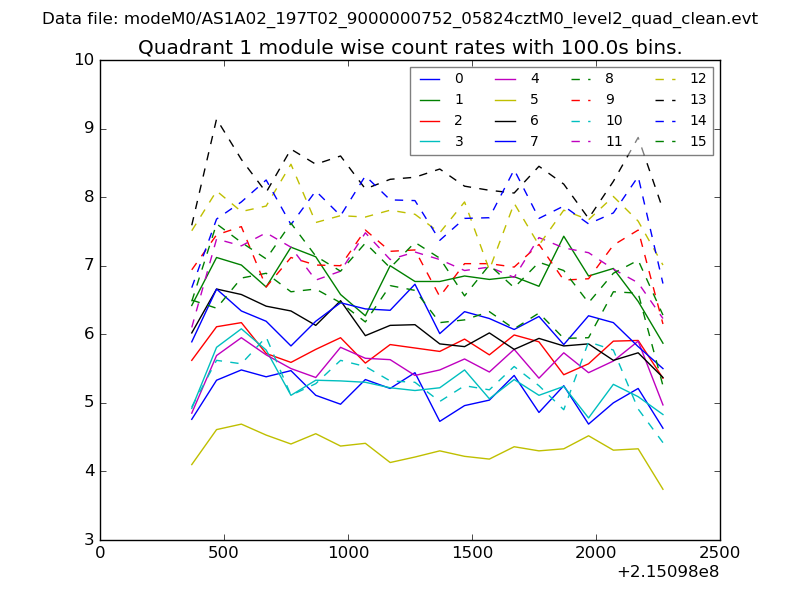
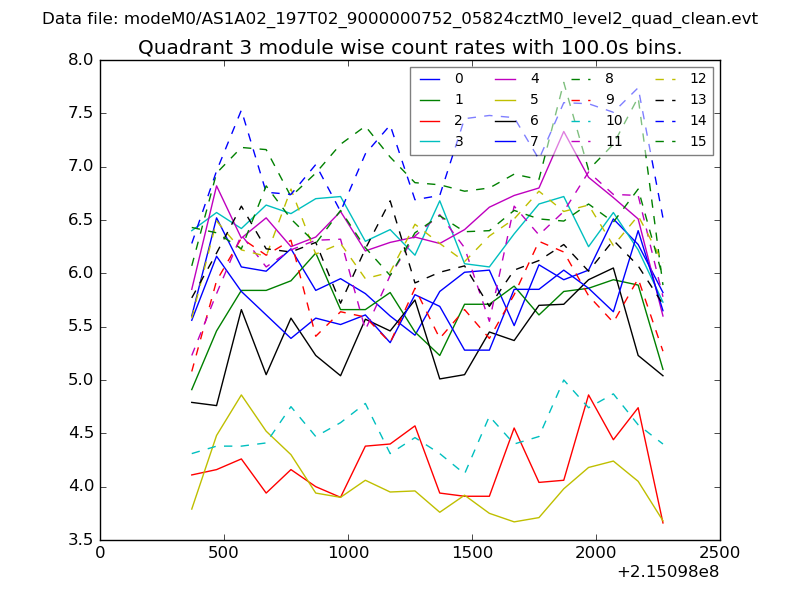
| Module-wise count rates for Quadrant A Data is divided into 100 sec bins |
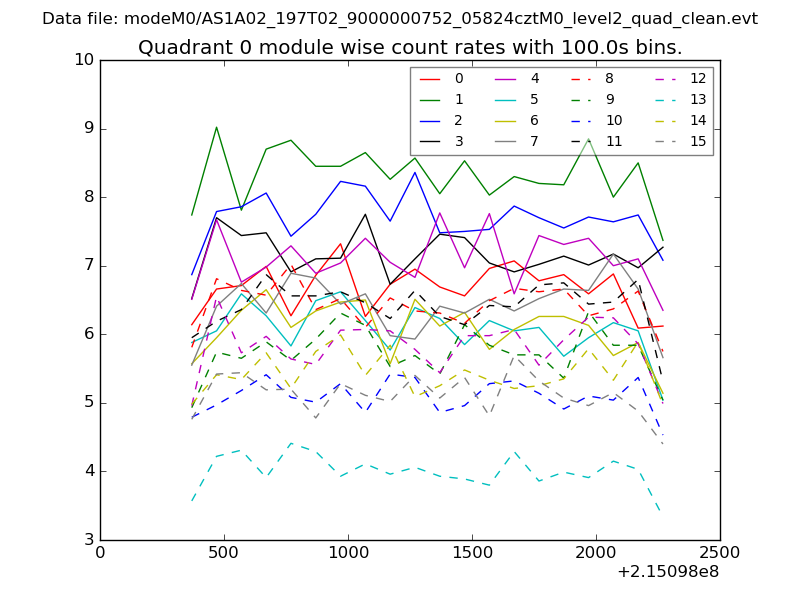 |
 |
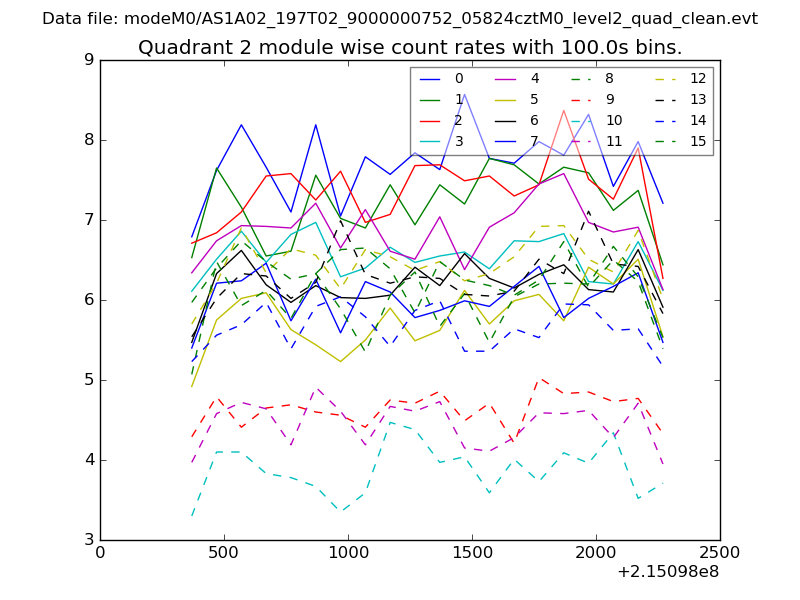
| Module-wise count rates for Quadrant B Data is divided into 100 sec bins |
 |
 |
| Module-wise count rates for Quadrant C Data is divided into 100 sec bins |
 |
 |
| Module-wise count rates for Quadrant D Data is divided into 100 sec bins |
 |
 |
| Parameter | Plot |
|---|---|
| CZT HV Monitor | 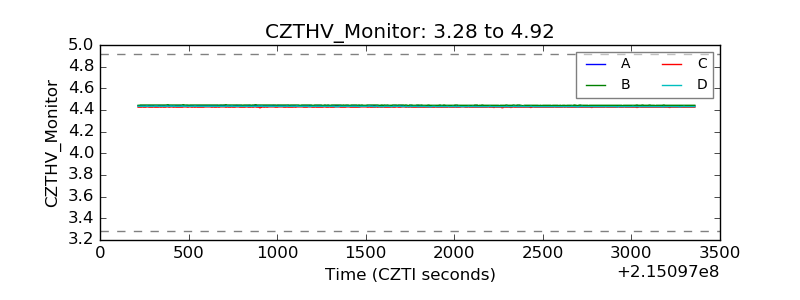 |
| D_VDD | 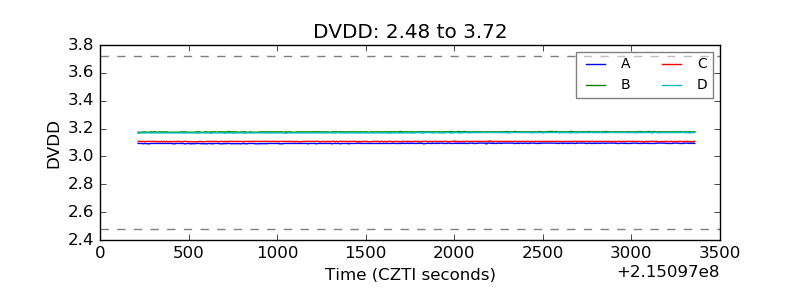 |
| Temperature 1 | 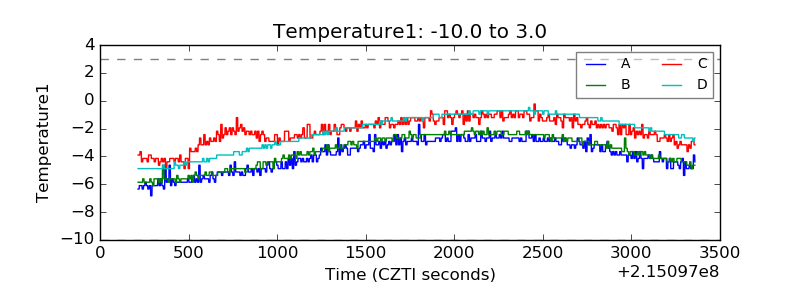 |
| Veto HV Monitor | 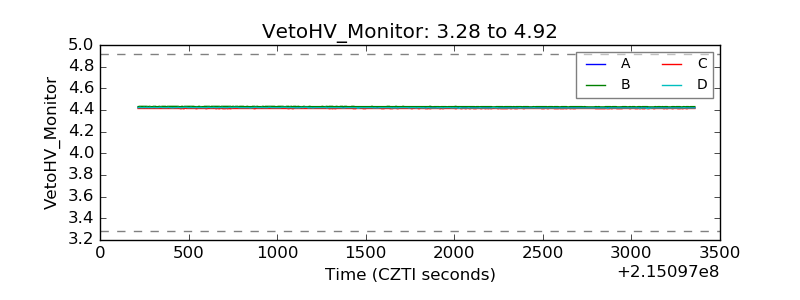 |
| Veto LLD | 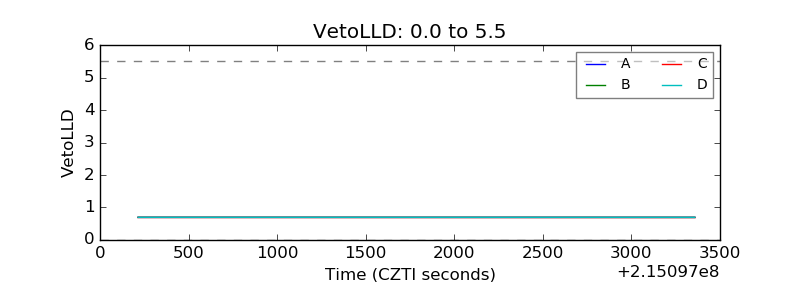 |
| Alpha Counter |  |
| _CPM_Rate | 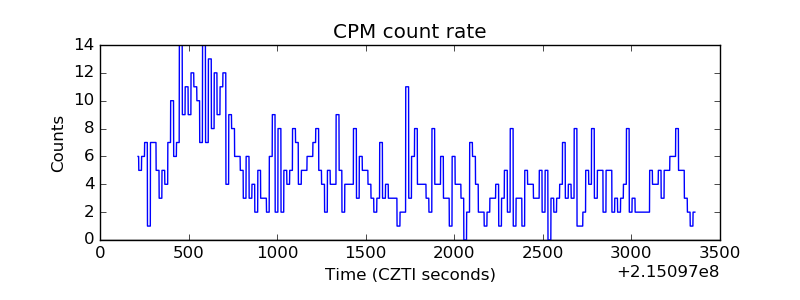 |
| CZT Counter | 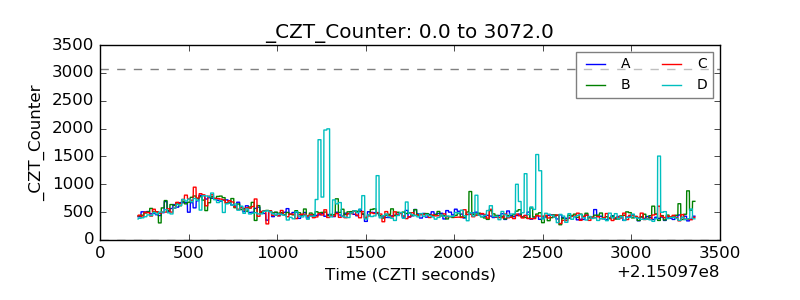 |
| +2.5 Volts monitor |  |
| +5 Volts monitor |  |
| _ROLL_ROT | 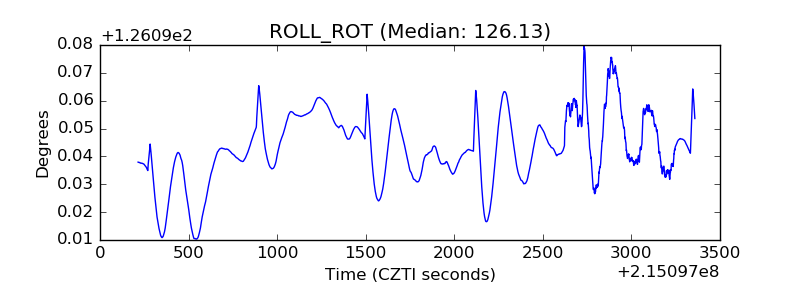 |
| _Roll_DEC | 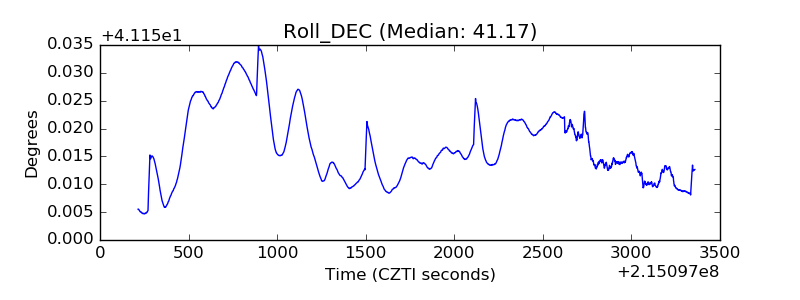 |
| _Roll_RA | 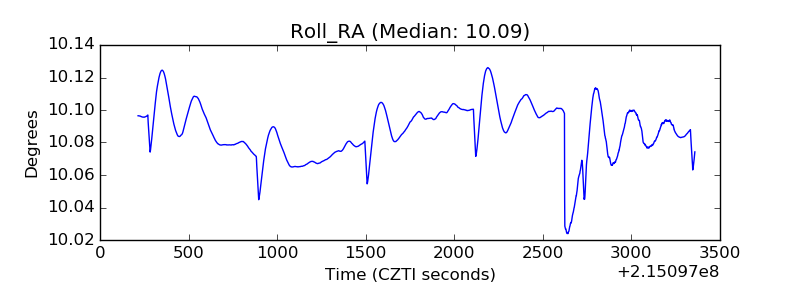 |
| Veto Counter | 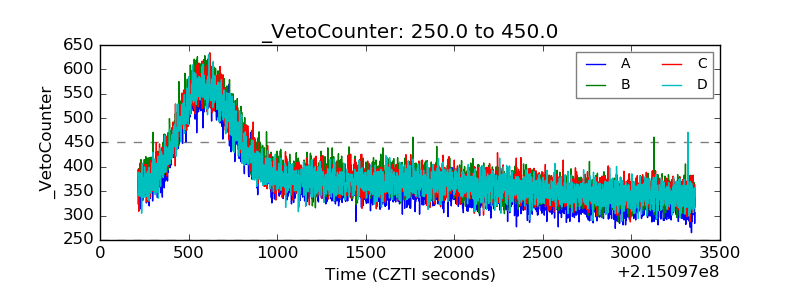 |