| Param | Original file | Final file |
|---|---|---|
| Filename | modeM0/AS1G06_052T01_9000000754_05824cztM0_level2.evt | modeM0/AS1G06_052T01_9000000754_05824cztM0_level2_quad_clean.evt |
| Size (bytes) | 298,661,760 | 60,275,520 |
| Size | 284.8 MB | 57.5 MB |
| Events in quadrant A | 2,198,890 | 384,063 |
| Events in quadrant B | 2,194,290 | 378,691 |
| Events in quadrant C | 2,135,222 | 378,179 |
| Events in quadrant D | 2,210,564 | 368,905 |
| Mode M9 | |||
|---|---|---|---|
| Quadrant | BADHDUFLAG | Total packets | Discarded packets |
| A | 0 | 2 | 0 |
| B | 0 | 2 | 0 |
| C | 0 | 2 | 0 |
| D | 0 | 2 | 0 |
| Mode SS | |||
|---|---|---|---|
| Quadrant | BADHDUFLAG | Total packets | Discarded packets |
| A | 0 | 94 | 2 |
| B | 0 | 94 | 0 |
| C | 0 | 94 | 2 |
| D | 0 | 94 | 0 |
| Mode M0 | |||
|---|---|---|---|
| Quadrant | BADHDUFLAG | Total packets | Discarded packets |
| A | 0 | 9809 | 100 |
| B | 0 | 9678 | 83 |
| C | 0 | 9678 | 94 |
| D | 0 | 9890 | 83 |
| Quadrant | Total seconds | Saturated seconds | Saturation percentage |
|---|---|---|---|
| A | 4480 | 99 | 2.209821% |
| B | 4486 | 85 | 1.894784% |
| C | 4480 | 68 | 1.517857% |
| D | 4487 | 75 | 1.671495% |
Noise dominated data is calculated using 1-second bins in cleaned event files. If a bin has >2000 counts, and if more than 50% of those come from <1% of pixels, then it is considered to be noise-dominated and hence unusable.
| Quadrant | # 1 sec bins | Bins with >0 counts | Bins with >2000 counts | High rate bins dominated by noise | Noise dominated (total time) | Noise dominated (detector-on time) | Marked lightcurve |
|---|---|---|---|---|---|---|---|
| A | 4717 | 4524 | 3 | 3 | 0.06% | 0.07% | 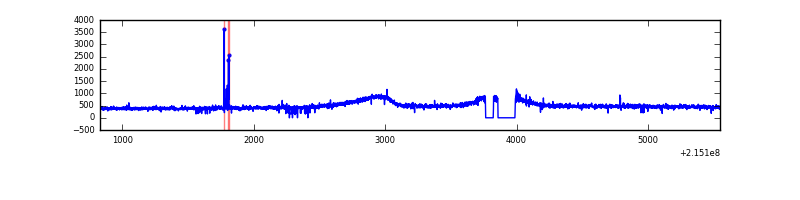 |
| B | 4717 | 4527 | 4 | 4 | 0.08% | 0.09% | 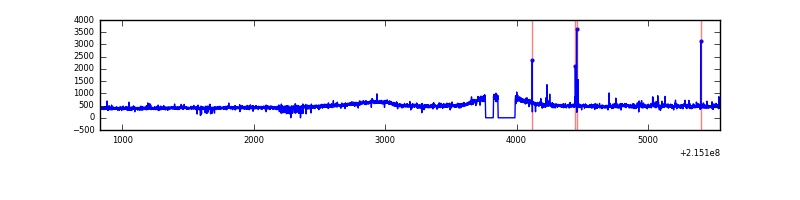 |
| C | 4717 | 4525 | 1 | 1 | 0.02% | 0.02% | 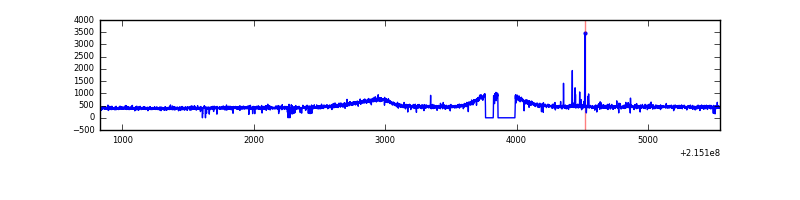 |
| D | 4717 | 4526 | 3 | 3 | 0.06% | 0.07% | 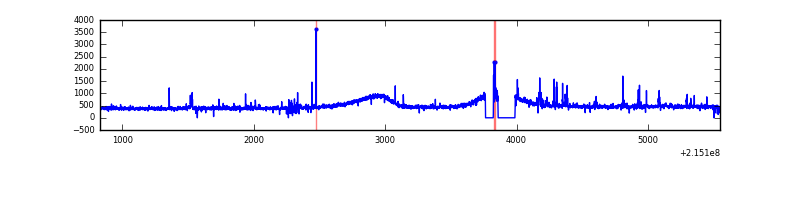 |
Top three noisy pixels from each quadrant. If the there are fewer than three noisy pixels in the level2.evt file, extra rows are filled as -1
| Pixel properties | Quadrant properties | ||||||
|---|---|---|---|---|---|---|---|
| Quadrant | DetID | PixID | Counts | Sigma | Mean | Median | Sigma |
| A | 15 | 223 | 29104 | 246.26 | 561 | 549 | 116.0 |
| A | 13 | 210 | 7173 | 57.12 | 561 | 549 | 116.0 |
| A | 12 | 194 | 5594 | 43.51 | 561 | 549 | 116.0 |
| B | 15 | 204 | 28265 | 257.49 | 550 | 536 | 107.7 |
| B | 0 | 214 | 12461 | 110.74 | 550 | 536 | 107.7 |
| B | 12 | 111 | 10000 | 87.88 | 550 | 536 | 107.7 |
| C | 1 | 16 | 21180 | 162.4 | 539 | 541 | 127.1 |
| C | 9 | 16 | 6846 | 49.61 | 539 | 541 | 127.1 |
| C | 13 | 61 | 4373 | 30.15 | 539 | 541 | 127.1 |
| D | 12 | 233 | 26808 | 190.8 | 549 | 532 | 137.7 |
| D | 8 | 195 | 25075 | 178.22 | 549 | 532 | 137.7 |
| D | 2 | 63 | 19286 | 136.18 | 549 | 532 | 137.7 |
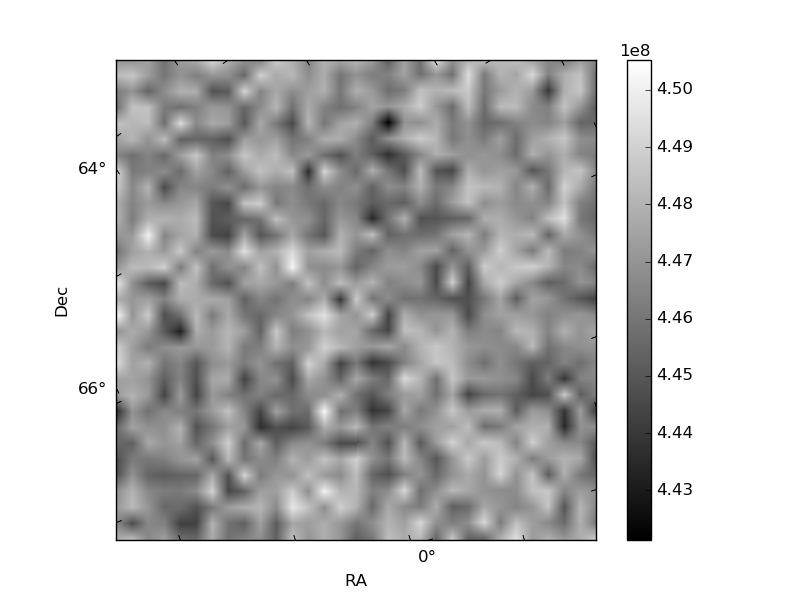
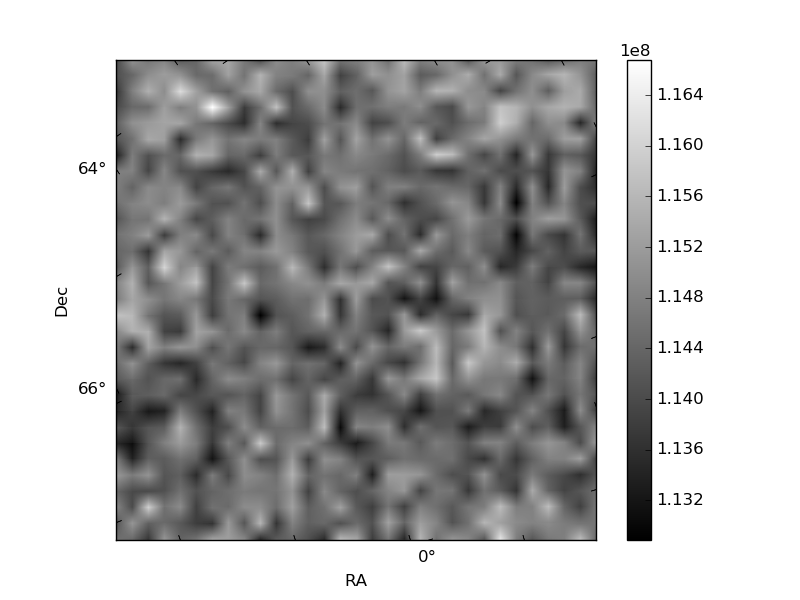
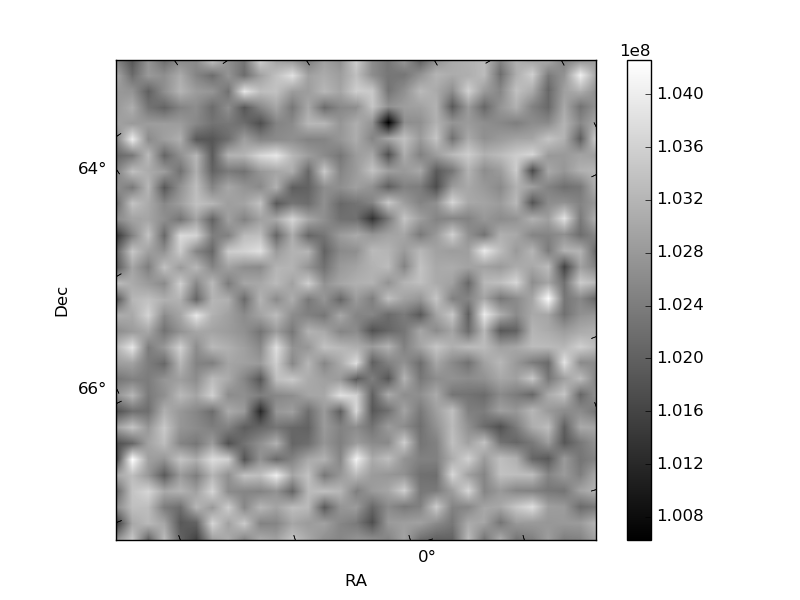
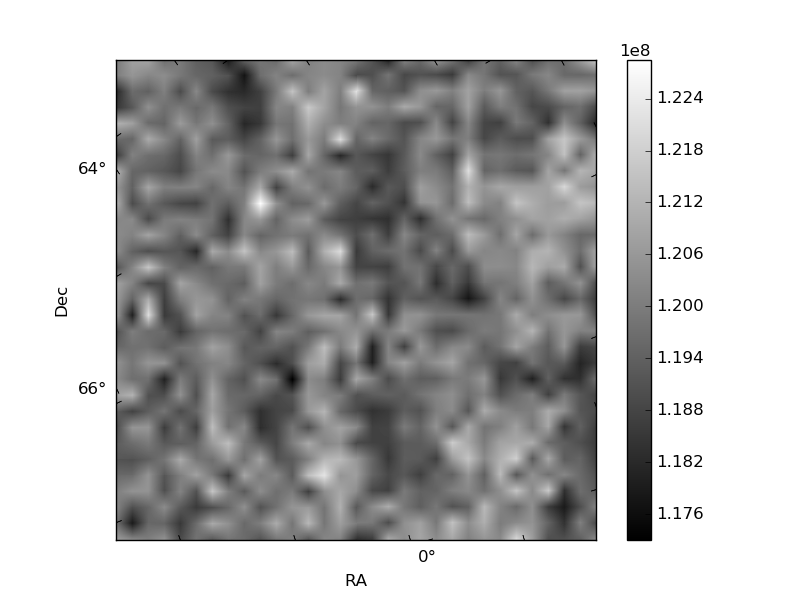
Histogram calculated using DETX and DETY for each event in the final _common_clean file
| Quadrant A | 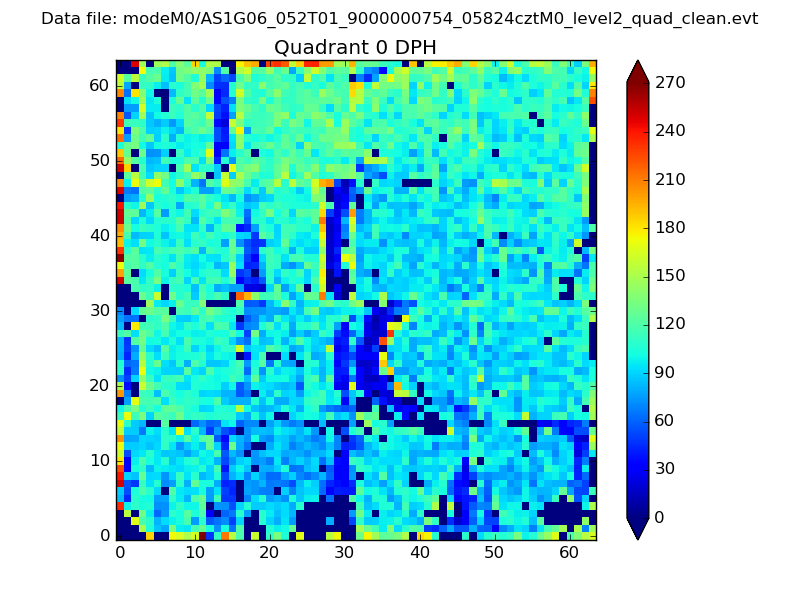 |
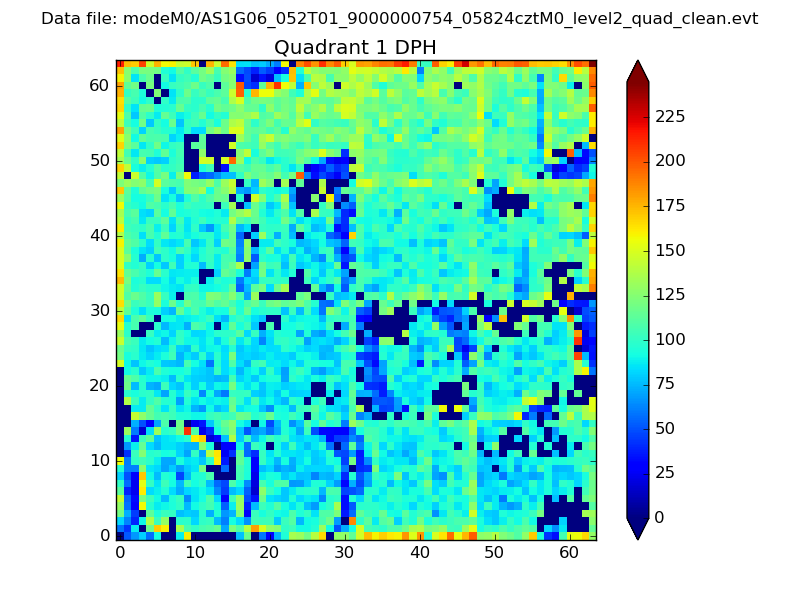 |
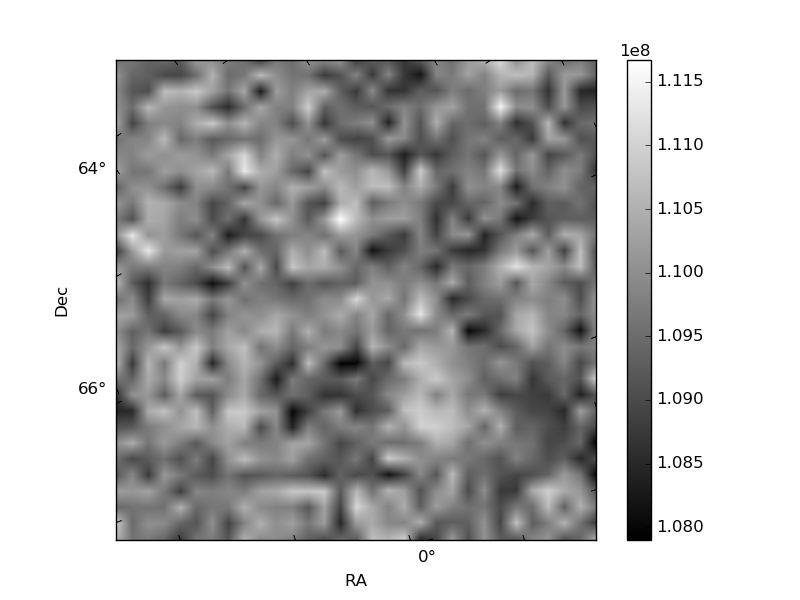
Quadrant B |
|---|---|---|---|
| Quadrant D | 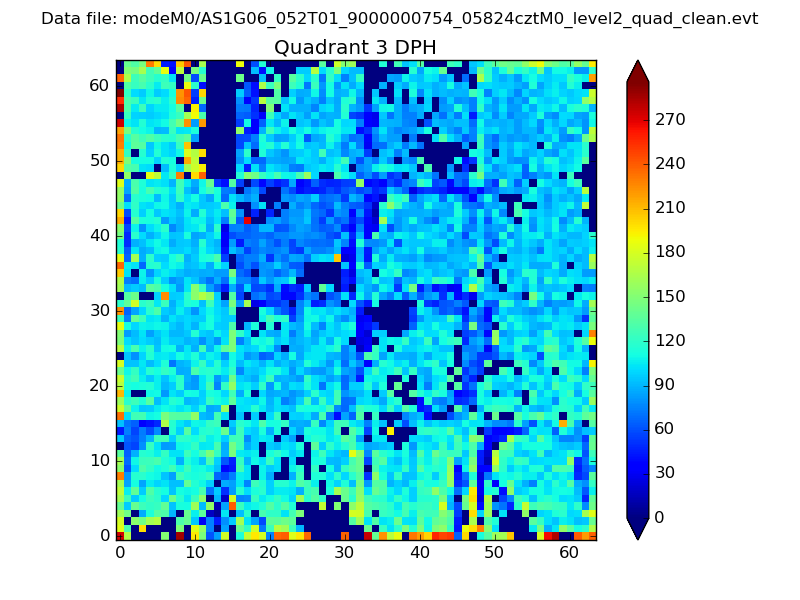 |
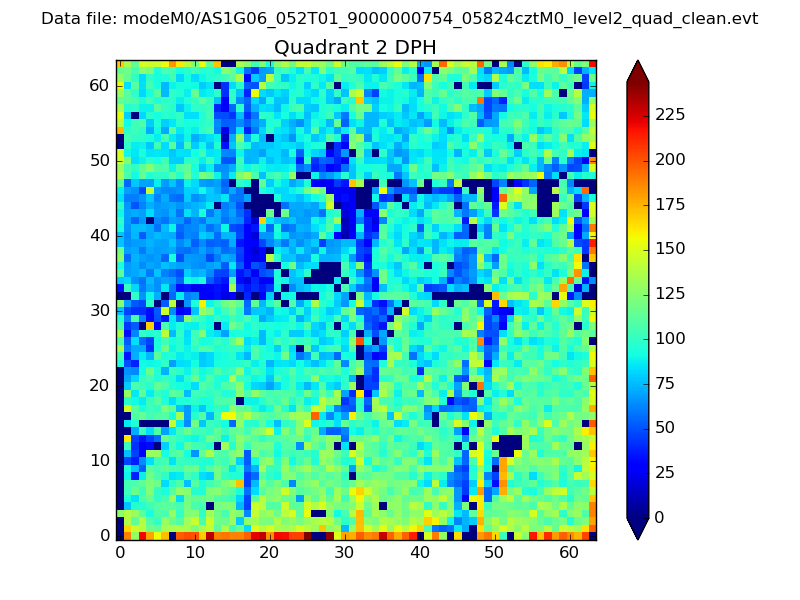 |
Quadrant C |
| Plot type | Count rate plots | Images |
|---|---|---|
| Comparison with Poisson distribution Blue bars denote a histogram of data divided into 1 sec bins. Red curve is a Poisson curve with rate = median count rate of data. |
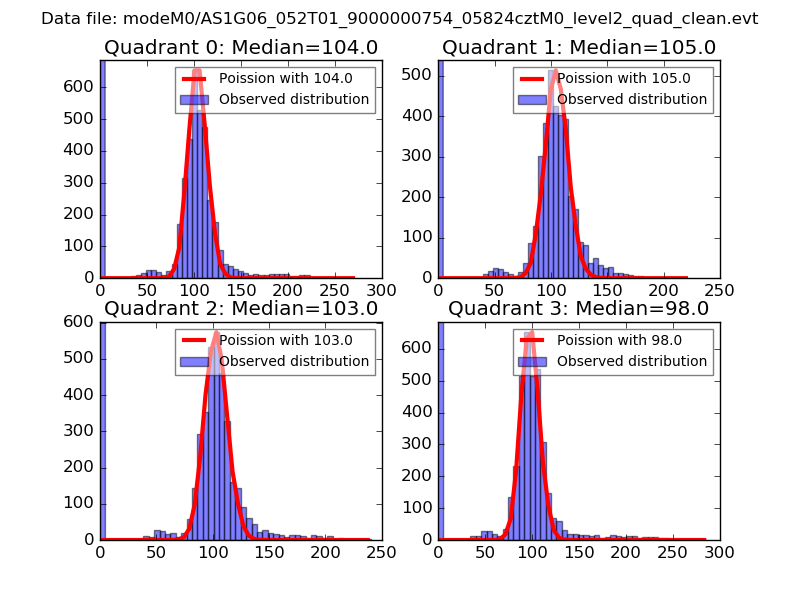 |
 |
| Quadrant-wise count rates Data is divided into 100 sec bins |
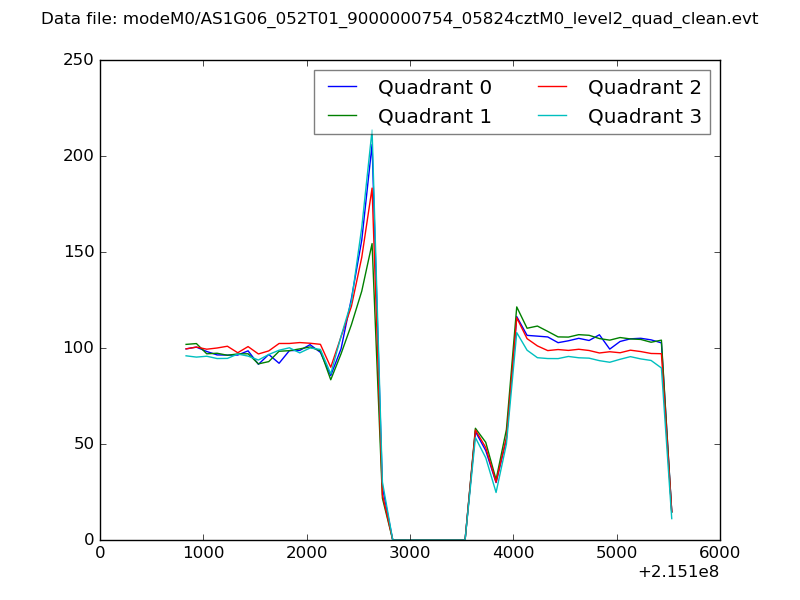 |
|
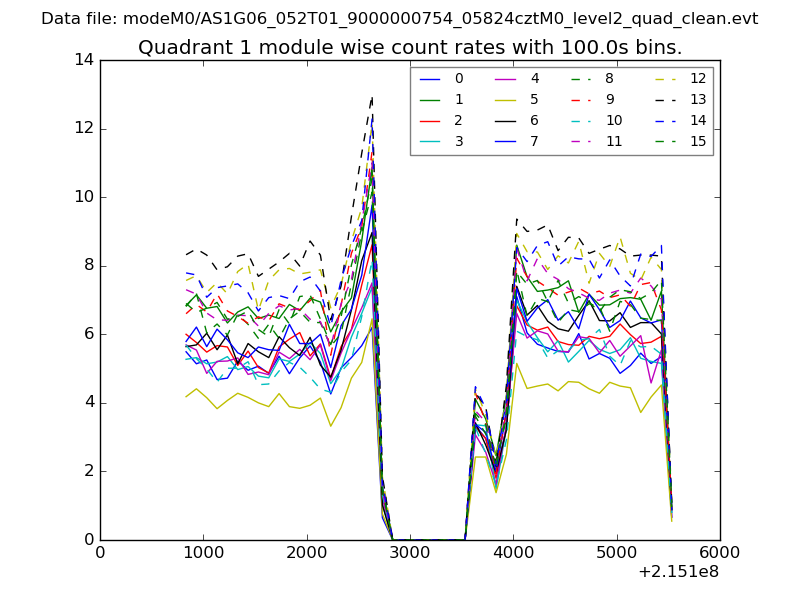
| Module-wise count rates for Quadrant A Data is divided into 100 sec bins |
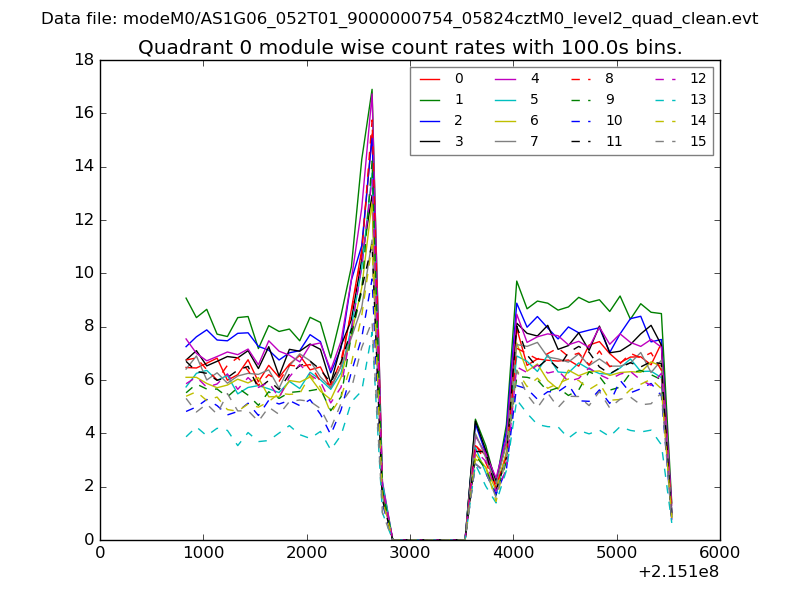 |
 |
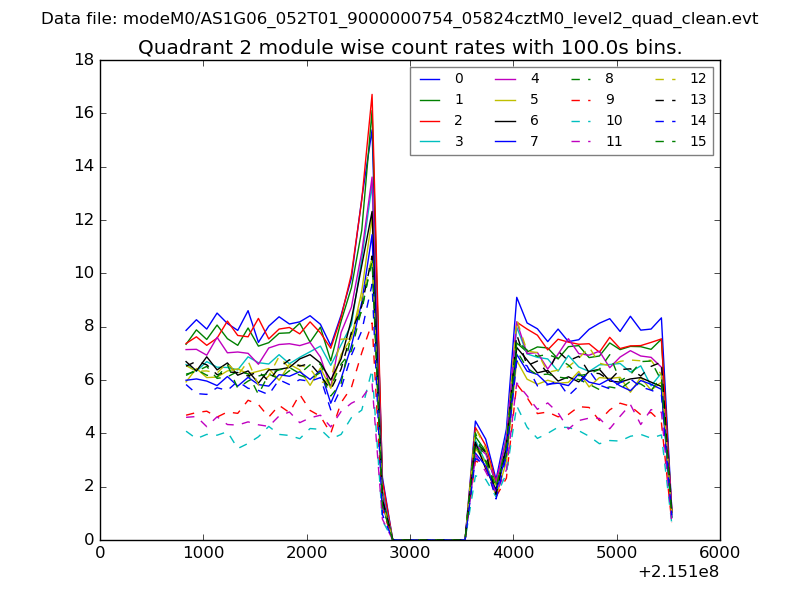
| Module-wise count rates for Quadrant B Data is divided into 100 sec bins |
 |
 |
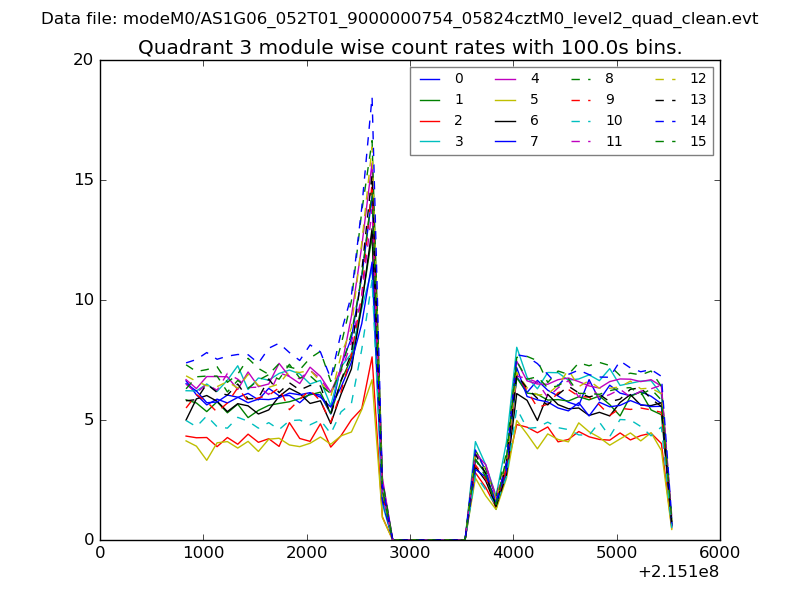
| Module-wise count rates for Quadrant C Data is divided into 100 sec bins |
 |
 |
| Module-wise count rates for Quadrant D Data is divided into 100 sec bins |
 |
 |
| Parameter | Plot |
|---|---|
| CZT HV Monitor | 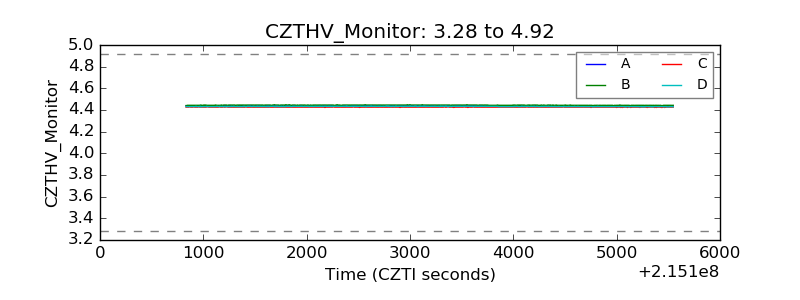 |
| D_VDD | 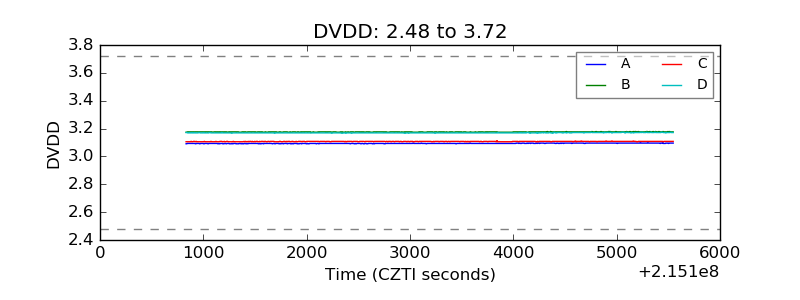 |
| Temperature 1 | 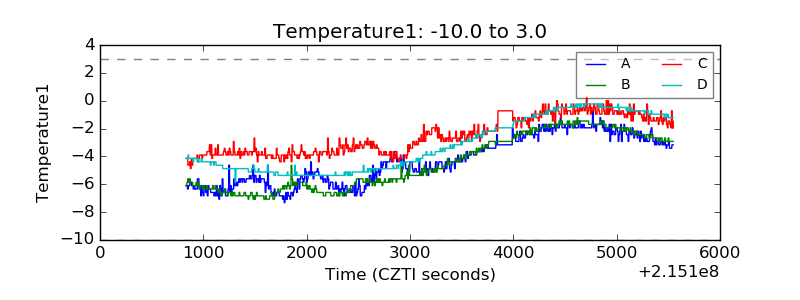 |
| Veto HV Monitor | 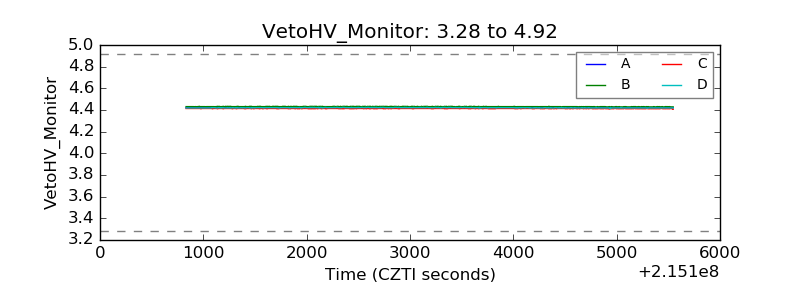 |
| Veto LLD | 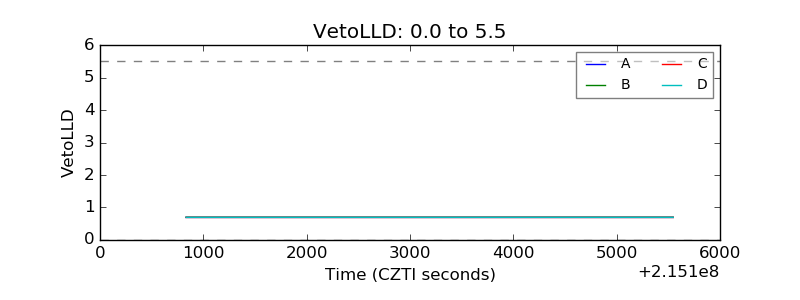 |
| Alpha Counter | 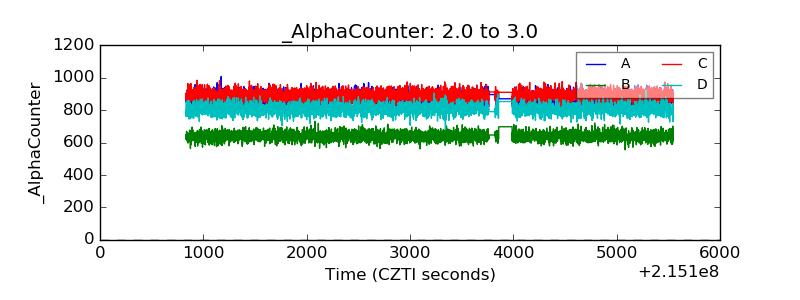 |
| _CPM_Rate | 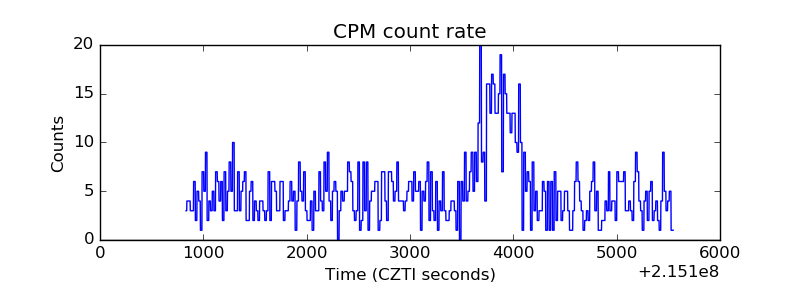 |
| CZT Counter | 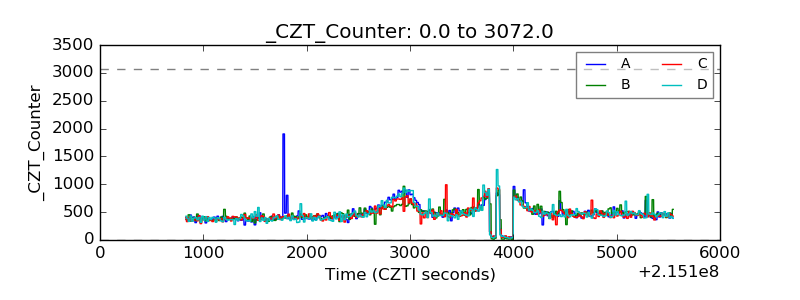 |
| +2.5 Volts monitor |  |
| +5 Volts monitor |  |
| _ROLL_ROT | 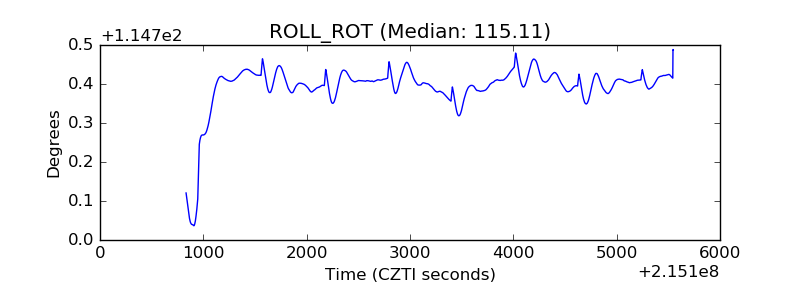 |
| _Roll_DEC | 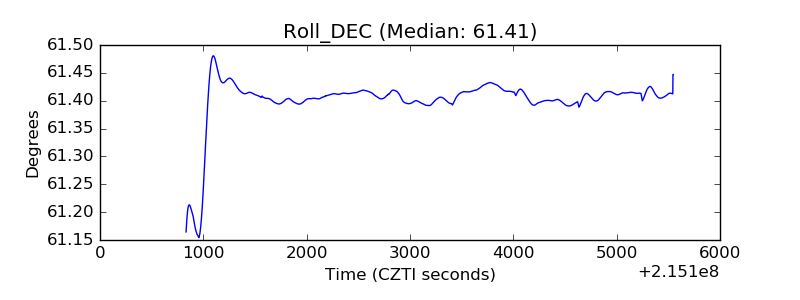 |
| _Roll_RA | 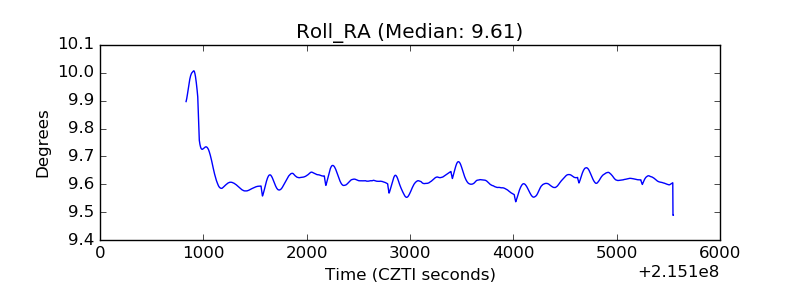 |
| Veto Counter | 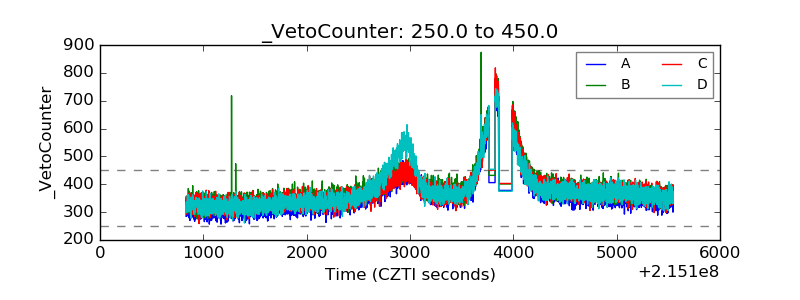 |