| Param | Original file | Final file |
|---|---|---|
| Filename | modeM0/AS1G06_052T01_9000000754_05826cztM0_level2.evt | modeM0/AS1G06_052T01_9000000754_05826cztM0_level2_quad_clean.evt |
| Size (bytes) | 644,639,040 | 142,827,840 |
| Size | 614.8 MB | 136.2 MB |
| Events in quadrant A | 4,501,903 | 914,561 |
| Events in quadrant B | 4,680,298 | 918,912 |
| Events in quadrant C | 4,521,655 | 911,790 |
| Events in quadrant D | 5,119,581 | 866,663 |
| Mode M9 | |||
|---|---|---|---|
| Quadrant | BADHDUFLAG | Total packets | Discarded packets |
| A | 0 | 5 | 0 |
| B | 0 | 5 | 0 |
| C | 0 | 5 | 0 |
| D | 0 | 5 | 0 |
| Mode SS | |||
|---|---|---|---|
| Quadrant | BADHDUFLAG | Total packets | Discarded packets |
| A | 0 | 208 | 0 |
| B | 0 | 208 | 0 |
| C | 0 | 208 | 0 |
| D | 0 | 208 | 0 |
| Mode M0 | |||
|---|---|---|---|
| Quadrant | BADHDUFLAG | Total packets | Discarded packets |
| A | 0 | 21165 | 16 |
| B | 0 | 21247 | 6 |
| C | 0 | 21244 | 6 |
| D | 0 | 23182 | 4 |
| Quadrant | Total seconds | Saturated seconds | Saturation percentage |
|---|---|---|---|
| A | 10302 | 78 | 0.757135% |
| B | 10306 | 60 | 0.582185% |
| C | 10306 | 70 | 0.679216% |
| D | 10308 | 275 | 2.667831% |
Noise dominated data is calculated using 1-second bins in cleaned event files. If a bin has >2000 counts, and if more than 50% of those come from <1% of pixels, then it is considered to be noise-dominated and hence unusable.
| Quadrant | # 1 sec bins | Bins with >0 counts | Bins with >2000 counts | High rate bins dominated by noise | Noise dominated (total time) | Noise dominated (detector-on time) | Marked lightcurve |
|---|---|---|---|---|---|---|---|
| A | 10758 | 10309 | 2 | 2 | 0.02% | 0.02% | 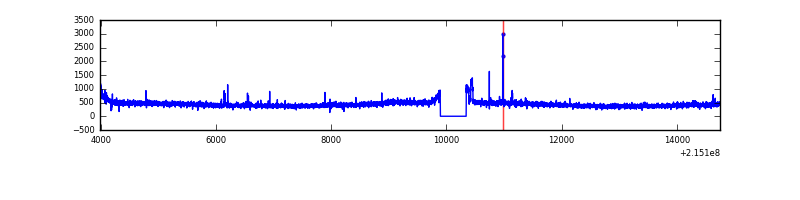 |
| B | 10758 | 10309 | 4 | 4 | 0.04% | 0.04% | 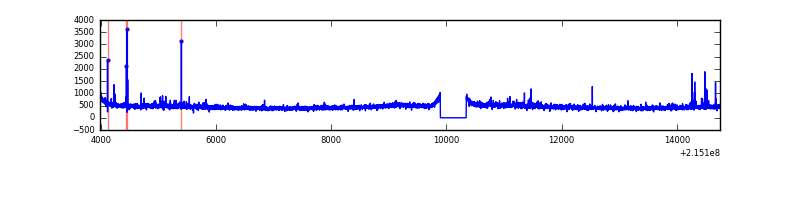 |
| C | 10758 | 10309 | 19 | 19 | 0.18% | 0.18% |  |
| D | 10759 | 10310 | 123 | 123 | 1.14% | 1.19% | 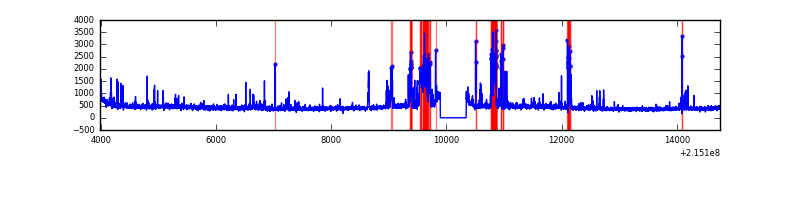 |
Top three noisy pixels from each quadrant. If the there are fewer than three noisy pixels in the level2.evt file, extra rows are filled as -1
| Pixel properties | Quadrant properties | ||||||
|---|---|---|---|---|---|---|---|
| Quadrant | DetID | PixID | Counts | Sigma | Mean | Median | Sigma |
| A | 15 | 236 | 40693 | 169.94 | 1144 | 1119 | 232.9 |
| A | 15 | 174 | 16184 | 64.69 | 1144 | 1119 | 232.9 |
| A | 15 | 223 | 12713 | 49.79 | 1144 | 1119 | 232.9 |
| B | 15 | 204 | 127093 | 573.94 | 1159 | 1128 | 219.5 |
| B | 4 | 48 | 25031 | 108.91 | 1159 | 1128 | 219.5 |
| B | 12 | 111 | 20297 | 87.34 | 1159 | 1128 | 219.5 |
| C | 1 | 16 | 97593 | 371.5 | 1123 | 1126 | 259.7 |
| C | 12 | 4 | 34541 | 128.68 | 1123 | 1126 | 259.7 |
| C | 13 | 61 | 9150 | 30.9 | 1123 | 1126 | 259.7 |
| D | 2 | 63 | 633638 | 2311.81 | 1113 | 1078 | 273.6 |
| D | 12 | 233 | 57428 | 205.94 | 1113 | 1078 | 273.6 |
| D | 8 | 195 | 48031 | 171.6 | 1113 | 1078 | 273.6 |
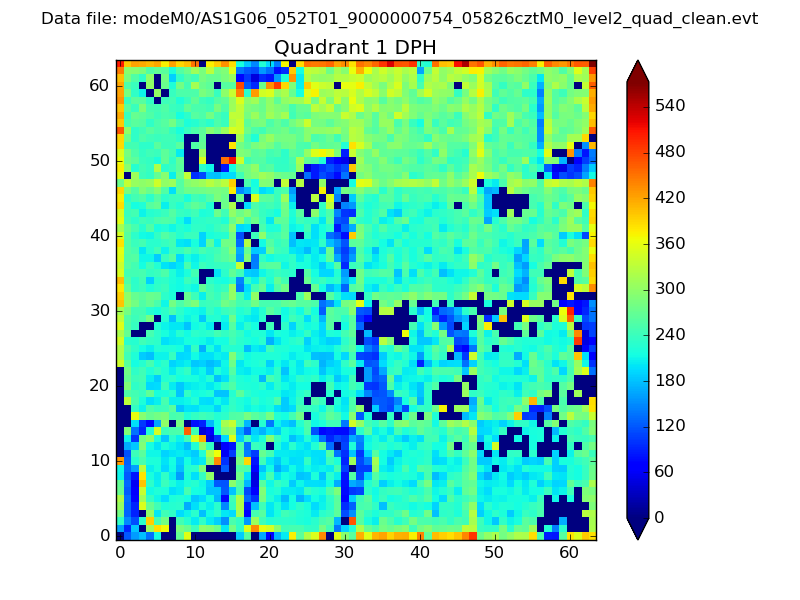
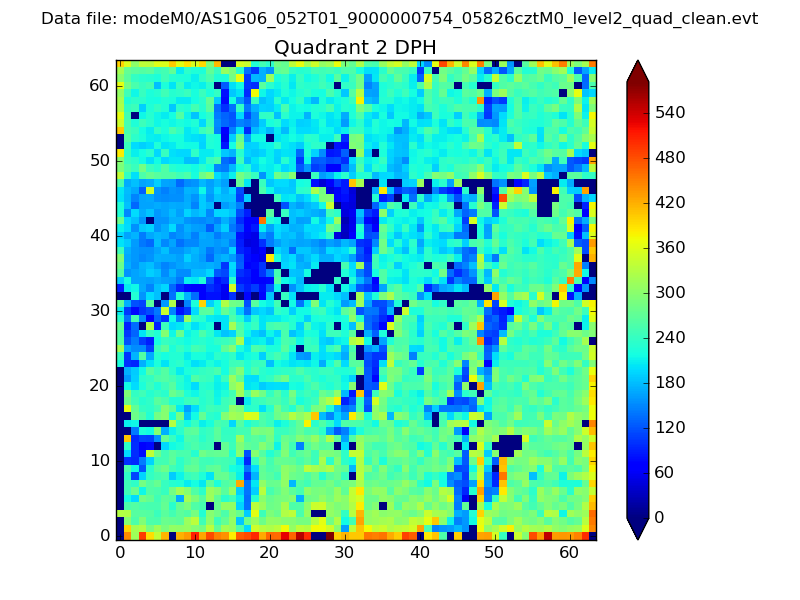
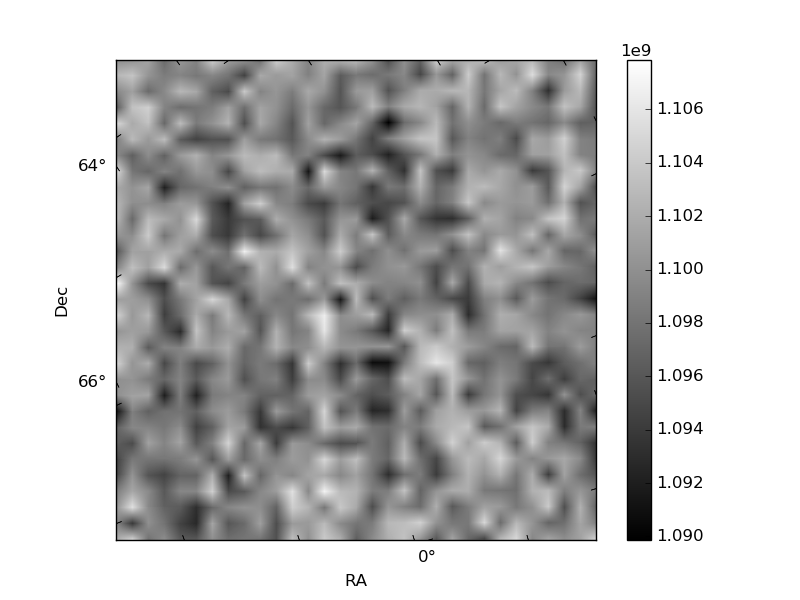
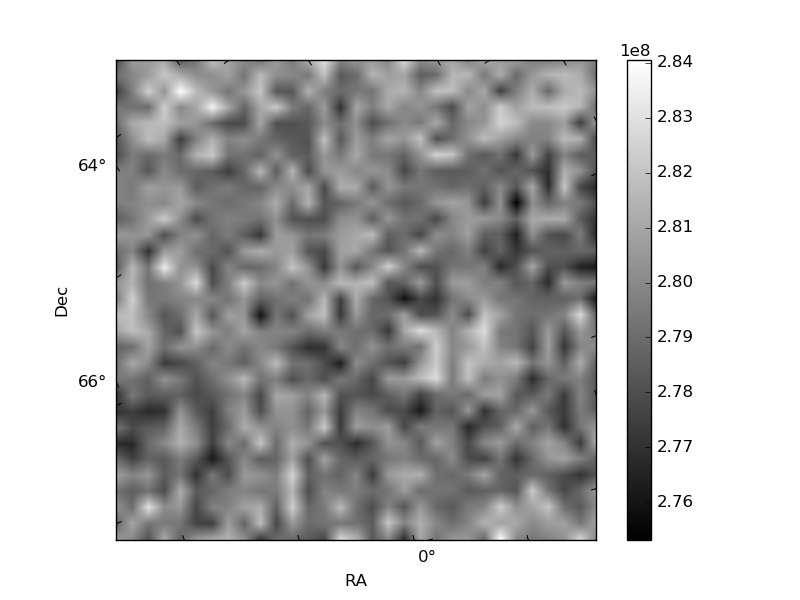
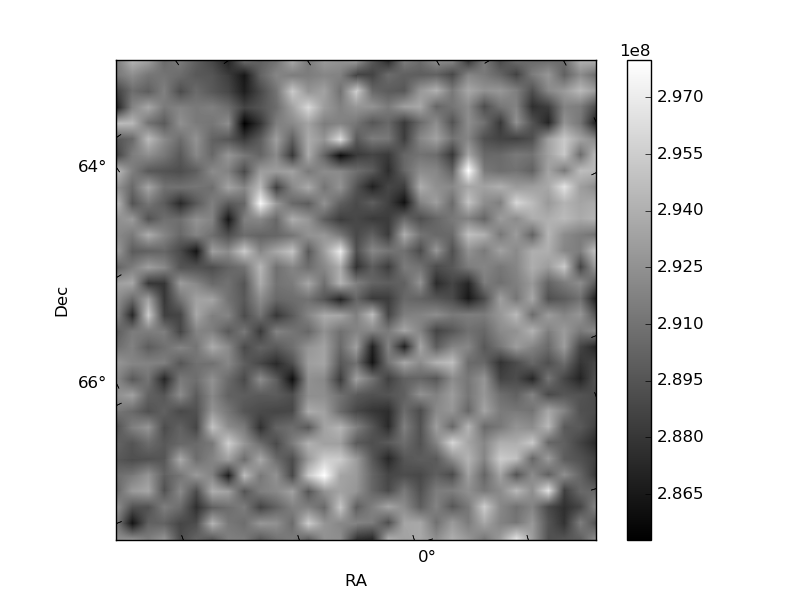
Histogram calculated using DETX and DETY for each event in the final _common_clean file
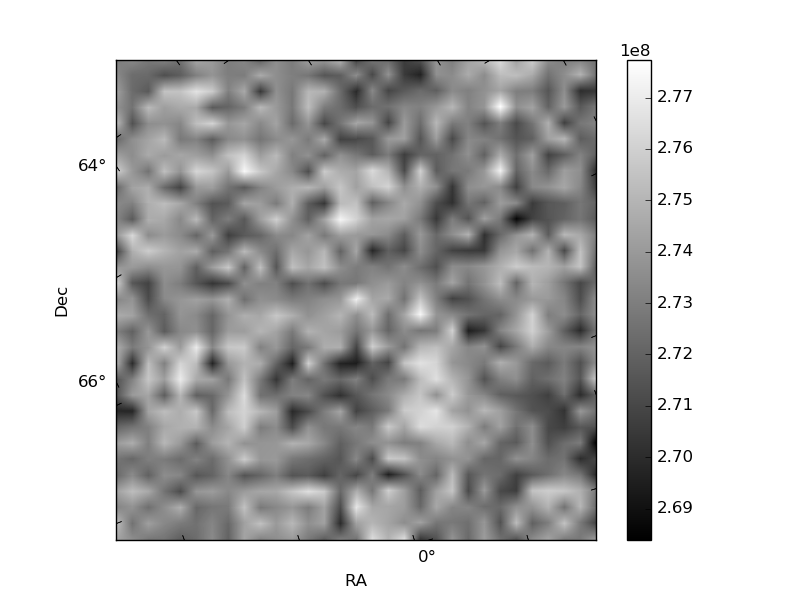
| Quadrant A | 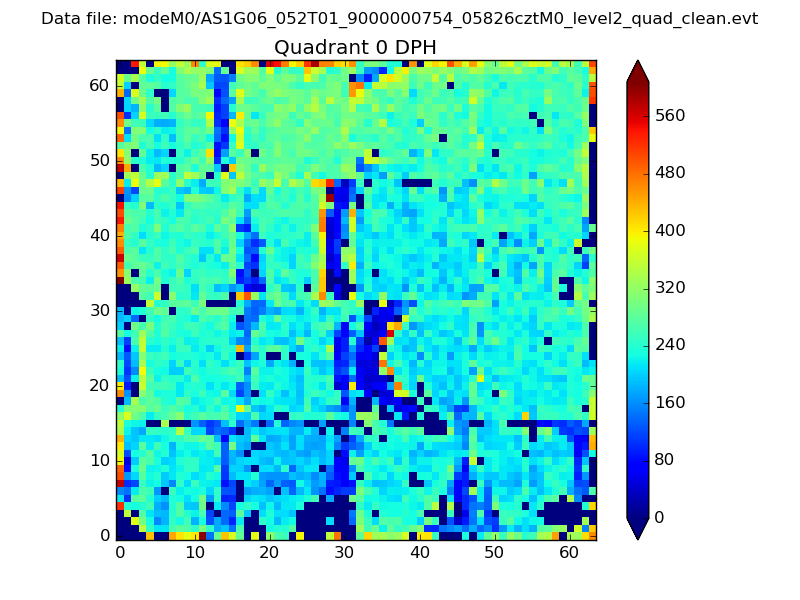 |
 |
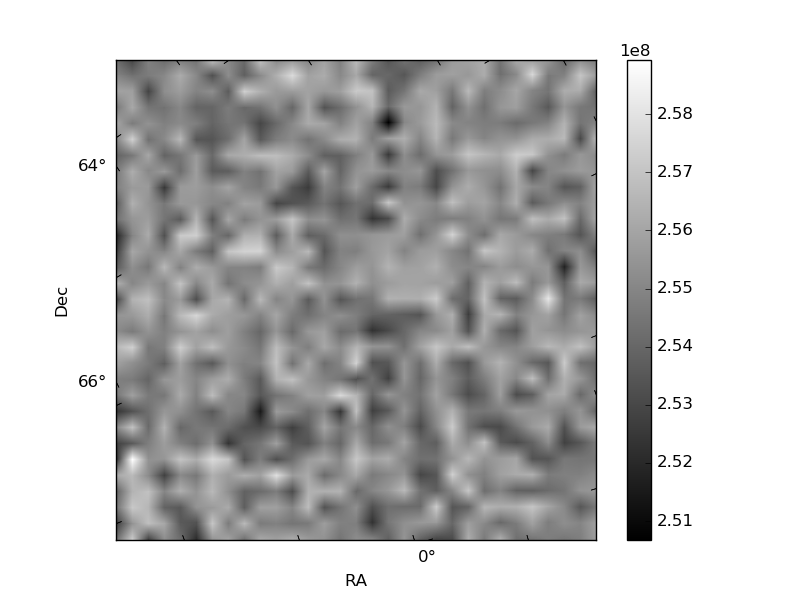
Quadrant B |
|---|---|---|---|
| Quadrant D | 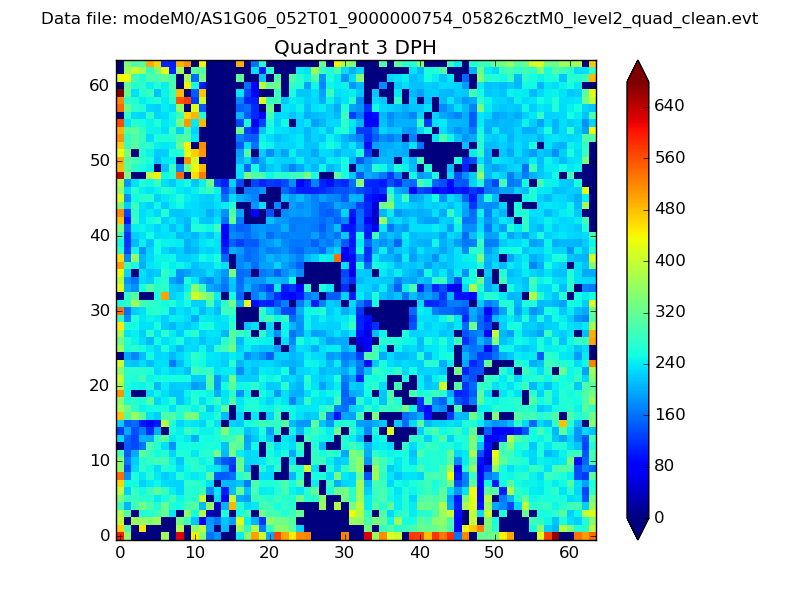 |
 |
Quadrant C |
| Plot type | Count rate plots | Images |
|---|---|---|
| Comparison with Poisson distribution Blue bars denote a histogram of data divided into 1 sec bins. Red curve is a Poisson curve with rate = median count rate of data. |
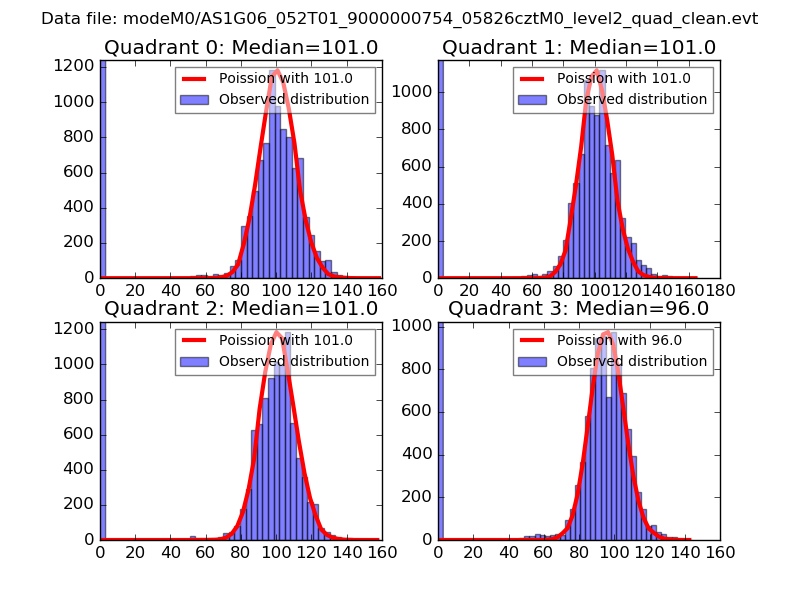 |
 |
| Quadrant-wise count rates Data is divided into 100 sec bins |
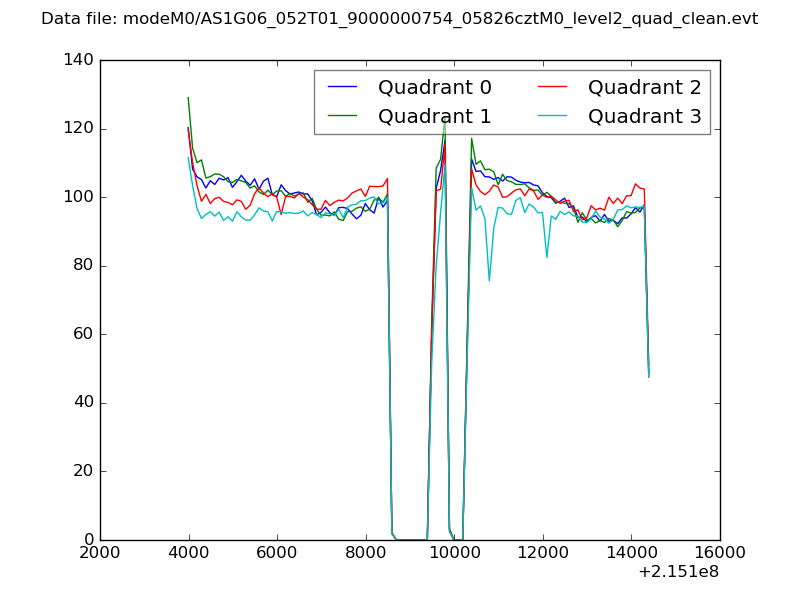 |
|
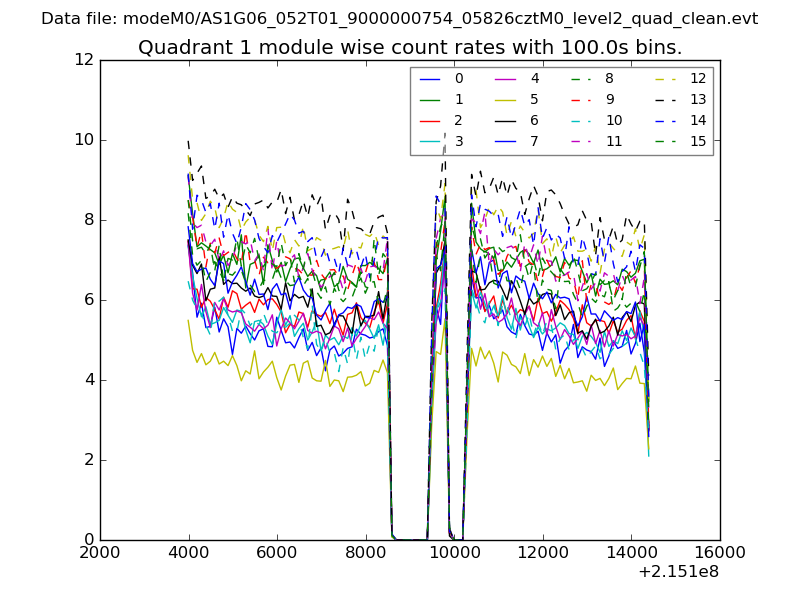
| Module-wise count rates for Quadrant A Data is divided into 100 sec bins |
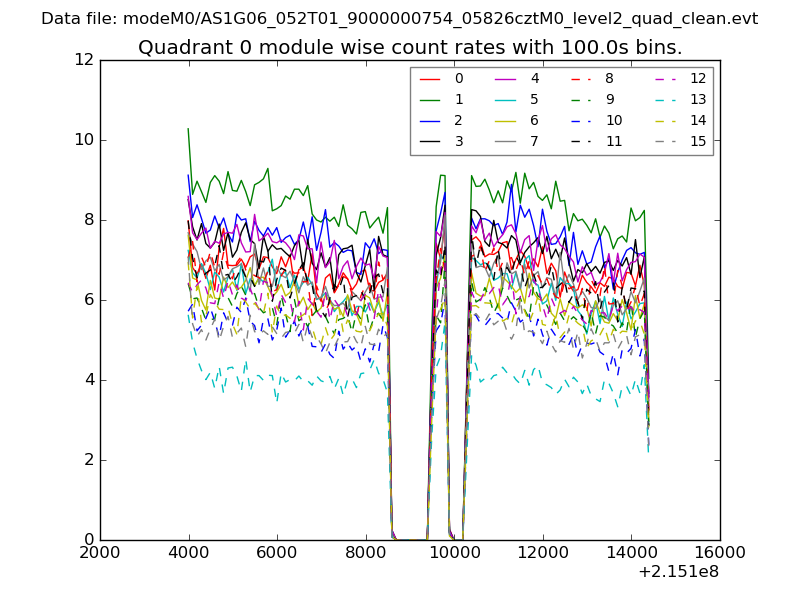 |
 |
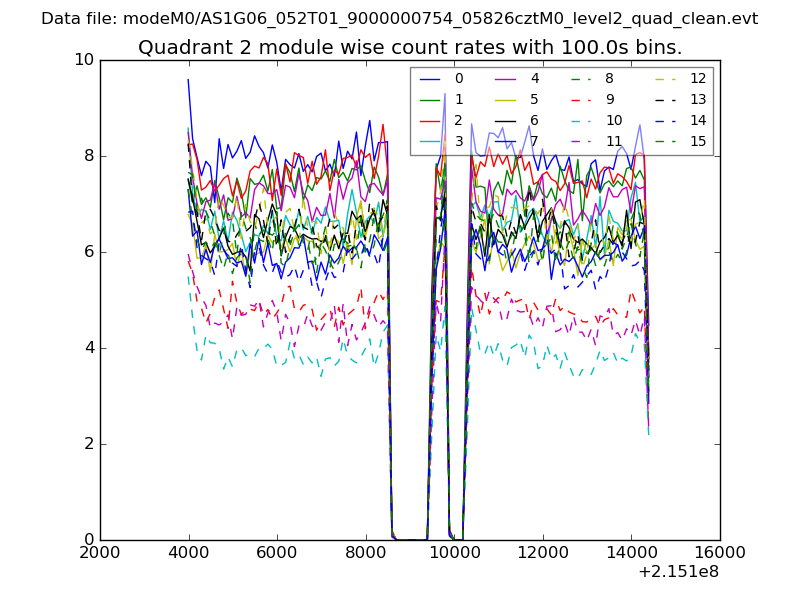
| Module-wise count rates for Quadrant B Data is divided into 100 sec bins |
 |
 |
| Module-wise count rates for Quadrant C Data is divided into 100 sec bins |
 |
 |
| Module-wise count rates for Quadrant D Data is divided into 100 sec bins |
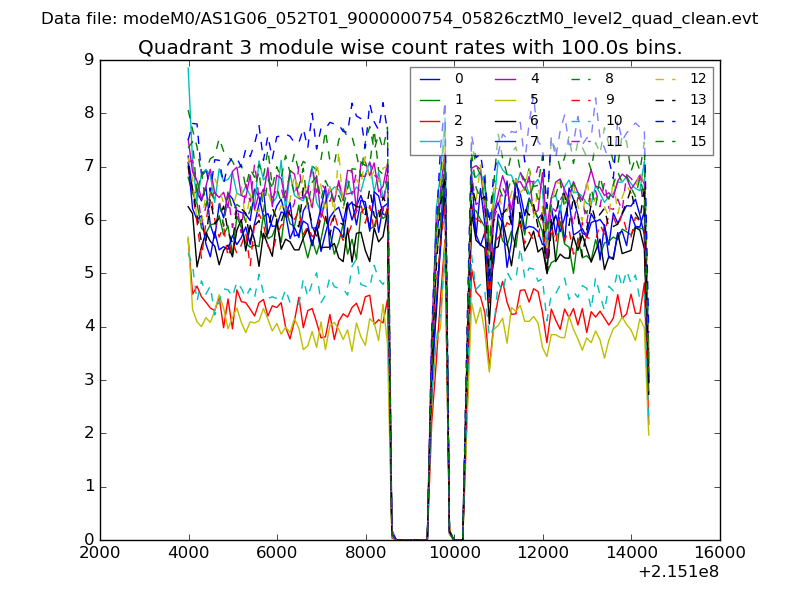 |
 |
| Parameter | Plot |
|---|---|
| CZT HV Monitor | 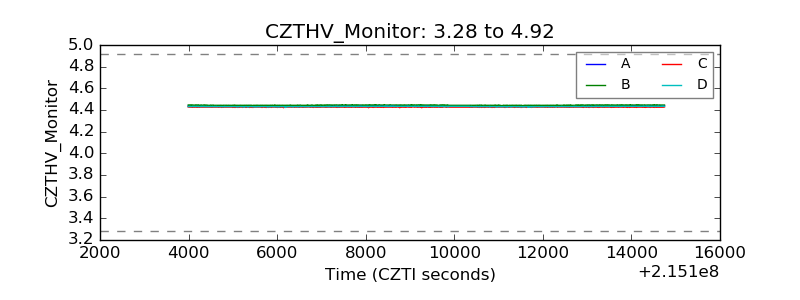 |
| D_VDD | 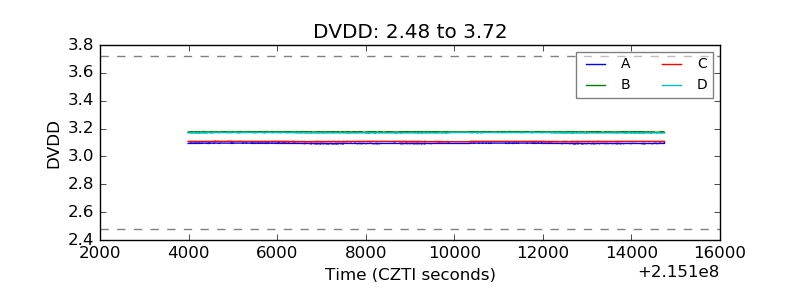 |
| Temperature 1 | 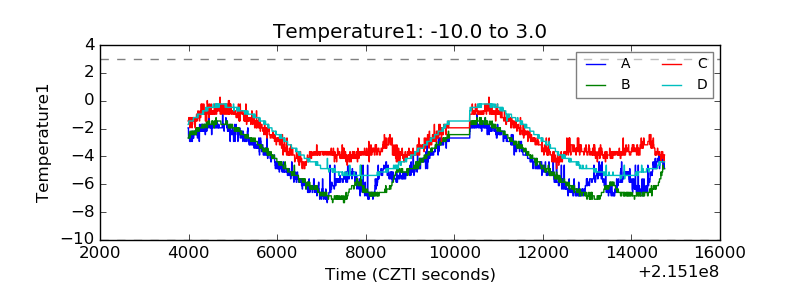 |
| Veto HV Monitor |  |
| Veto LLD | 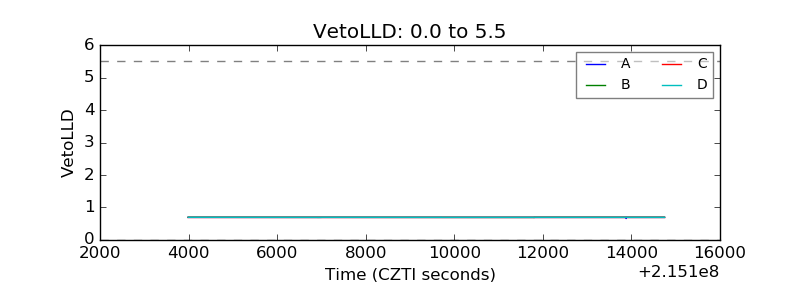 |
| Alpha Counter | 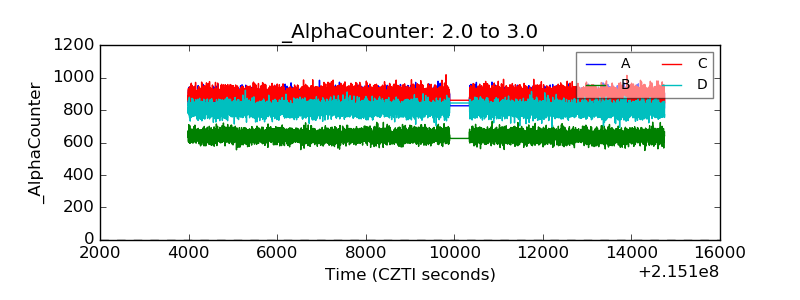 |
| _CPM_Rate | 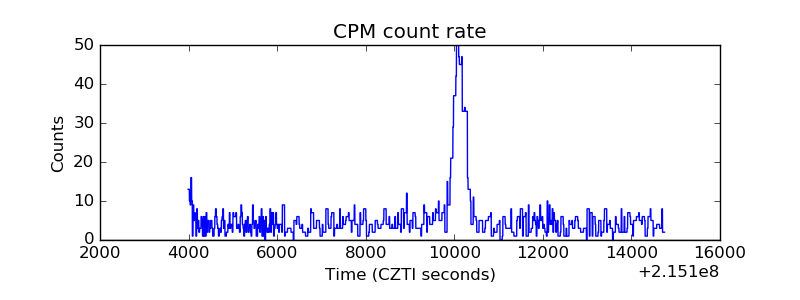 |
| CZT Counter | 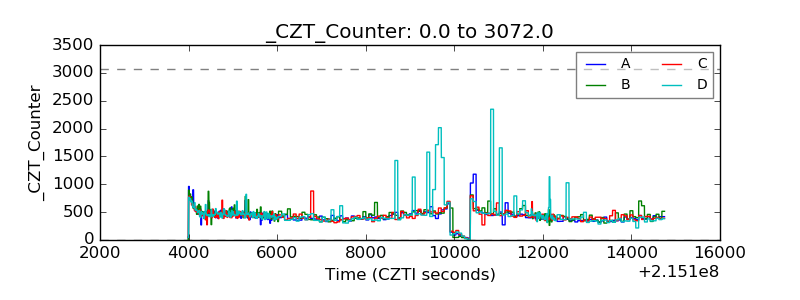 |
| +2.5 Volts monitor |  |
| +5 Volts monitor |  |
| _ROLL_ROT | 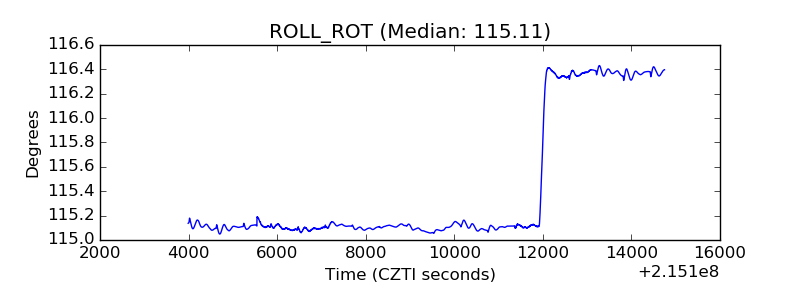 |
| _Roll_DEC | 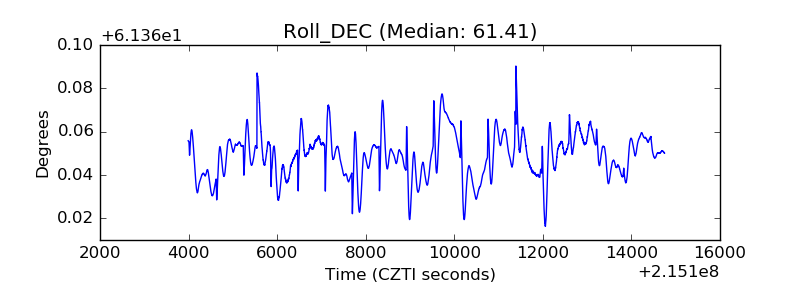 |
| _Roll_RA | 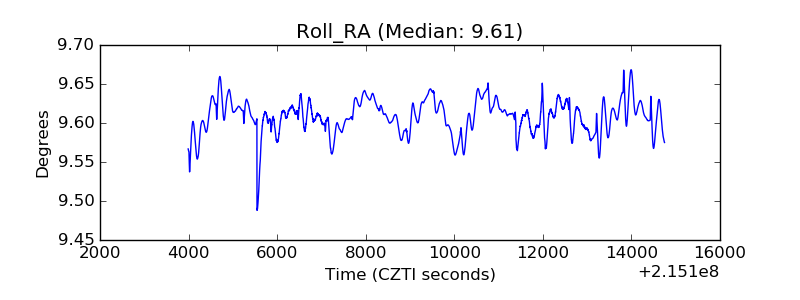 |
| Veto Counter | 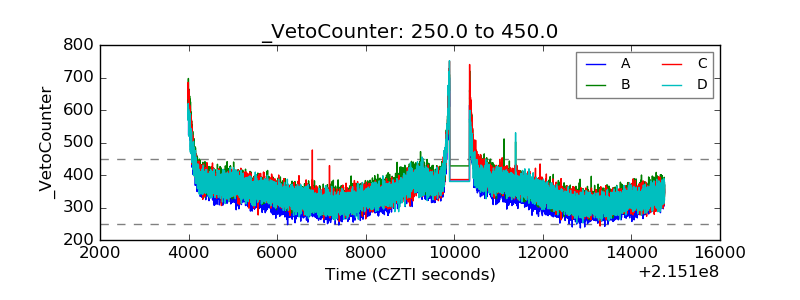 |