| Param | Original file | Final file |
|---|---|---|
| Filename | modeM0/AS1G06_052T01_9000000754_05827cztM0_level2.evt | modeM0/AS1G06_052T01_9000000754_05827cztM0_level2_quad_clean.evt |
| Size (bytes) | 591,914,880 | 119,341,440 |
| Size | 564.5 MB | 113.8 MB |
| Events in quadrant A | 4,582,996 | 750,883 |
| Events in quadrant B | 4,678,625 | 760,401 |
| Events in quadrant C | 3,992,216 | 760,080 |
| Events in quadrant D | 4,075,750 | 732,648 |
| Mode M9 | |||
|---|---|---|---|
| Quadrant | BADHDUFLAG | Total packets | Discarded packets |
| A | 0 | 14 | 0 |
| B | 0 | 14 | 0 |
| C | 0 | 14 | 0 |
| D | 0 | 14 | 0 |
| Mode SS | |||
|---|---|---|---|
| Quadrant | BADHDUFLAG | Total packets | Discarded packets |
| A | 0 | 182 | 0 |
| B | 0 | 182 | 0 |
| C | 0 | 182 | 0 |
| D | 0 | 182 | 0 |
| Mode M0 | |||
|---|---|---|---|
| Quadrant | BADHDUFLAG | Total packets | Discarded packets |
| A | 0 | 19646 | 3 |
| B | 0 | 20029 | 2 |
| C | 0 | 18230 | 2 |
| D | 0 | 18638 | 2 |
| Quadrant | Total seconds | Saturated seconds | Saturation percentage |
|---|---|---|---|
| A | 8786 | 67 | 0.762577% |
| B | 8786 | 49 | 0.557705% |
| C | 8786 | 39 | 0.443888% |
| D | 8786 | 35 | 0.398361% |
Noise dominated data is calculated using 1-second bins in cleaned event files. If a bin has >2000 counts, and if more than 50% of those come from <1% of pixels, then it is considered to be noise-dominated and hence unusable.
| Quadrant | # 1 sec bins | Bins with >0 counts | Bins with >2000 counts | High rate bins dominated by noise | Noise dominated (total time) | Noise dominated (detector-on time) | Marked lightcurve |
|---|---|---|---|---|---|---|---|
| A | 10286 | 8788 | 23 | 23 | 0.22% | 0.26% | 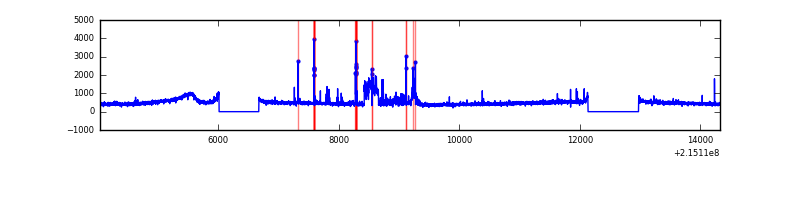 |
| B | 10286 | 8788 | 5 | 5 | 0.05% | 0.06% | 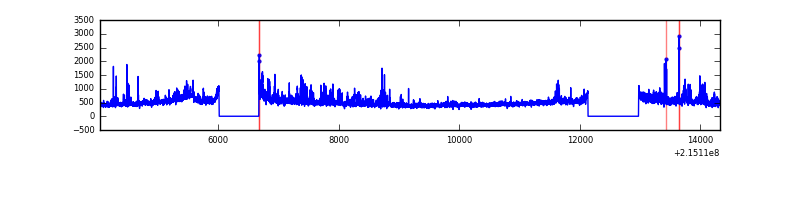 |
| C | 10286 | 8788 | 1 | 1 | 0.01% | 0.01% | 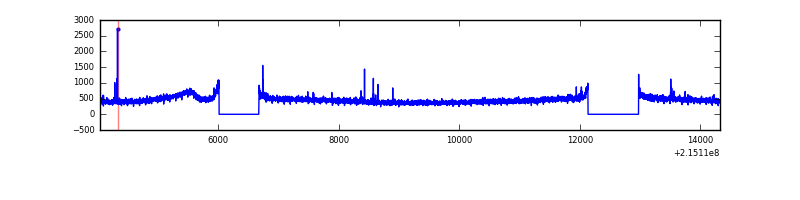 |
| D | 10286 | 8788 | 9 | 9 | 0.09% | 0.10% | 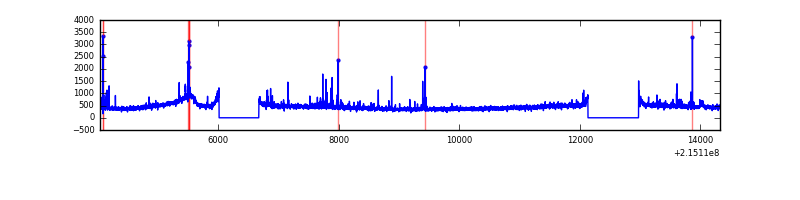 |
Top three noisy pixels from each quadrant. If the there are fewer than three noisy pixels in the level2.evt file, extra rows are filled as -1
| Pixel properties | Quadrant properties | ||||||
|---|---|---|---|---|---|---|---|
| Quadrant | DetID | PixID | Counts | Sigma | Mean | Median | Sigma |
| A | 15 | 236 | 343588 | 1591.44 | 1054 | 1031 | 215.2 |
| A | 0 | 50 | 79566 | 364.85 | 1054 | 1031 | 215.2 |
| A | 15 | 174 | 46850 | 212.86 | 1054 | 1031 | 215.2 |
| B | 15 | 204 | 495709 | 2484.46 | 1044 | 1021 | 199.1 |
| B | 0 | 219 | 46291 | 227.36 | 1044 | 1021 | 199.1 |
| B | 0 | 214 | 39492 | 193.21 | 1044 | 1021 | 199.1 |
| C | 1 | 16 | 29879 | 123.25 | 1013 | 1019 | 234.2 |
| C | 13 | 61 | 7923 | 29.48 | 1013 | 1019 | 234.2 |
| C | 9 | 16 | 4134 | 13.3 | 1013 | 1019 | 234.2 |
| D | 12 | 233 | 53979 | 208.66 | 1030 | 998 | 253.9 |
| D | 2 | 63 | 38068 | 146.0 | 1030 | 998 | 253.9 |
| D | 11 | 241 | 27469 | 104.25 | 1030 | 998 | 253.9 |
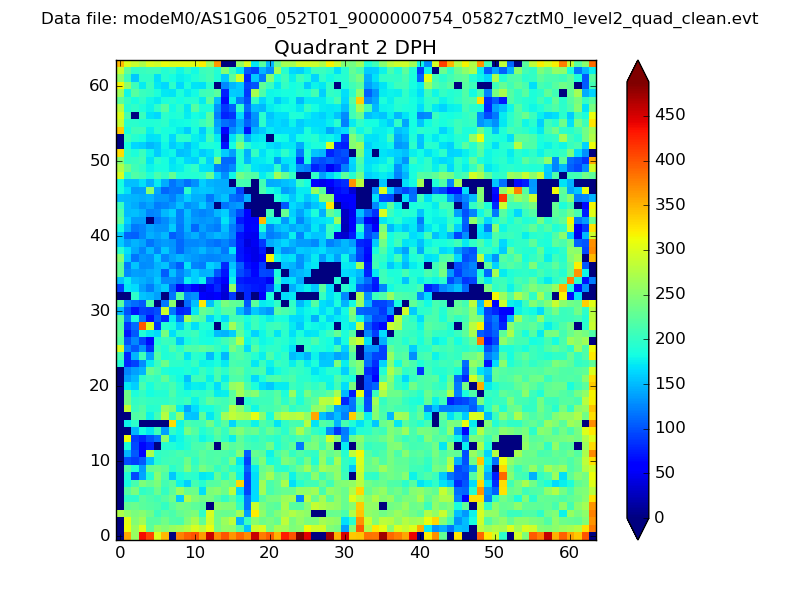
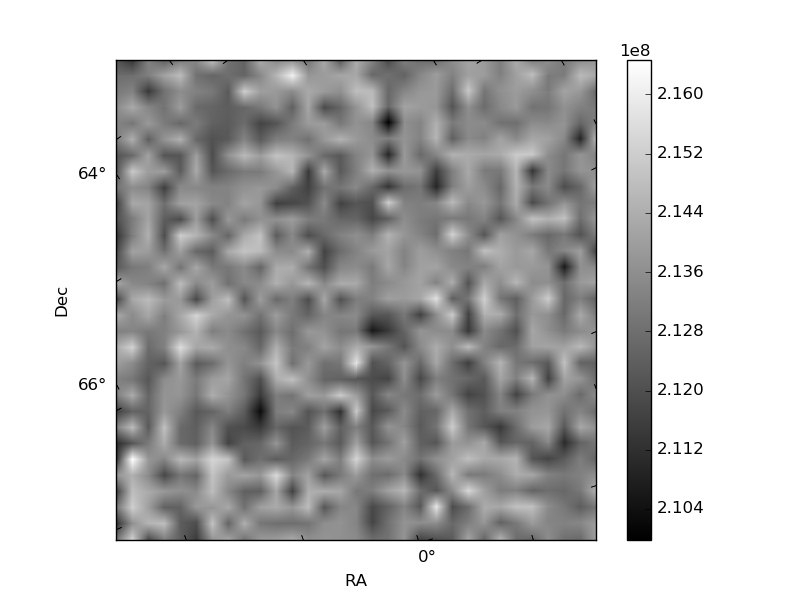
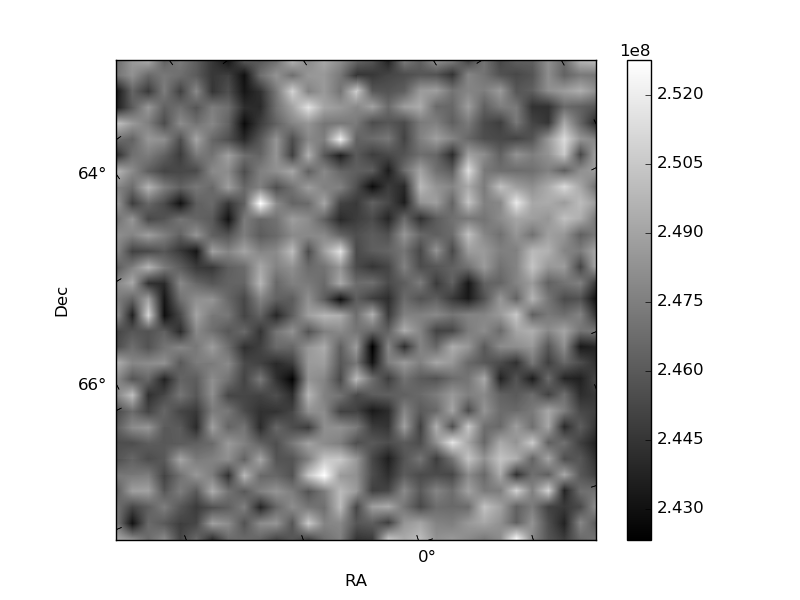
Histogram calculated using DETX and DETY for each event in the final _common_clean file
| Quadrant A | 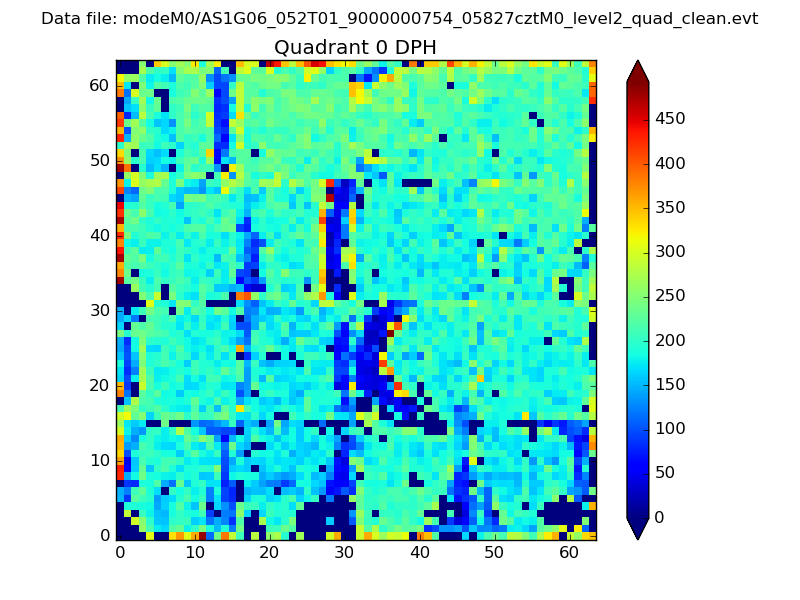 |
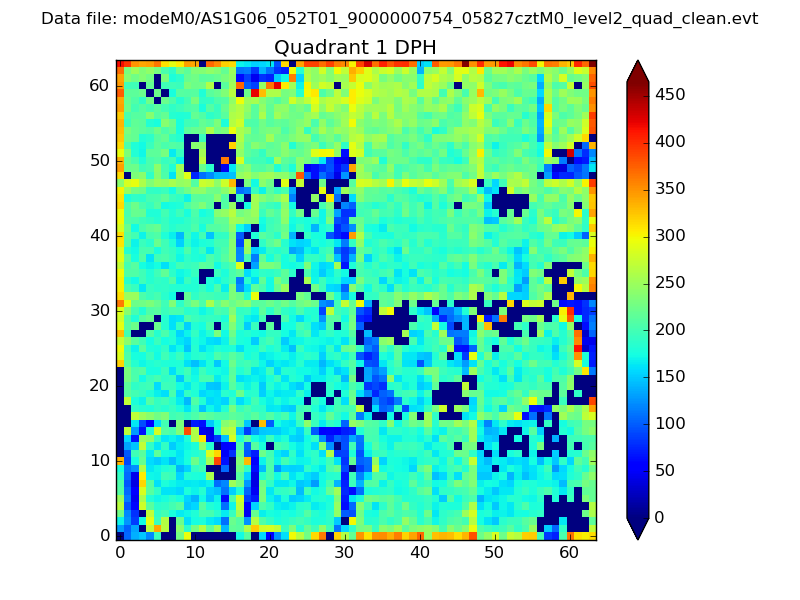 |
Quadrant B |
|---|---|---|---|
| Quadrant D | 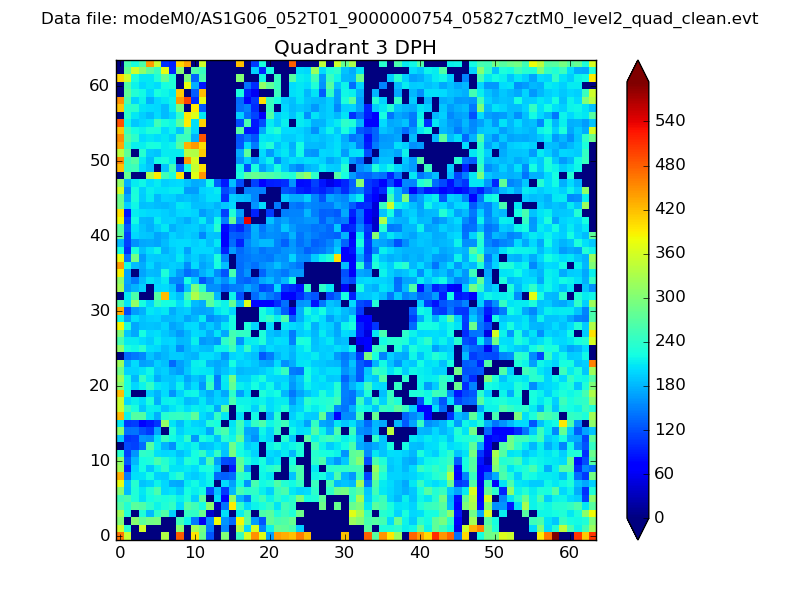 |
 |
Quadrant C |
| Plot type | Count rate plots | Images |
|---|---|---|
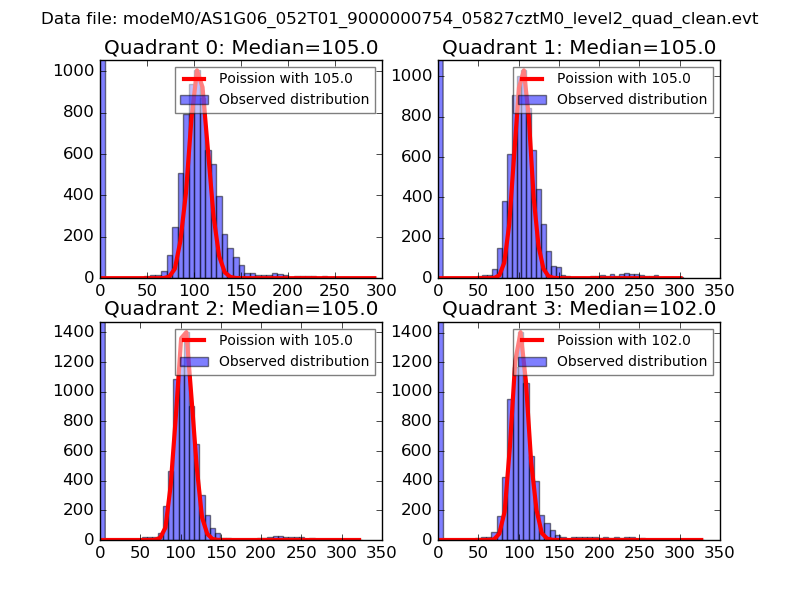
| Comparison with Poisson distribution Blue bars denote a histogram of data divided into 1 sec bins. Red curve is a Poisson curve with rate = median count rate of data. |
 |
 |
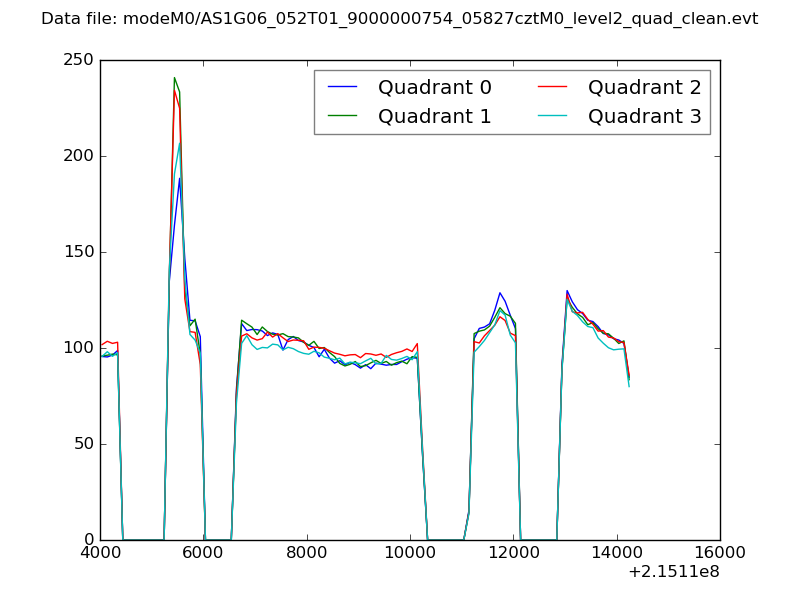
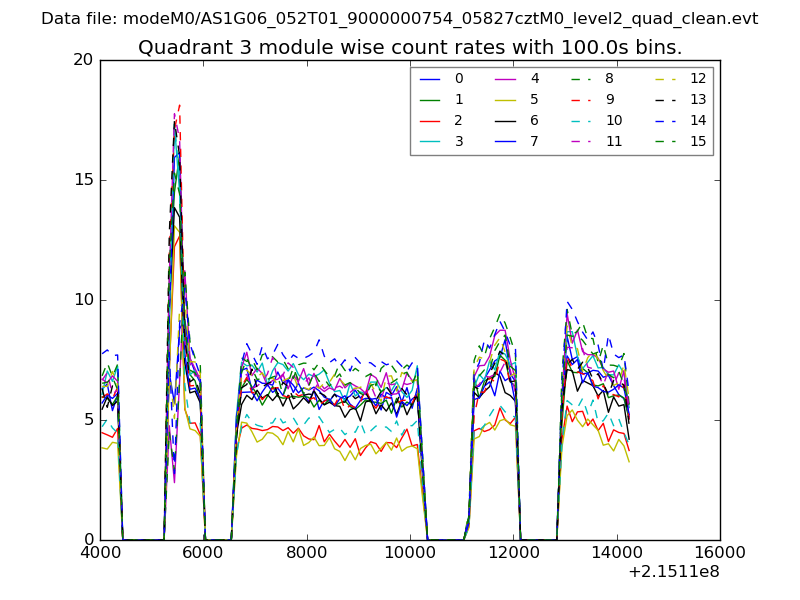
| Quadrant-wise count rates Data is divided into 100 sec bins |
 |
|
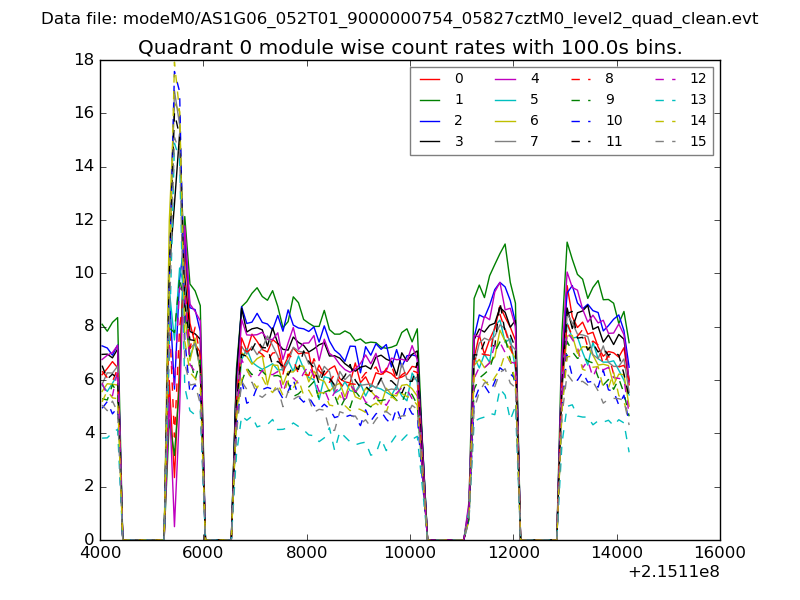
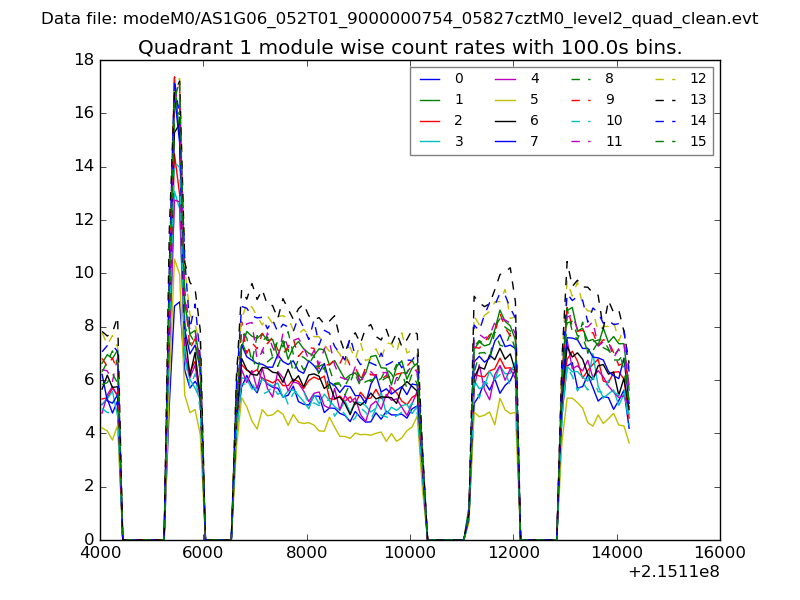
| Module-wise count rates for Quadrant A Data is divided into 100 sec bins |
 |
 |
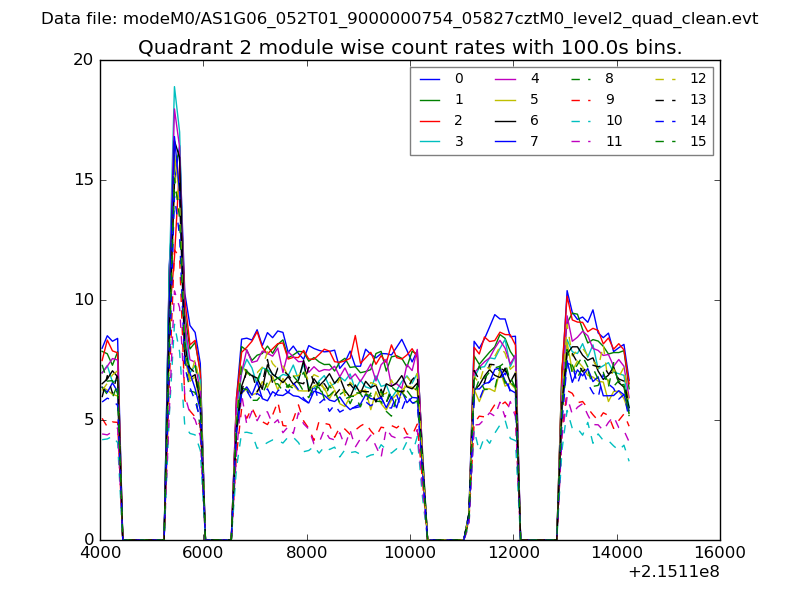
| Module-wise count rates for Quadrant B Data is divided into 100 sec bins |
 |
 |
| Module-wise count rates for Quadrant C Data is divided into 100 sec bins |
 |
 |
| Module-wise count rates for Quadrant D Data is divided into 100 sec bins |
 |
 |
| Parameter | Plot |
|---|---|
| CZT HV Monitor | 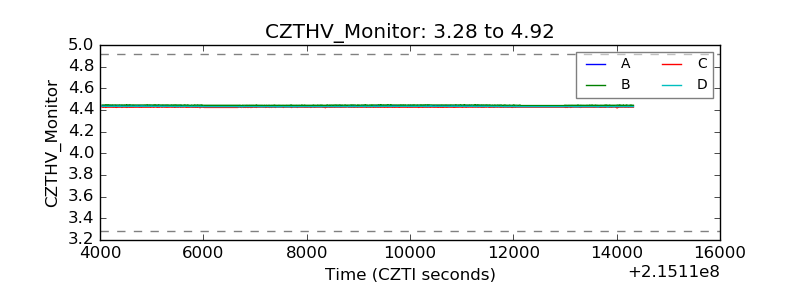 |
| D_VDD | 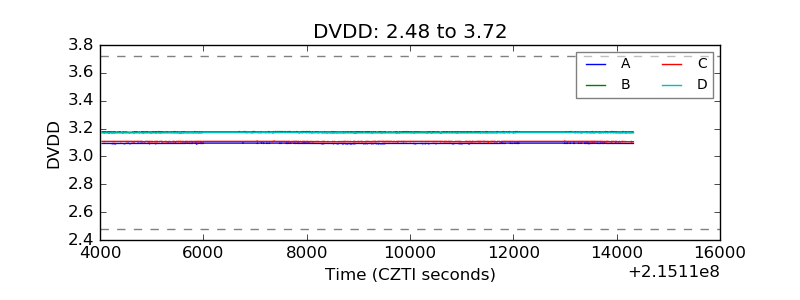 |
| Temperature 1 | 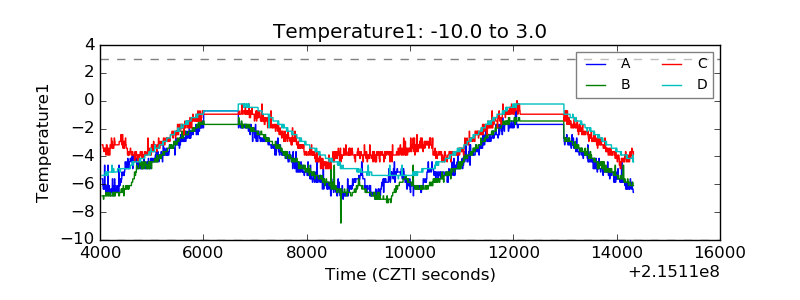 |
| Veto HV Monitor | 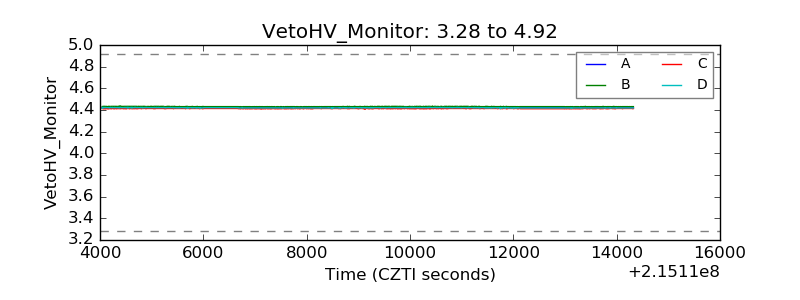 |
| Veto LLD | 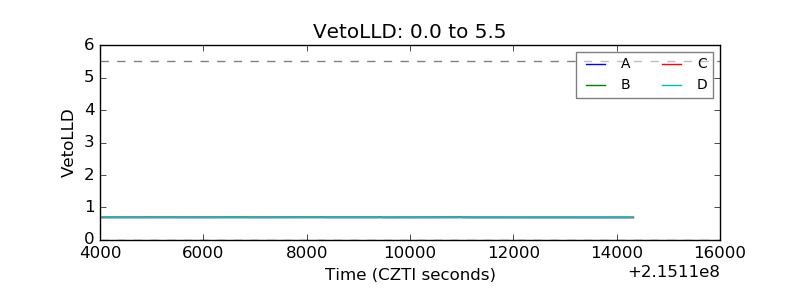 |
| Alpha Counter |  |
| _CPM_Rate | 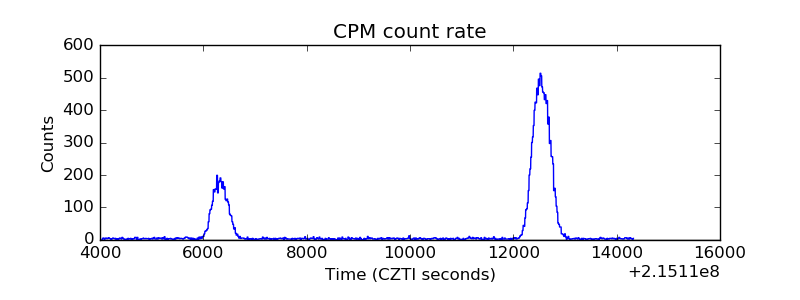 |
| CZT Counter | 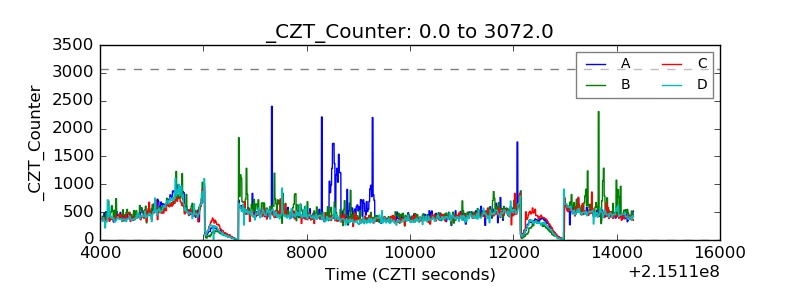 |
| +2.5 Volts monitor |  |
| +5 Volts monitor |  |
| _ROLL_ROT | 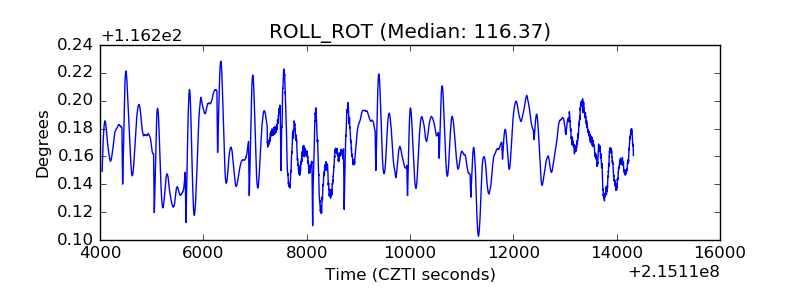 |
| _Roll_DEC | 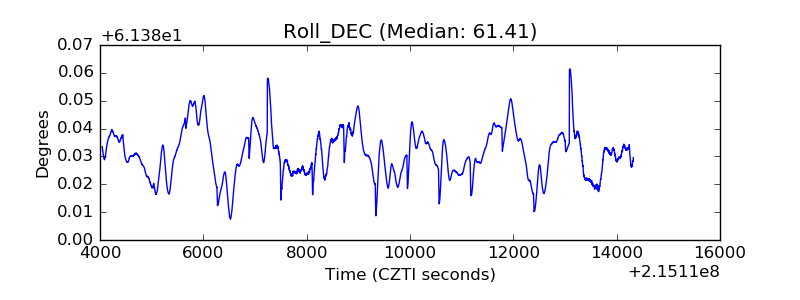 |
| _Roll_RA | 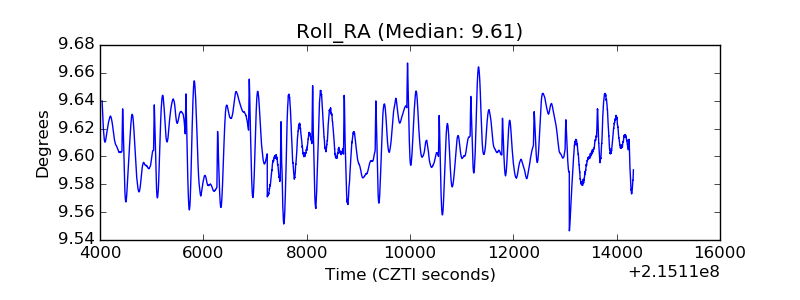 |
| Veto Counter | 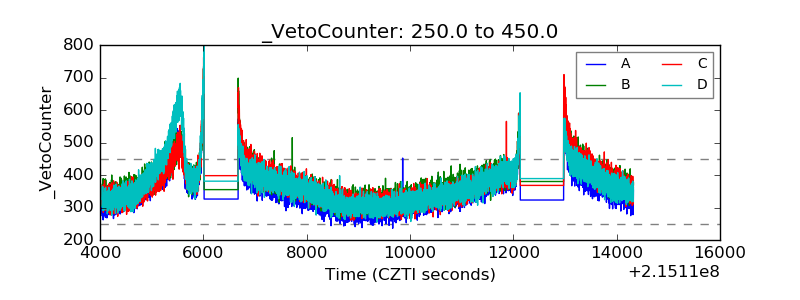 |