| Param | Original file | Final file |
|---|---|---|
| Filename | modeM0/AS1G06_052T01_9000000754_05830cztM0_level2.evt | modeM0/AS1G06_052T01_9000000754_05830cztM0_level2_quad_clean.evt |
| Size (bytes) | 452,125,440 | 103,000,320 |
| Size | 431.2 MB | 98.2 MB |
| Events in quadrant A | 3,091,306 | 673,640 |
| Events in quadrant B | 3,301,567 | 663,588 |
| Events in quadrant C | 3,072,170 | 666,541 |
| Events in quadrant D | 3,766,347 | 642,812 |
| Mode M9 | |||
|---|---|---|---|
| Quadrant | BADHDUFLAG | Total packets | Discarded packets |
| A | 0 | 21 | 0 |
| B | 0 | 21 | 0 |
| C | 0 | 21 | 0 |
| D | 0 | 21 | 0 |
| Mode SS | |||
|---|---|---|---|
| Quadrant | BADHDUFLAG | Total packets | Discarded packets |
| A | 0 | 140 | 0 |
| B | 0 | 140 | 0 |
| C | 0 | 140 | 0 |
| D | 0 | 140 | 0 |
| Mode M0 | |||
|---|---|---|---|
| Quadrant | BADHDUFLAG | Total packets | Discarded packets |
| A | 0 | 14170 | 3 |
| B | 0 | 14632 | 2 |
| C | 0 | 14111 | 2 |
| D | 0 | 16062 | 2 |
| Quadrant | Total seconds | Saturated seconds | Saturation percentage |
|---|---|---|---|
| A | 6784 | 44 | 0.648585% |
| B | 6784 | 76 | 1.120283% |
| C | 6784 | 43 | 0.633844% |
| D | 6784 | 109 | 1.606722% |
Noise dominated data is calculated using 1-second bins in cleaned event files. If a bin has >2000 counts, and if more than 50% of those come from <1% of pixels, then it is considered to be noise-dominated and hence unusable.
| Quadrant | # 1 sec bins | Bins with >0 counts | Bins with >2000 counts | High rate bins dominated by noise | Noise dominated (total time) | Noise dominated (detector-on time) | Marked lightcurve |
|---|---|---|---|---|---|---|---|
| A | 8884 | 6786 | 2 | 2 | 0.02% | 0.03% | 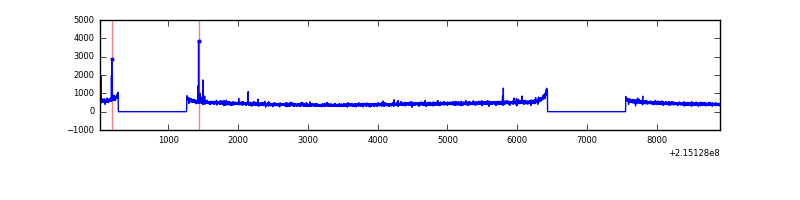 |
| B | 8884 | 6786 | 1 | 1 | 0.01% | 0.01% | 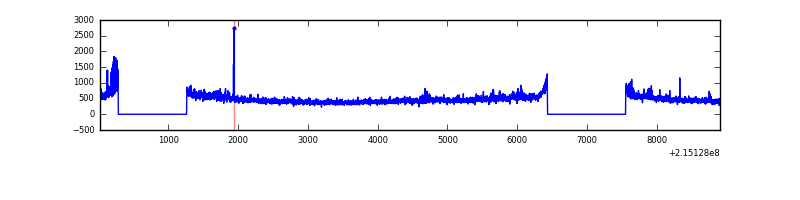 |
| C | 8884 | 6786 | 5 | 5 | 0.06% | 0.07% | 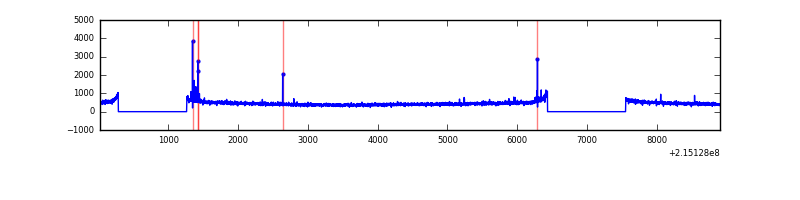 |
| D | 8884 | 6786 | 80 | 80 | 0.90% | 1.18% | 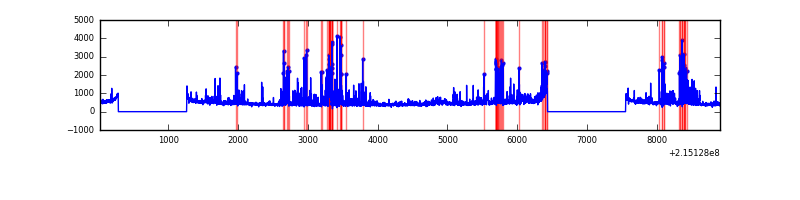 |
Top three noisy pixels from each quadrant. If the there are fewer than three noisy pixels in the level2.evt file, extra rows are filled as -1
| Pixel properties | Quadrant properties | ||||||
|---|---|---|---|---|---|---|---|
| Quadrant | DetID | PixID | Counts | Sigma | Mean | Median | Sigma |
| A | 15 | 223 | 30967 | 188.18 | 789 | 772 | 160.5 |
| A | 8 | 15 | 13015 | 76.3 | 789 | 772 | 160.5 |
| A | 0 | 226 | 7745 | 43.46 | 789 | 772 | 160.5 |
| B | 15 | 204 | 135662 | 897.1 | 796 | 776 | 150.4 |
| B | 0 | 214 | 31363 | 203.43 | 796 | 776 | 150.4 |
| B | 0 | 219 | 27062 | 174.82 | 796 | 776 | 150.4 |
| C | 1 | 16 | 42928 | 235.89 | 773 | 777 | 178.7 |
| C | 12 | 4 | 10052 | 51.9 | 773 | 777 | 178.7 |
| C | 13 | 61 | 6212 | 30.42 | 773 | 777 | 178.7 |
| D | 2 | 152 | 559608 | 2993.34 | 765 | 740 | 186.7 |
| D | 13 | 105 | 115765 | 616.08 | 765 | 740 | 186.7 |
| D | 11 | 241 | 61088 | 323.23 | 765 | 740 | 186.7 |
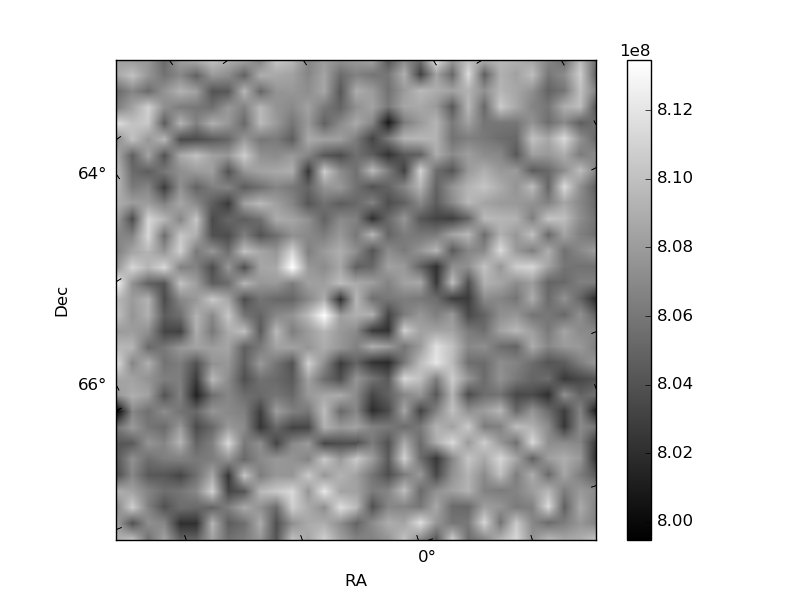
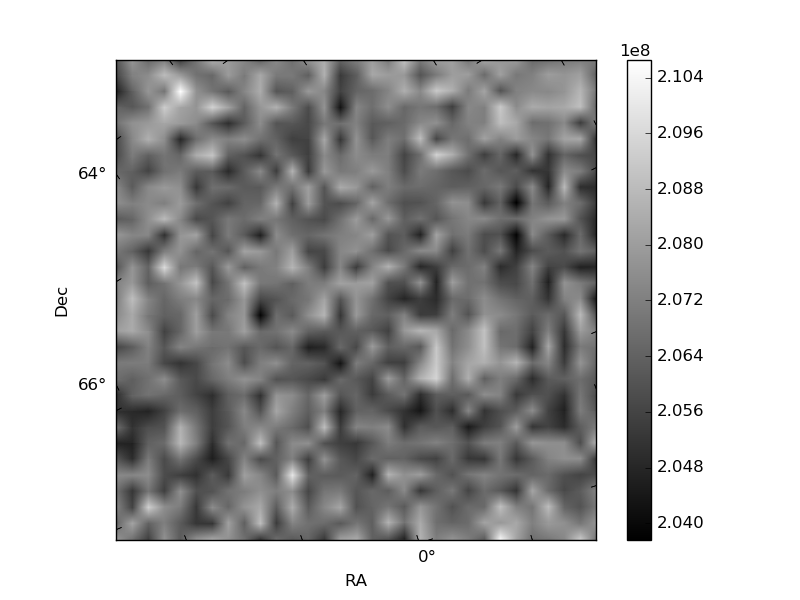
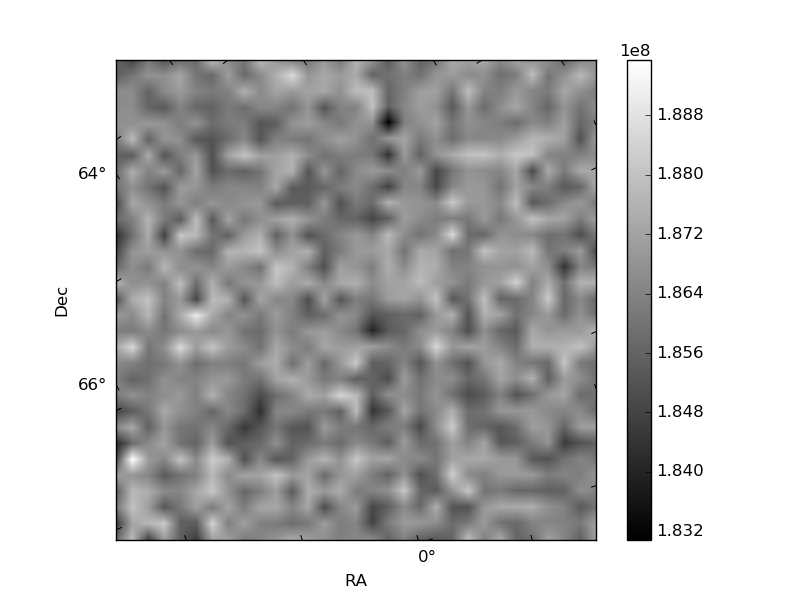
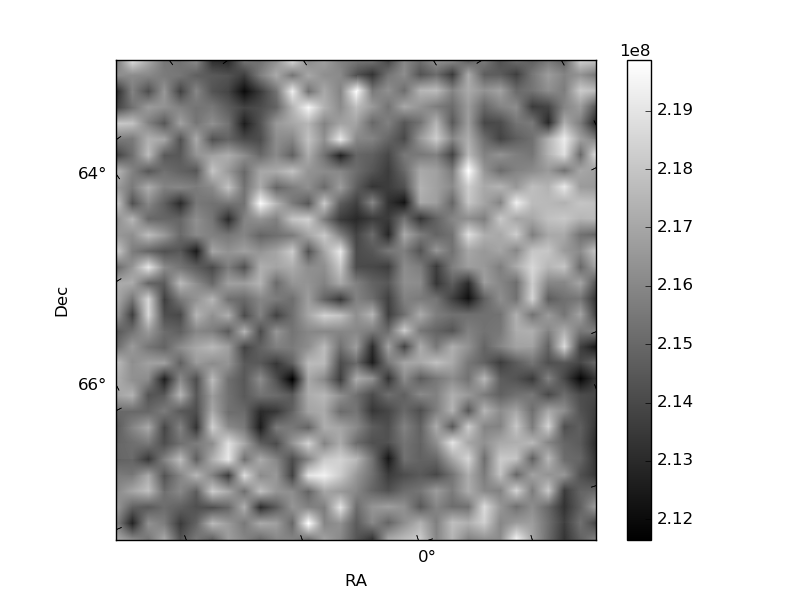
Histogram calculated using DETX and DETY for each event in the final _common_clean file
| Quadrant A | 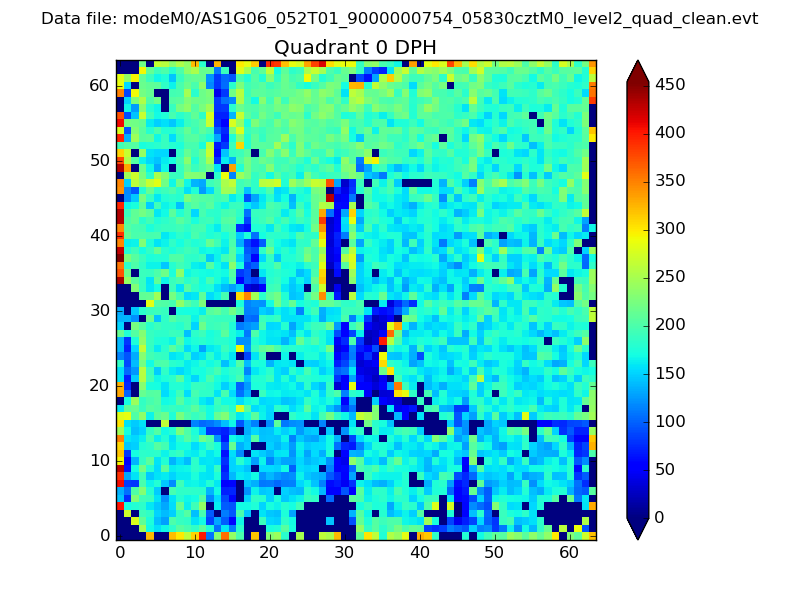 |
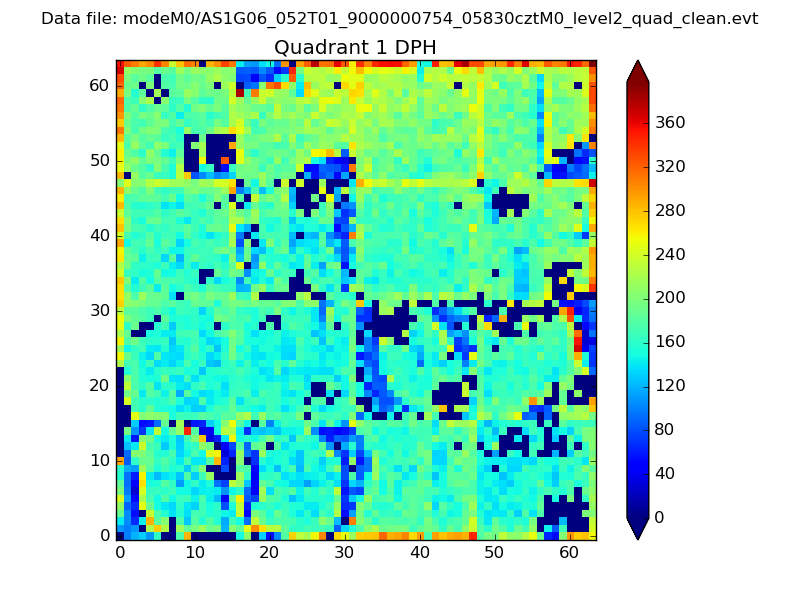 |
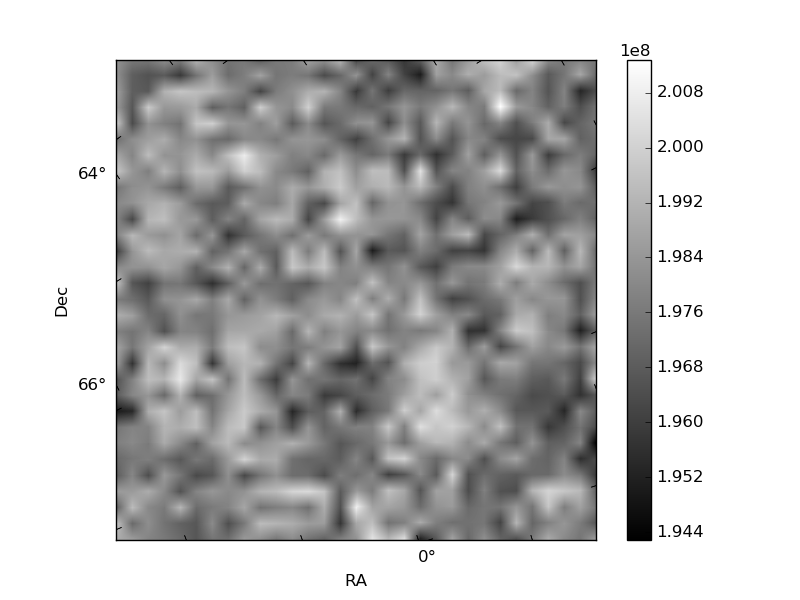
Quadrant B |
|---|---|---|---|
| Quadrant D | 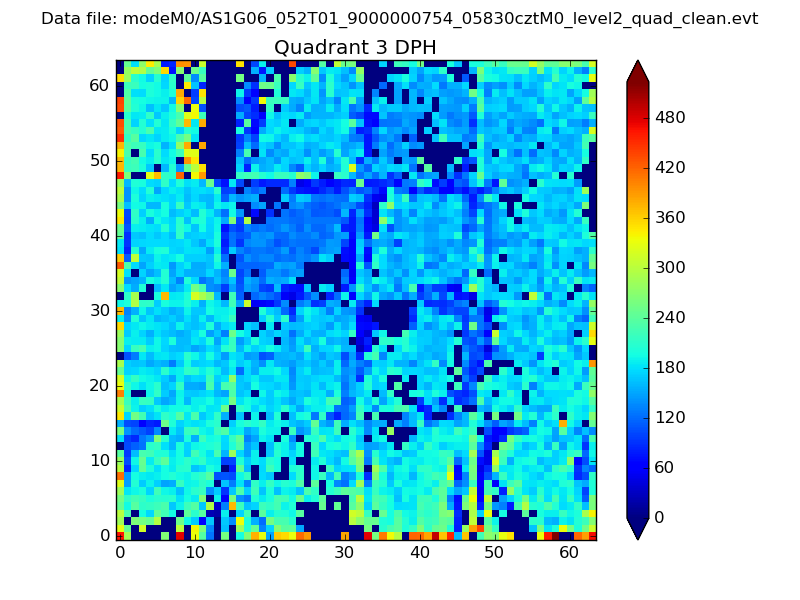 |
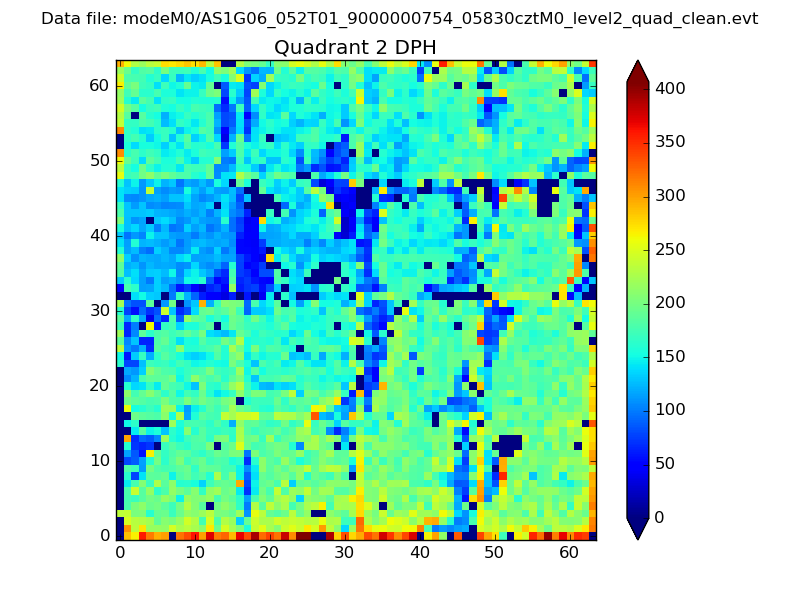 |
Quadrant C |
| Plot type | Count rate plots | Images |
|---|---|---|
| Comparison with Poisson distribution Blue bars denote a histogram of data divided into 1 sec bins. Red curve is a Poisson curve with rate = median count rate of data. |
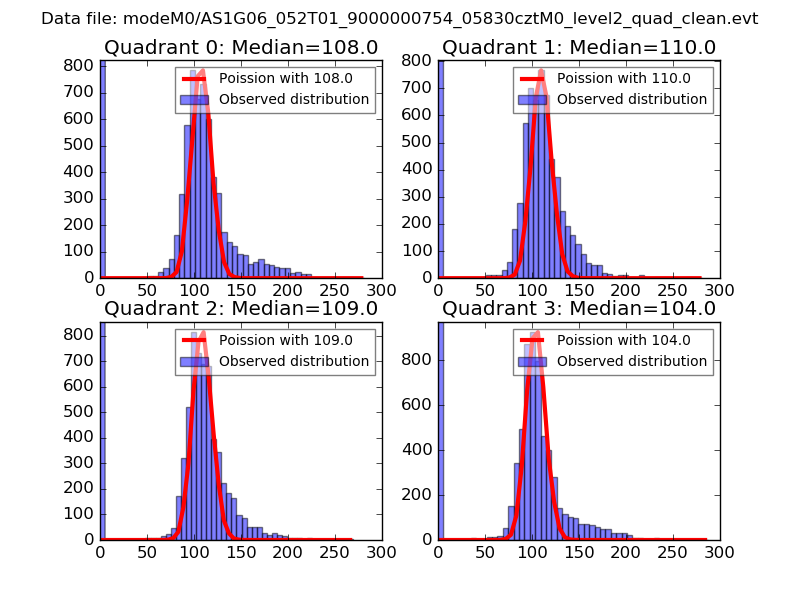 |
 |
| Quadrant-wise count rates Data is divided into 100 sec bins |
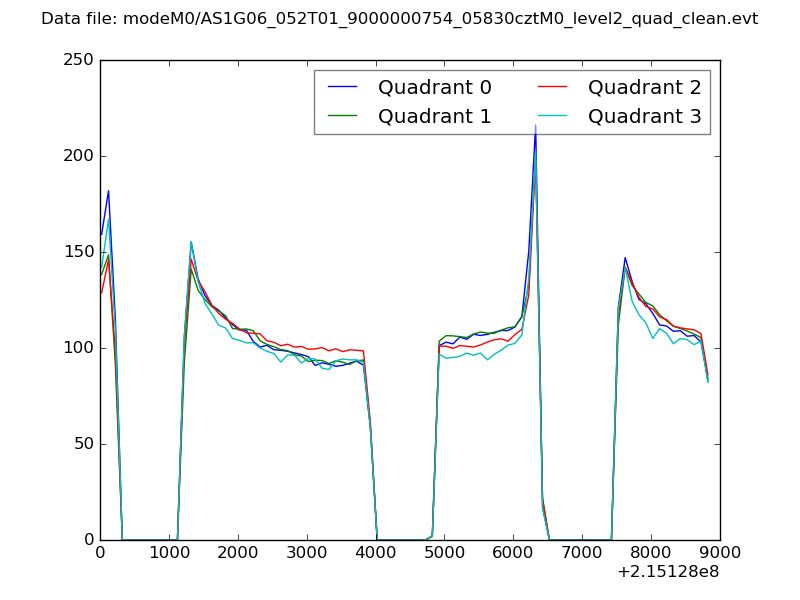 |
|
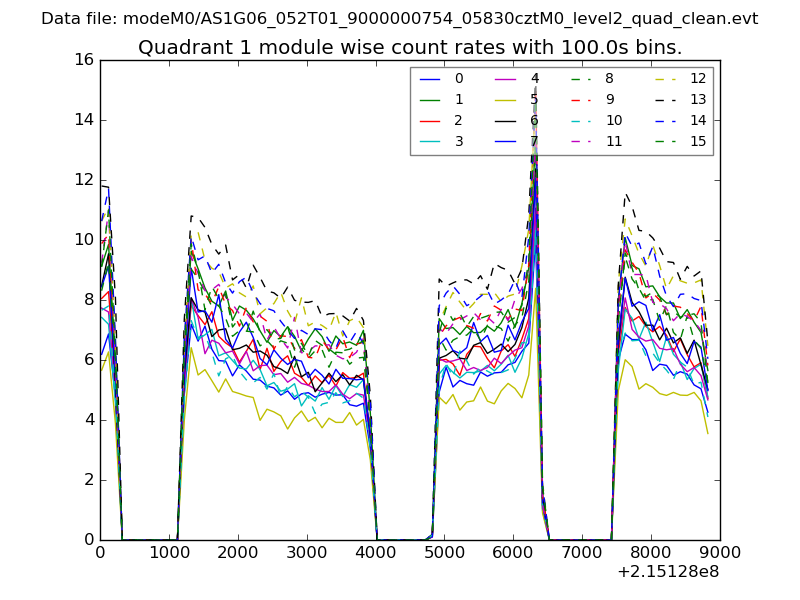
| Module-wise count rates for Quadrant A Data is divided into 100 sec bins |
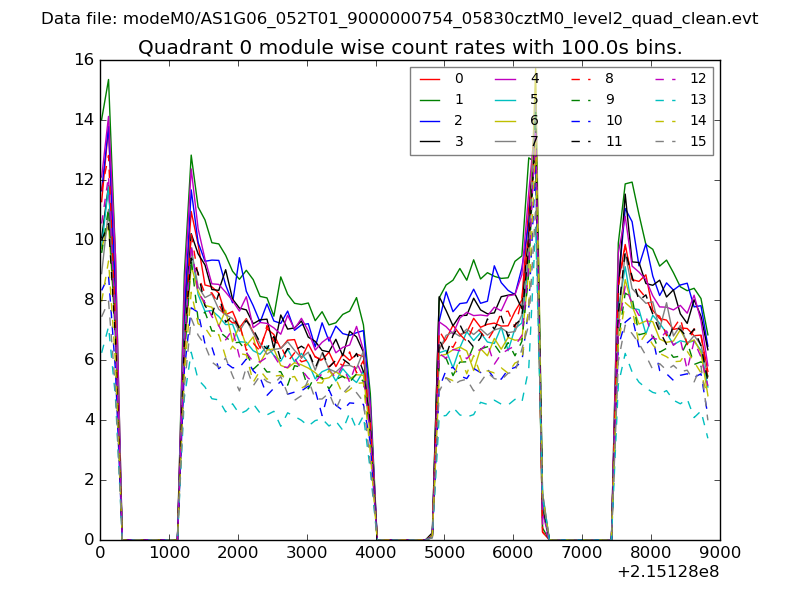 |
 |
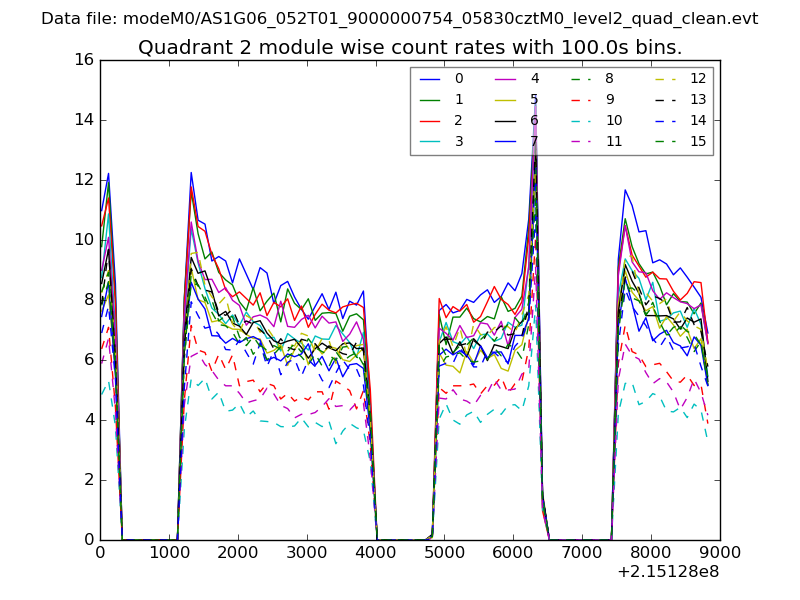
| Module-wise count rates for Quadrant B Data is divided into 100 sec bins |
 |
 |
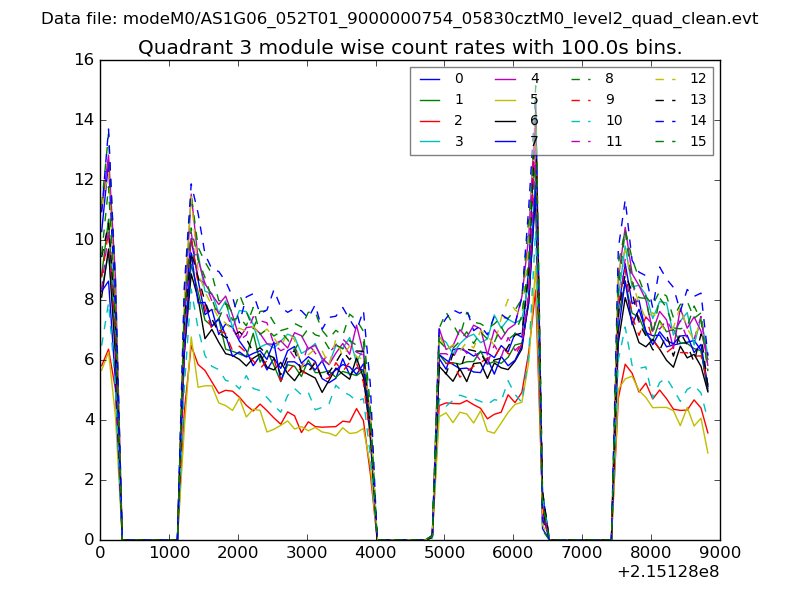
| Module-wise count rates for Quadrant C Data is divided into 100 sec bins |
 |
 |
| Module-wise count rates for Quadrant D Data is divided into 100 sec bins |
 |
 |
| Parameter | Plot |
|---|---|
| CZT HV Monitor | 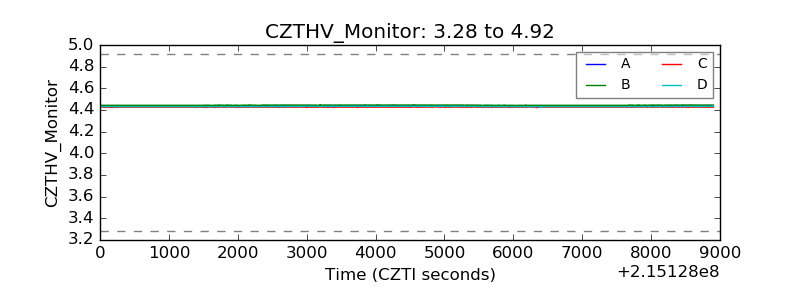 |
| D_VDD | 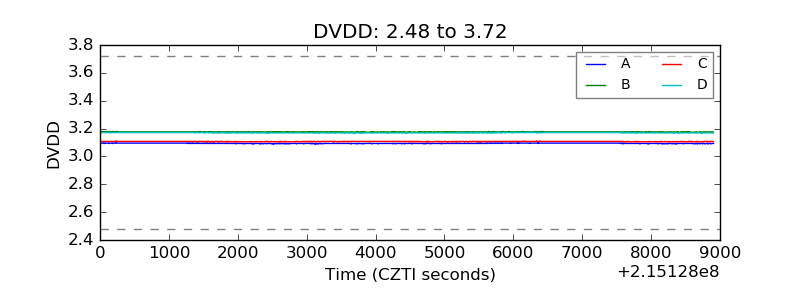 |
| Temperature 1 |  |
| Veto HV Monitor | 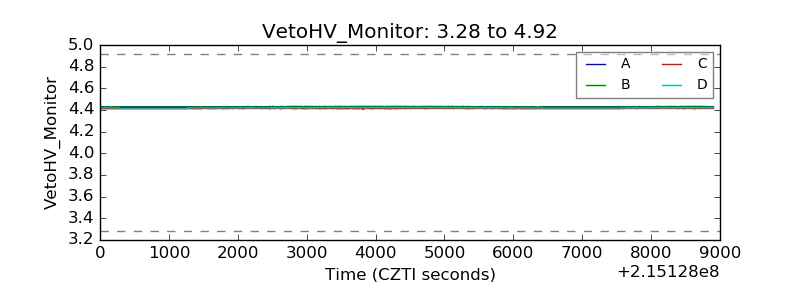 |
| Veto LLD |  |
| Alpha Counter | 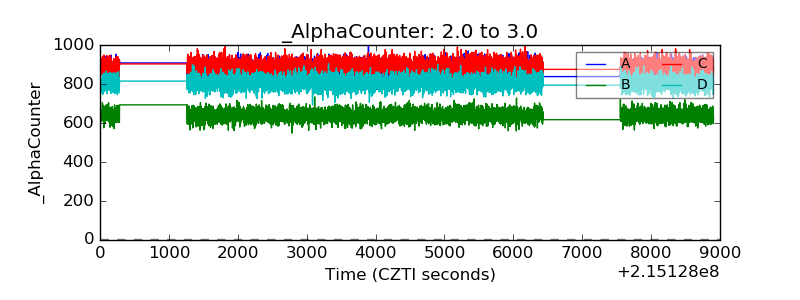 |
| _CPM_Rate | 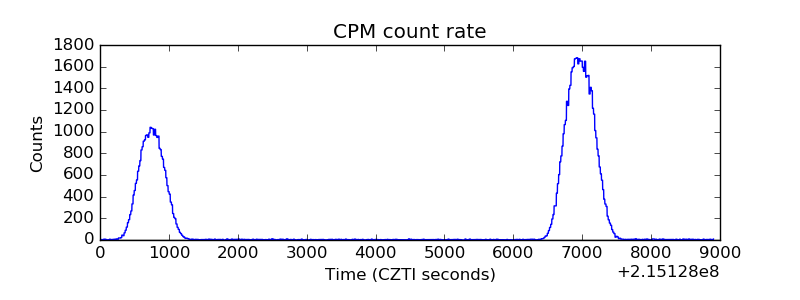 |
| CZT Counter | 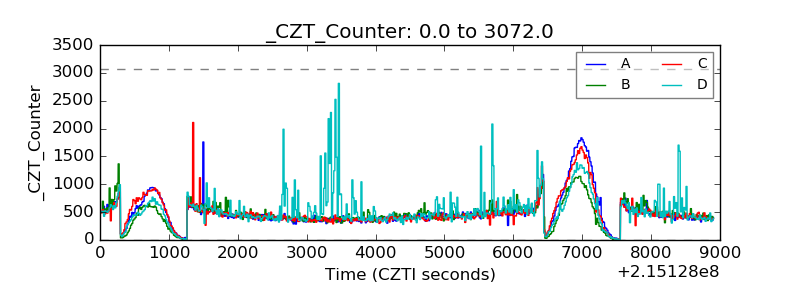 |
| +2.5 Volts monitor |  |
| +5 Volts monitor |  |
| _ROLL_ROT | 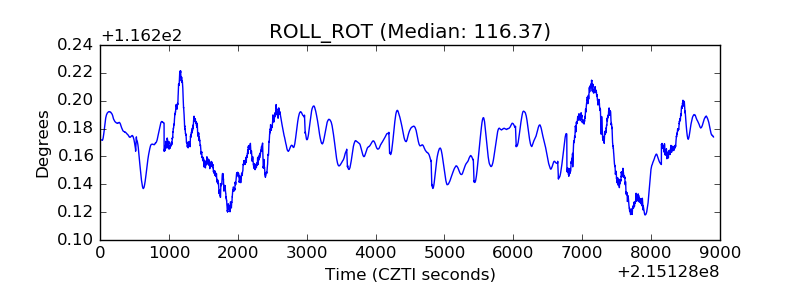 |
| _Roll_DEC | 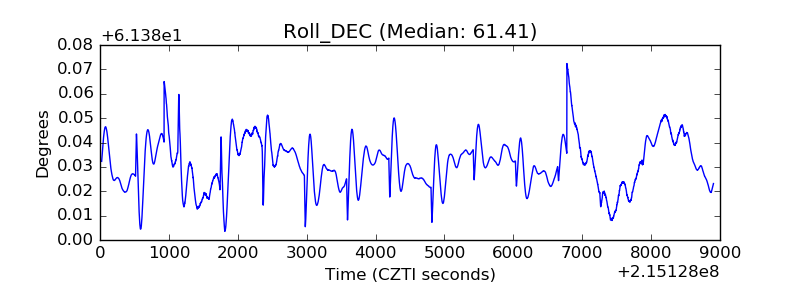 |
| _Roll_RA | 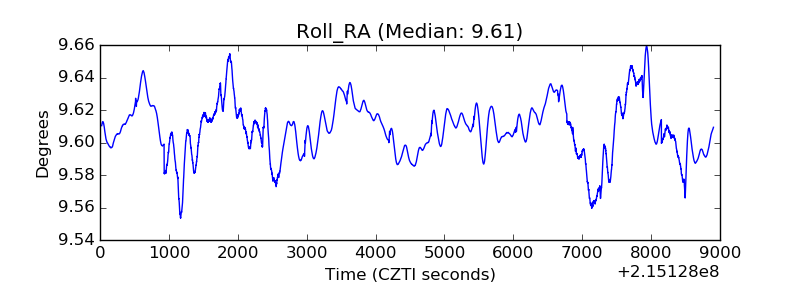 |
| Veto Counter | 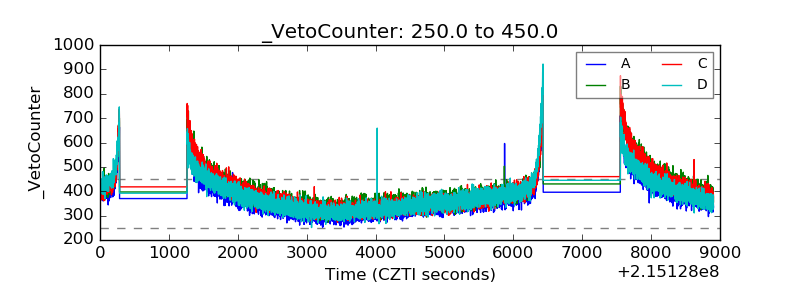 |