| Param | Original file | Final file |
|---|---|---|
| Filename | modeM0/AS1G06_052T01_9000000754_05831cztM0_level2.evt | modeM0/AS1G06_052T01_9000000754_05831cztM0_level2_quad_clean.evt |
| Size (bytes) | 441,961,920 | 103,455,360 |
| Size | 421.5 MB | 98.7 MB |
| Events in quadrant A | 3,072,389 | 676,537 |
| Events in quadrant B | 3,185,192 | 679,904 |
| Events in quadrant C | 3,027,874 | 672,639 |
| Events in quadrant D | 3,648,814 | 642,143 |
| Mode M9 | |||
|---|---|---|---|
| Quadrant | BADHDUFLAG | Total packets | Discarded packets |
| A | 0 | 23 | 0 |
| B | 0 | 23 | 0 |
| C | 0 | 23 | 0 |
| D | 0 | 23 | 0 |
| Mode SS | |||
|---|---|---|---|
| Quadrant | BADHDUFLAG | Total packets | Discarded packets |
| A | 0 | 136 | 0 |
| B | 0 | 136 | 0 |
| C | 0 | 136 | 0 |
| D | 0 | 136 | 0 |
| Mode M0 | |||
|---|---|---|---|
| Quadrant | BADHDUFLAG | Total packets | Discarded packets |
| A | 0 | 13911 | 3 |
| B | 0 | 14024 | 2 |
| C | 0 | 13792 | 2 |
| D | 0 | 15626 | 2 |
| Quadrant | Total seconds | Saturated seconds | Saturation percentage |
|---|---|---|---|
| A | 6627 | 55 | 0.829938% |
| B | 6627 | 64 | 0.965746% |
| C | 6627 | 44 | 0.663951% |
| D | 6627 | 129 | 1.946582% |
Noise dominated data is calculated using 1-second bins in cleaned event files. If a bin has >2000 counts, and if more than 50% of those come from <1% of pixels, then it is considered to be noise-dominated and hence unusable.
| Quadrant | # 1 sec bins | Bins with >0 counts | Bins with >2000 counts | High rate bins dominated by noise | Noise dominated (total time) | Noise dominated (detector-on time) | Marked lightcurve |
|---|---|---|---|---|---|---|---|
| A | 8952 | 6629 | 0 | 0 | 0.00% | 0.00% | 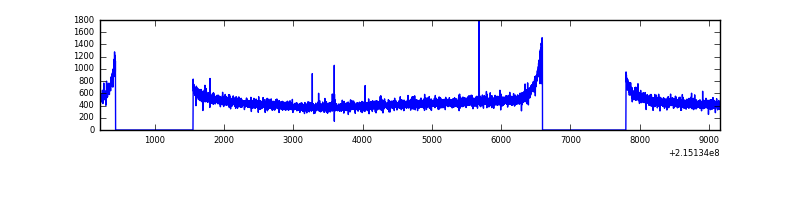 |
| B | 8952 | 6629 | 0 | 0 | 0.00% | 0.00% | 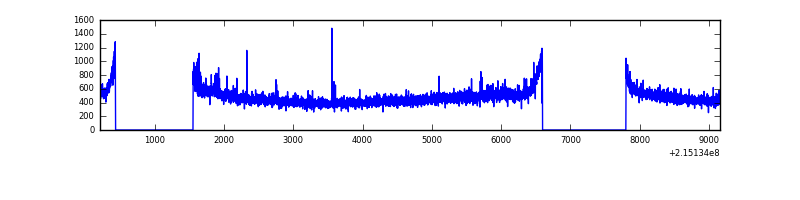 |
| C | 8952 | 6629 | 1 | 1 | 0.01% | 0.02% | 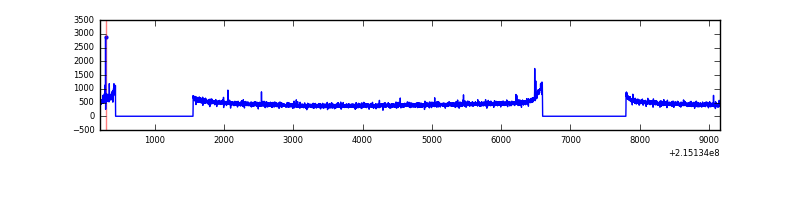 |
| D | 8952 | 6629 | 56 | 56 | 0.63% | 0.84% | 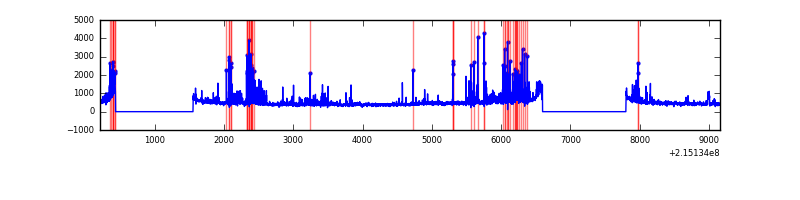 |
Top three noisy pixels from each quadrant. If the there are fewer than three noisy pixels in the level2.evt file, extra rows are filled as -1
| Pixel properties | Quadrant properties | ||||||
|---|---|---|---|---|---|---|---|
| Quadrant | DetID | PixID | Counts | Sigma | Mean | Median | Sigma |
| A | 15 | 223 | 10506 | 60.56 | 793 | 776 | 160.6 |
| A | 8 | 15 | 8642 | 48.96 | 793 | 776 | 160.6 |
| A | 0 | 226 | 7808 | 43.77 | 793 | 776 | 160.6 |
| B | 15 | 204 | 55244 | 361.44 | 795 | 776 | 150.7 |
| B | 4 | 80 | 28383 | 183.19 | 795 | 776 | 150.7 |
| B | 12 | 111 | 13390 | 83.7 | 795 | 776 | 150.7 |
| C | 1 | 16 | 19865 | 107.82 | 767 | 772 | 177.1 |
| C | 14 | 67 | 8081 | 41.27 | 767 | 772 | 177.1 |
| C | 13 | 61 | 6313 | 31.29 | 767 | 772 | 177.1 |
| D | 2 | 152 | 457723 | 2449.28 | 760 | 735 | 186.6 |
| D | 11 | 241 | 146768 | 782.68 | 760 | 735 | 186.6 |
| D | 1 | 239 | 78609 | 417.37 | 760 | 735 | 186.6 |
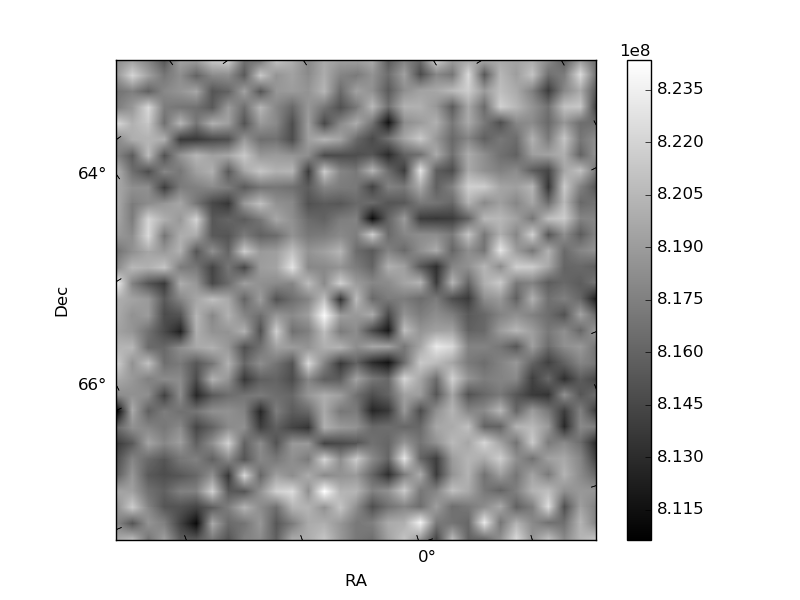
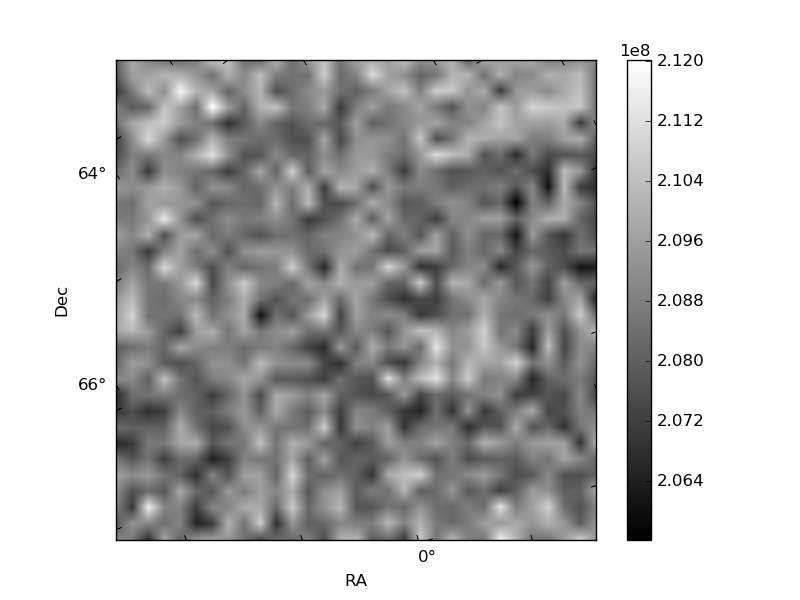
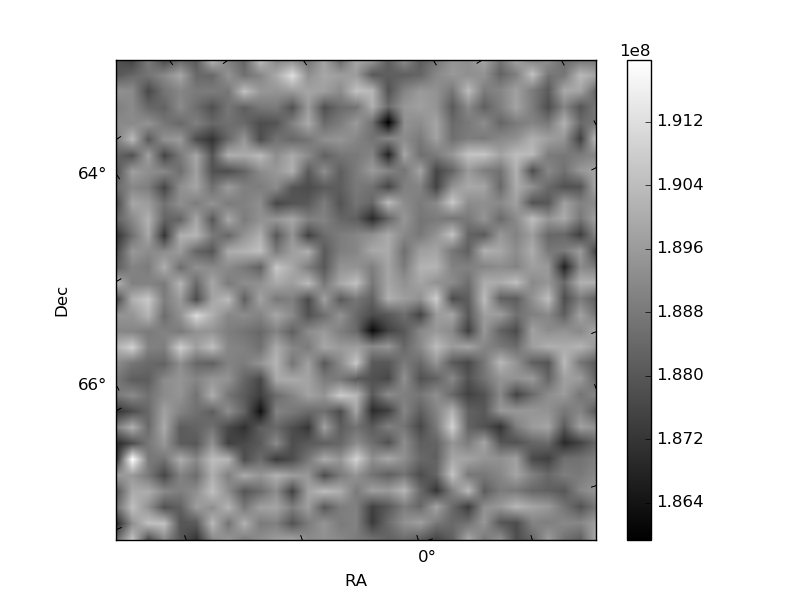
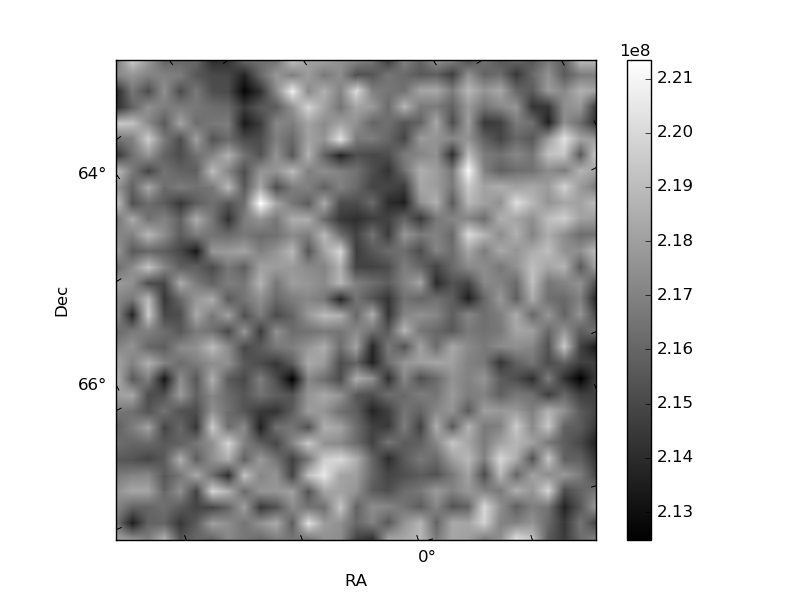
Histogram calculated using DETX and DETY for each event in the final _common_clean file
| Quadrant A | 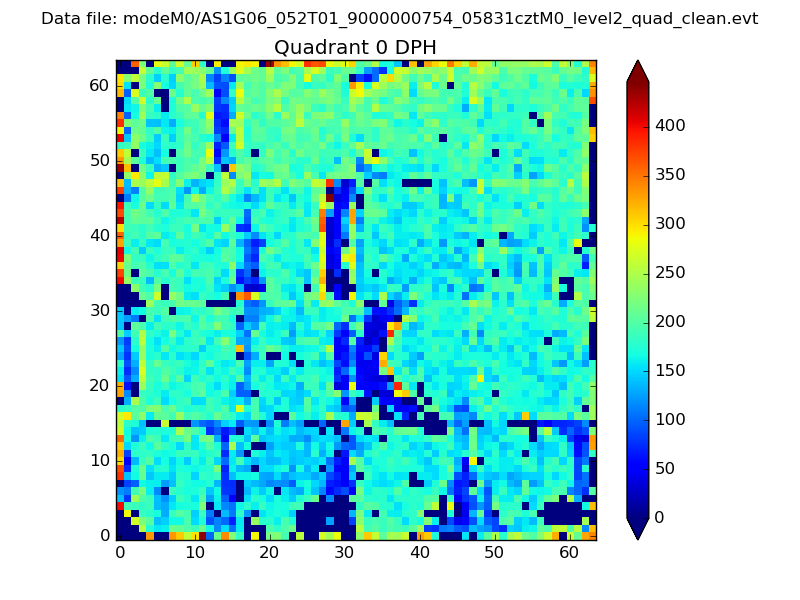 |
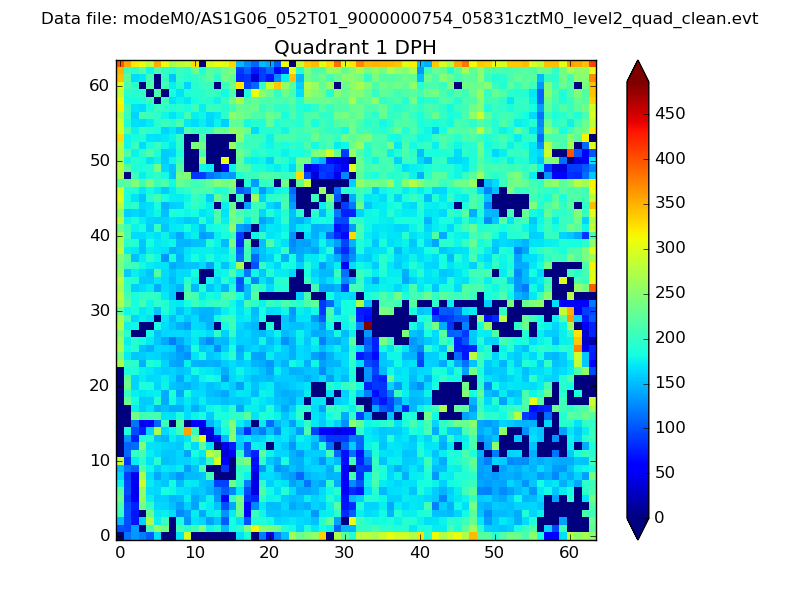 |
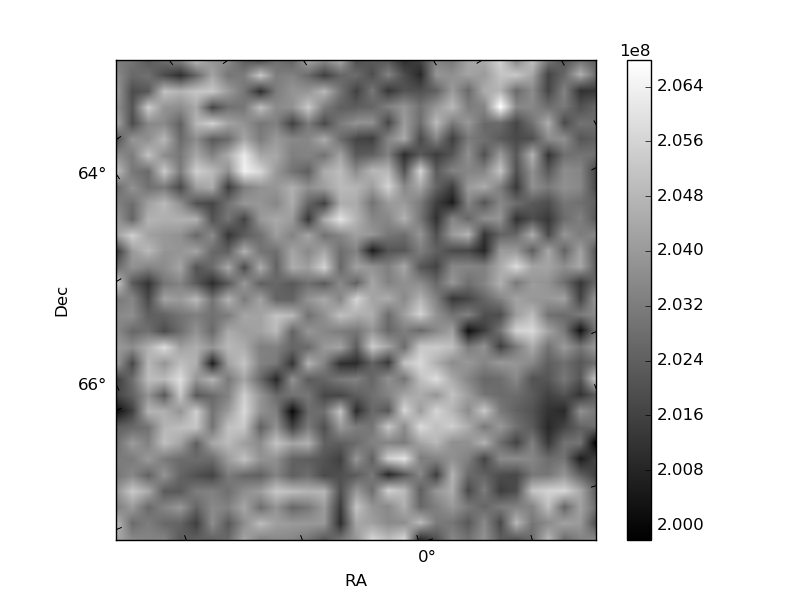
Quadrant B |
|---|---|---|---|
| Quadrant D | 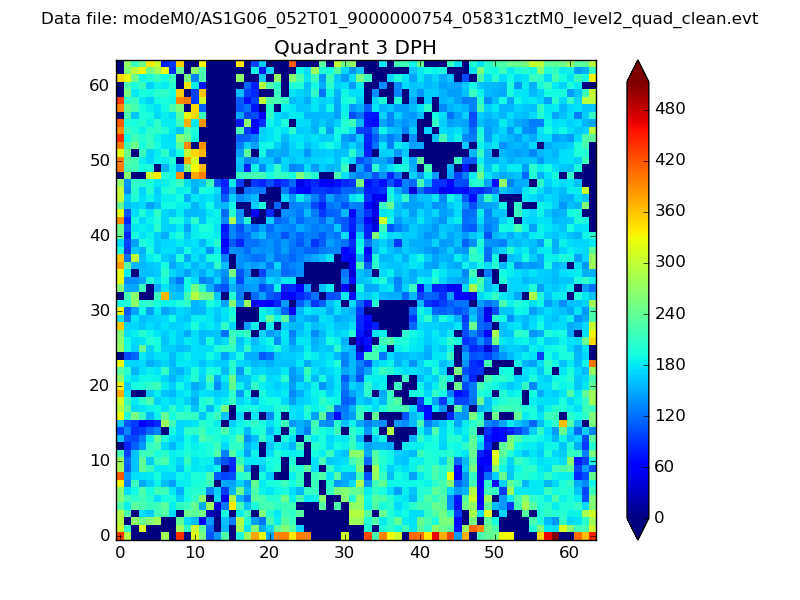 |
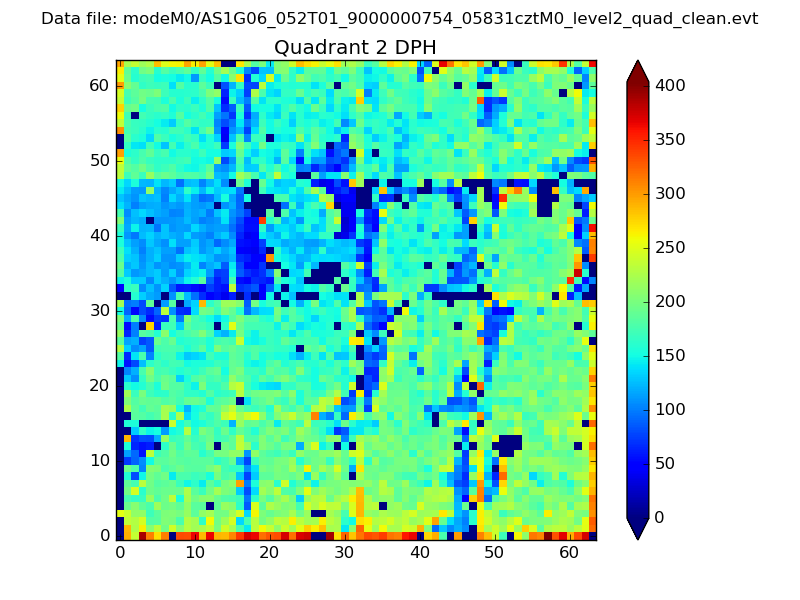 |
Quadrant C |
| Plot type | Count rate plots | Images |
|---|---|---|
| Comparison with Poisson distribution Blue bars denote a histogram of data divided into 1 sec bins. Red curve is a Poisson curve with rate = median count rate of data. |
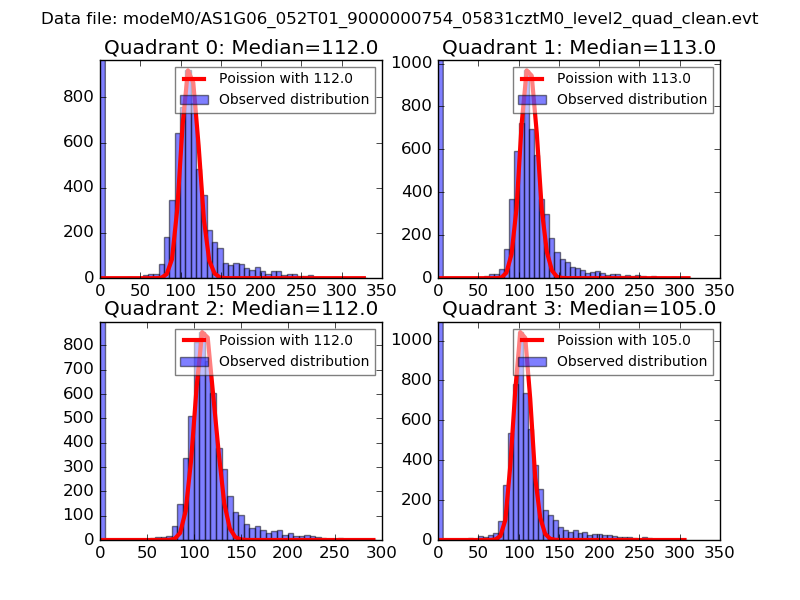 |
 |
| Quadrant-wise count rates Data is divided into 100 sec bins |
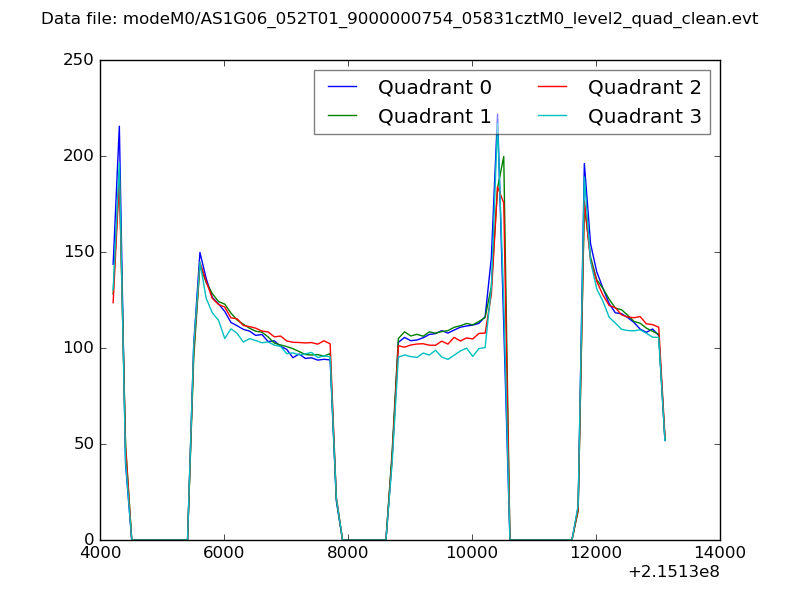 |
|
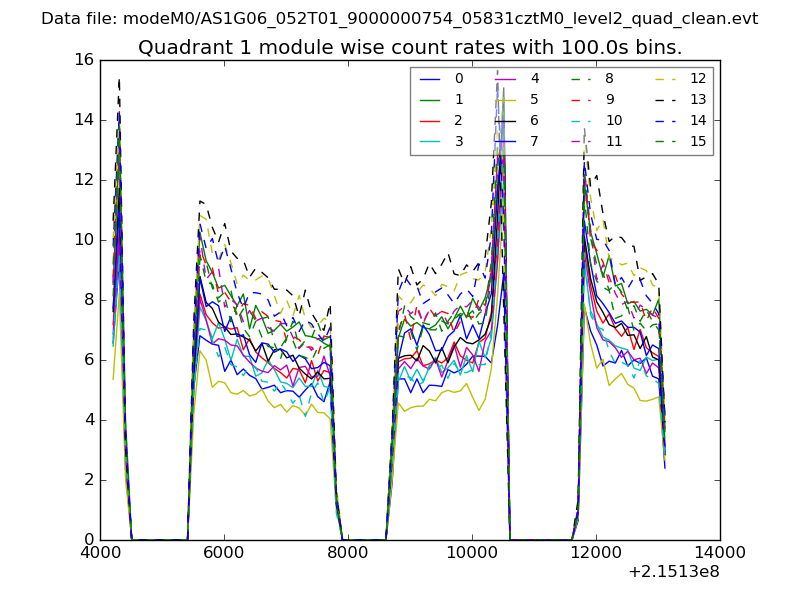
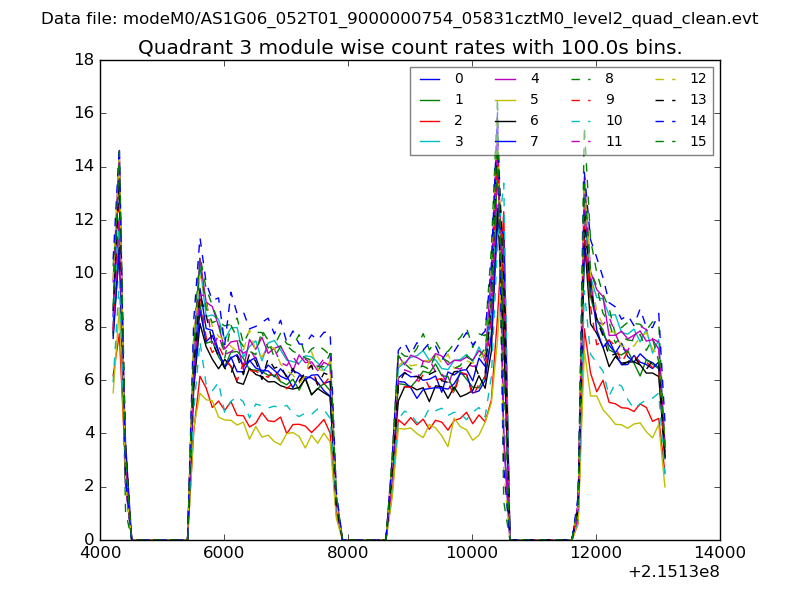
| Module-wise count rates for Quadrant A Data is divided into 100 sec bins |
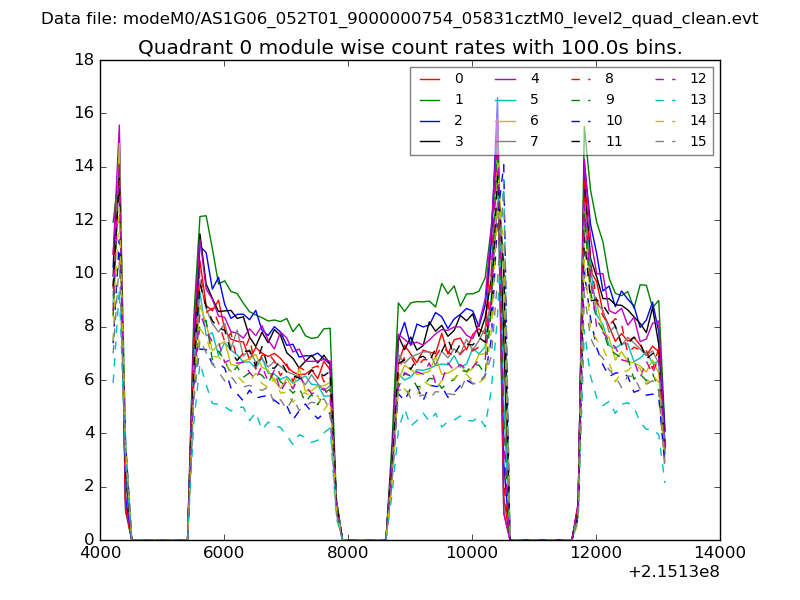 |
 |
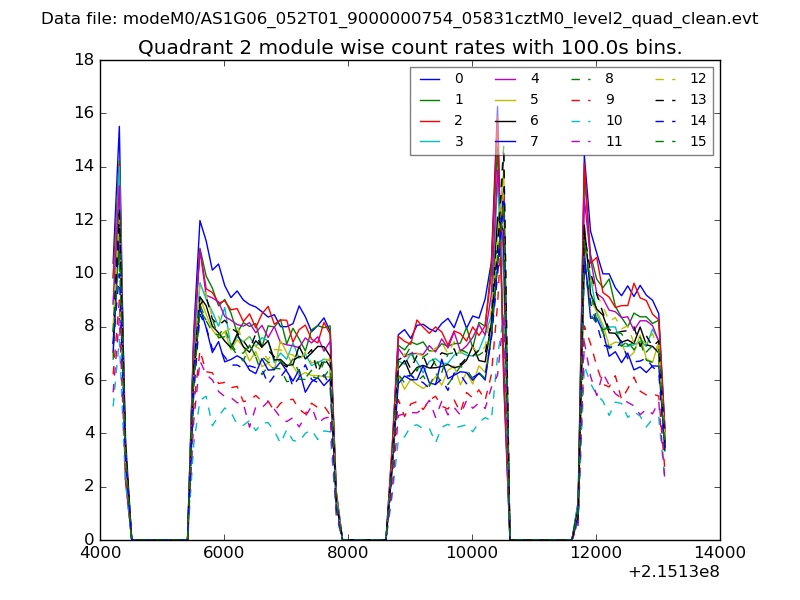
| Module-wise count rates for Quadrant B Data is divided into 100 sec bins |
 |
 |
| Module-wise count rates for Quadrant C Data is divided into 100 sec bins |
 |
 |
| Module-wise count rates for Quadrant D Data is divided into 100 sec bins |
 |
 |
| Parameter | Plot |
|---|---|
| CZT HV Monitor | 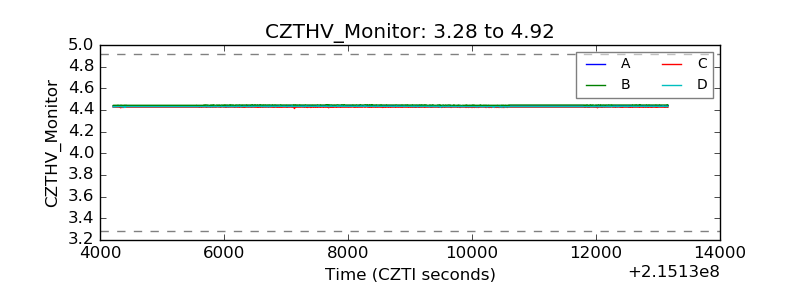 |
| D_VDD | 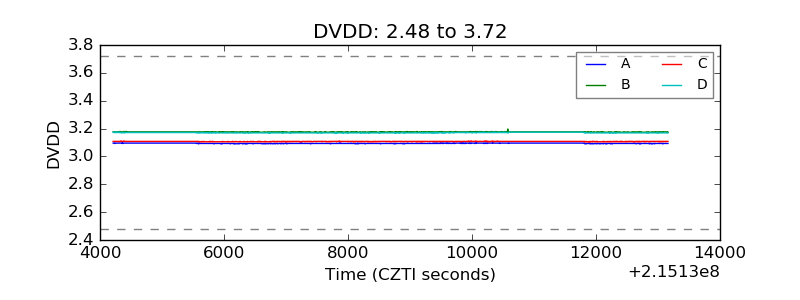 |
| Temperature 1 |  |
| Veto HV Monitor | 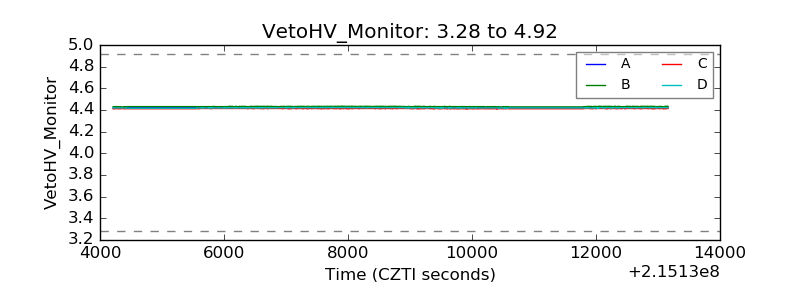 |
| Veto LLD | 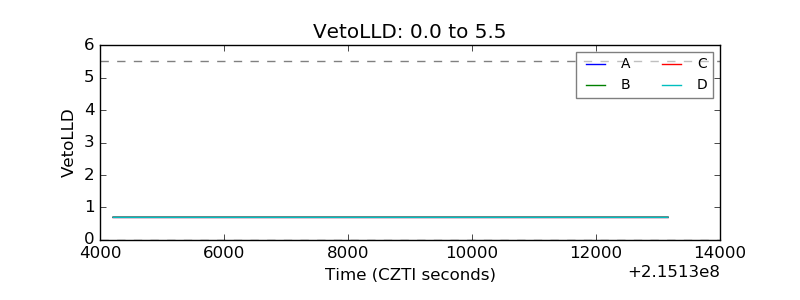 |
| Alpha Counter | 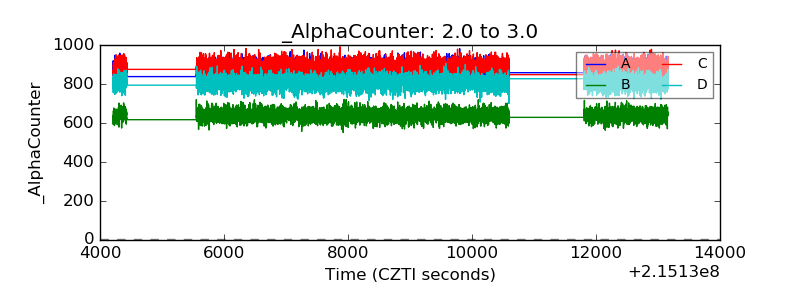 |
| _CPM_Rate | 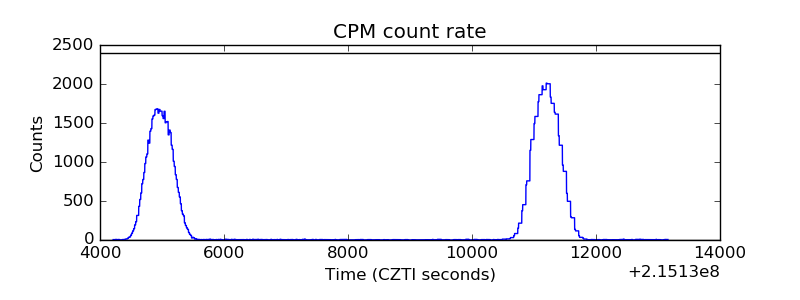 |
| CZT Counter | 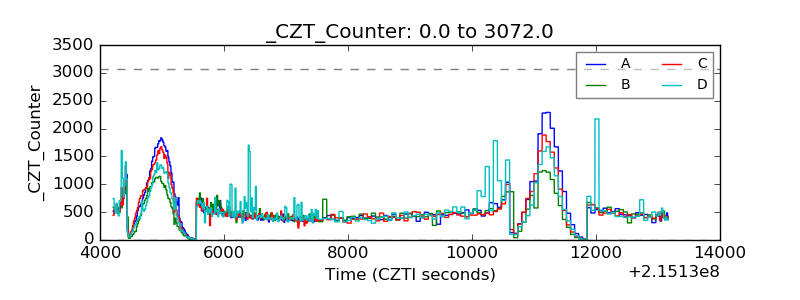 |
| +2.5 Volts monitor |  |
| +5 Volts monitor | 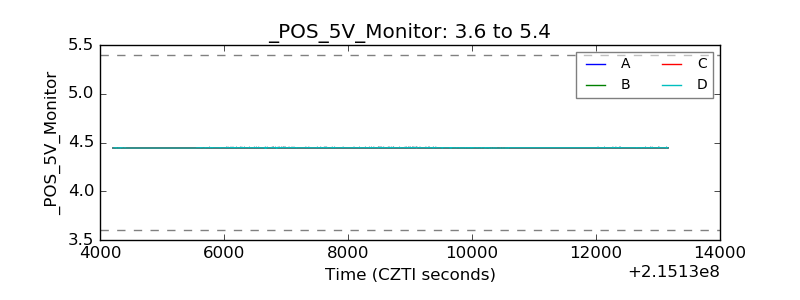 |
| _ROLL_ROT |  |
| _Roll_DEC | 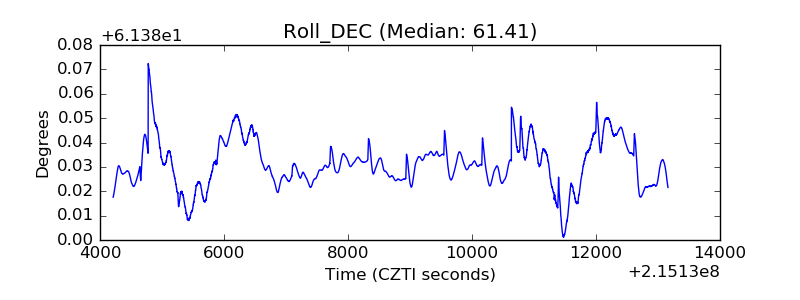 |
| _Roll_RA | 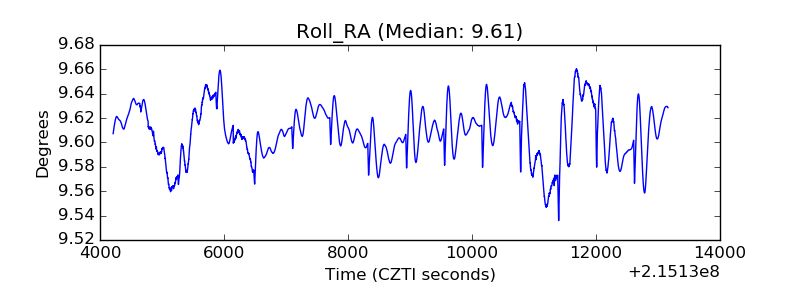 |
| Veto Counter | 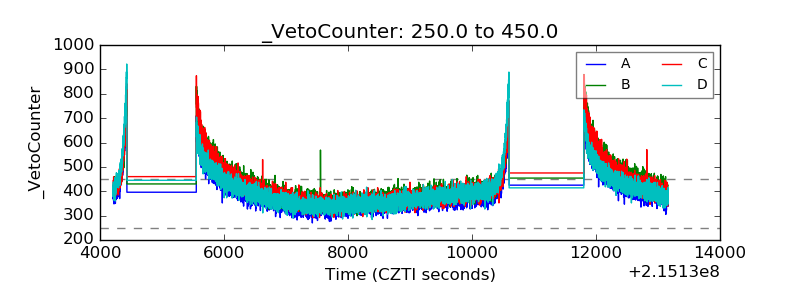 |