| Param | Original file | Final file |
|---|---|---|
| Filename | modeM0/AS1G06_052T01_9000000754_05832cztM0_level2.evt | modeM0/AS1G06_052T01_9000000754_05832cztM0_level2_quad_clean.evt |
| Size (bytes) | 438,422,400 | 102,461,760 |
| Size | 418.1 MB | 97.7 MB |
| Events in quadrant A | 3,117,853 | 665,545 |
| Events in quadrant B | 3,230,613 | 677,682 |
| Events in quadrant C | 3,023,527 | 663,391 |
| Events in quadrant D | 3,450,566 | 629,916 |
| Mode M9 | |||
|---|---|---|---|
| Quadrant | BADHDUFLAG | Total packets | Discarded packets |
| A | 0 | 25 | 0 |
| B | 0 | 25 | 0 |
| C | 0 | 25 | 0 |
| D | 0 | 25 | 0 |
| Mode SS | |||
|---|---|---|---|
| Quadrant | BADHDUFLAG | Total packets | Discarded packets |
| A | 0 | 138 | 0 |
| B | 0 | 138 | 0 |
| C | 0 | 138 | 0 |
| D | 0 | 138 | 0 |
| Mode M0 | |||
|---|---|---|---|
| Quadrant | BADHDUFLAG | Total packets | Discarded packets |
| A | 0 | 13952 | 3 |
| B | 0 | 14026 | 2 |
| C | 0 | 13787 | 2 |
| D | 0 | 15066 | 2 |
| Quadrant | Total seconds | Saturated seconds | Saturation percentage |
|---|---|---|---|
| A | 6692 | 53 | 0.791990% |
| B | 6692 | 64 | 0.956366% |
| C | 6692 | 36 | 0.537956% |
| D | 6692 | 76 | 1.135684% |
Noise dominated data is calculated using 1-second bins in cleaned event files. If a bin has >2000 counts, and if more than 50% of those come from <1% of pixels, then it is considered to be noise-dominated and hence unusable.
| Quadrant | # 1 sec bins | Bins with >0 counts | Bins with >2000 counts | High rate bins dominated by noise | Noise dominated (total time) | Noise dominated (detector-on time) | Marked lightcurve |
|---|---|---|---|---|---|---|---|
| A | 9177 | 6695 | 1 | 1 | 0.01% | 0.01% | 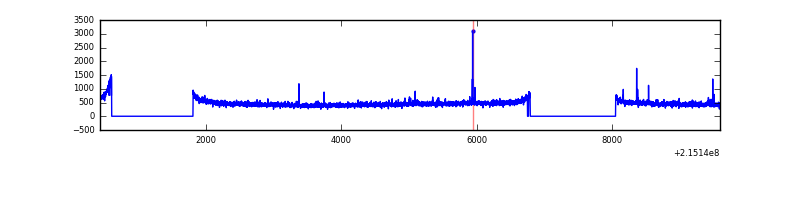 |
| B | 9177 | 6695 | 5 | 5 | 0.05% | 0.07% |  |
| C | 9177 | 6695 | 0 | 0 | 0.00% | 0.00% |  |
| D | 9177 | 6695 | 18 | 18 | 0.20% | 0.27% | 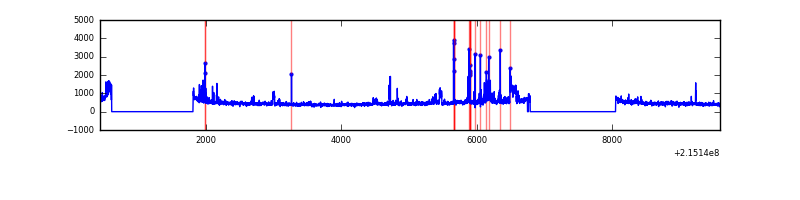 |
Top three noisy pixels from each quadrant. If the there are fewer than three noisy pixels in the level2.evt file, extra rows are filled as -1
| Pixel properties | Quadrant properties | ||||||
|---|---|---|---|---|---|---|---|
| Quadrant | DetID | PixID | Counts | Sigma | Mean | Median | Sigma |
| A | 15 | 223 | 31305 | 188.8 | 800 | 785 | 161.7 |
| A | 0 | 226 | 7851 | 43.71 | 800 | 785 | 161.7 |
| A | 12 | 194 | 7662 | 42.54 | 800 | 785 | 161.7 |
| B | 15 | 204 | 60232 | 392.67 | 805 | 786 | 151.4 |
| B | 4 | 81 | 28112 | 180.5 | 805 | 786 | 151.4 |
| B | 4 | 80 | 17119 | 107.89 | 805 | 786 | 151.4 |
| C | 1 | 16 | 12384 | 65.55 | 770 | 774 | 177.1 |
| C | 13 | 61 | 6385 | 31.68 | 770 | 774 | 177.1 |
| C | 14 | 67 | 4710 | 22.22 | 770 | 774 | 177.1 |
| D | 11 | 241 | 320364 | 1712.12 | 766 | 741 | 186.7 |
| D | 2 | 152 | 168022 | 896.07 | 766 | 741 | 186.7 |
| D | 2 | 14 | 24547 | 127.52 | 766 | 741 | 186.7 |
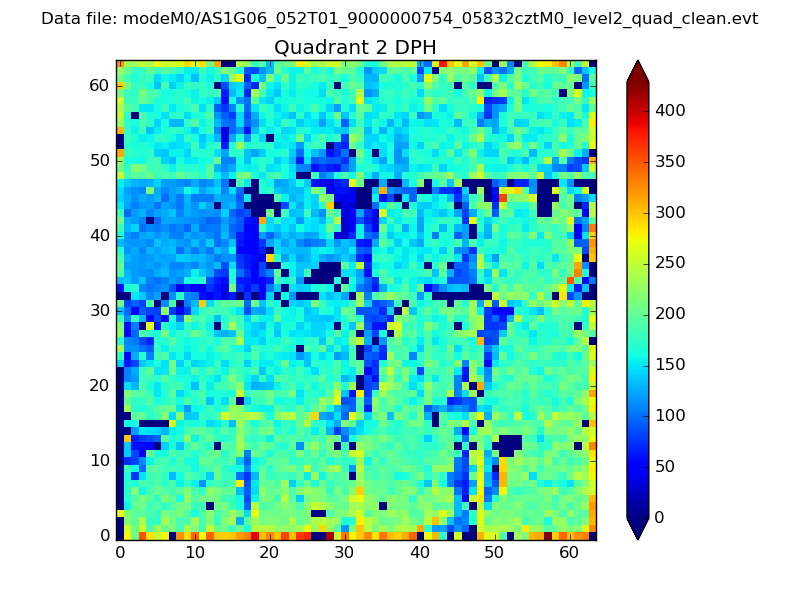
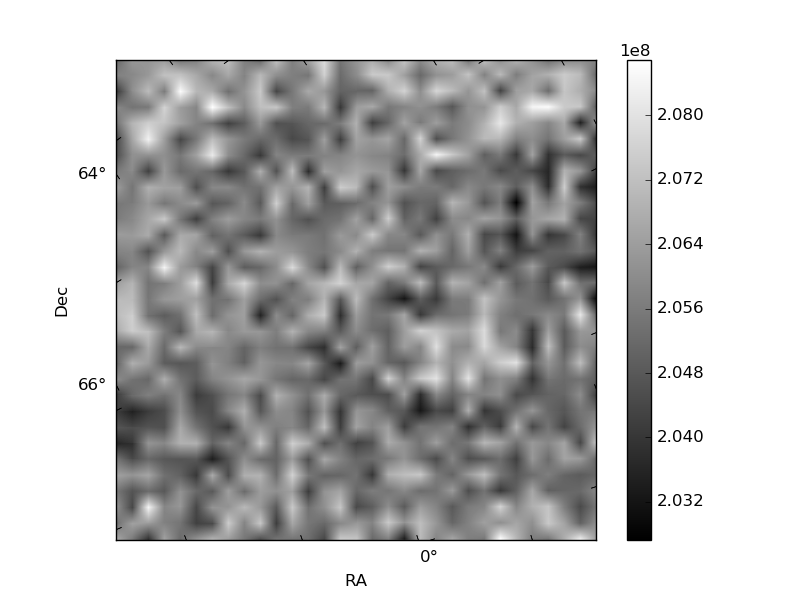
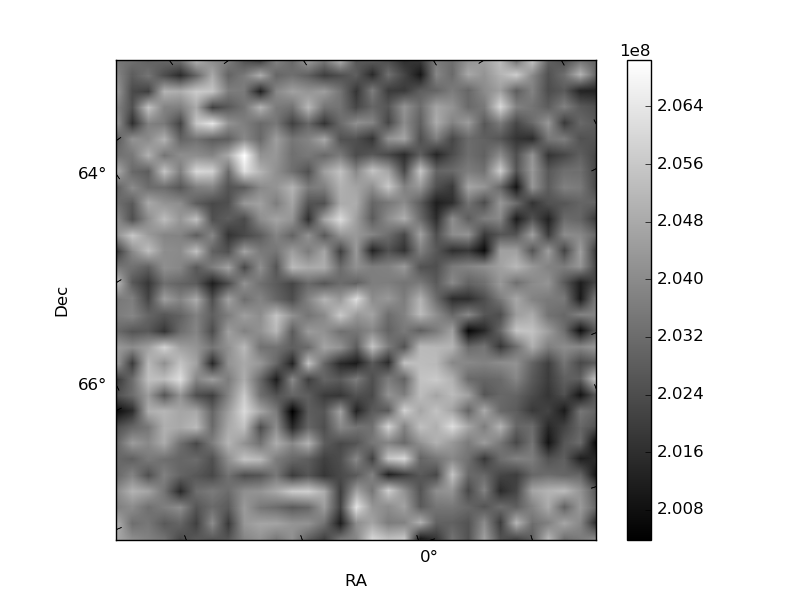
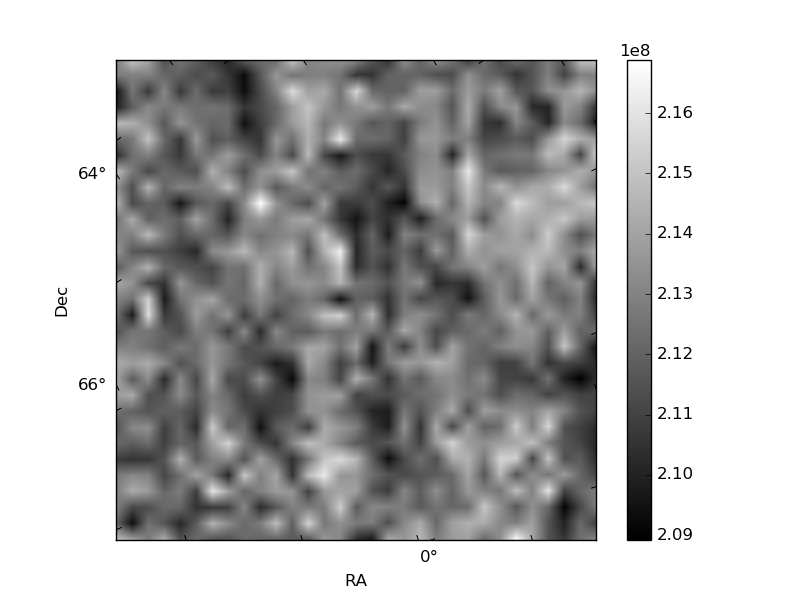
Histogram calculated using DETX and DETY for each event in the final _common_clean file
| Quadrant A | 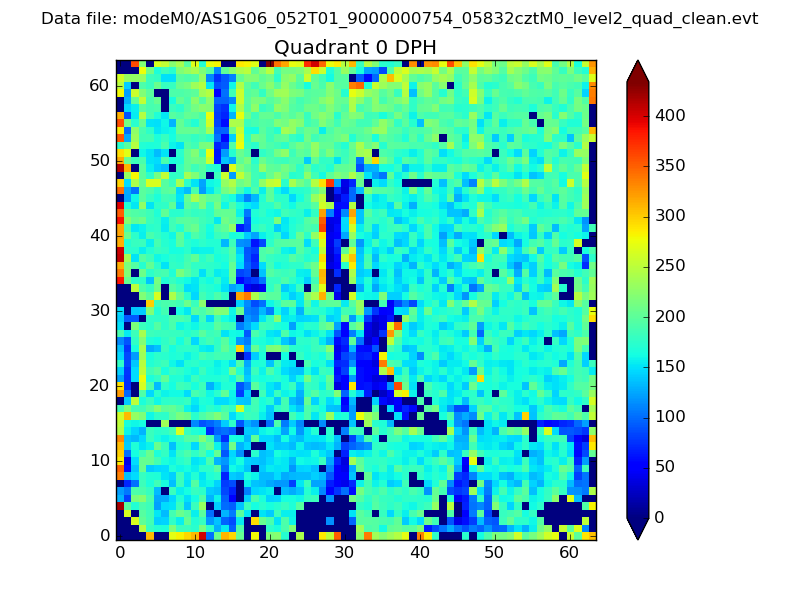 |
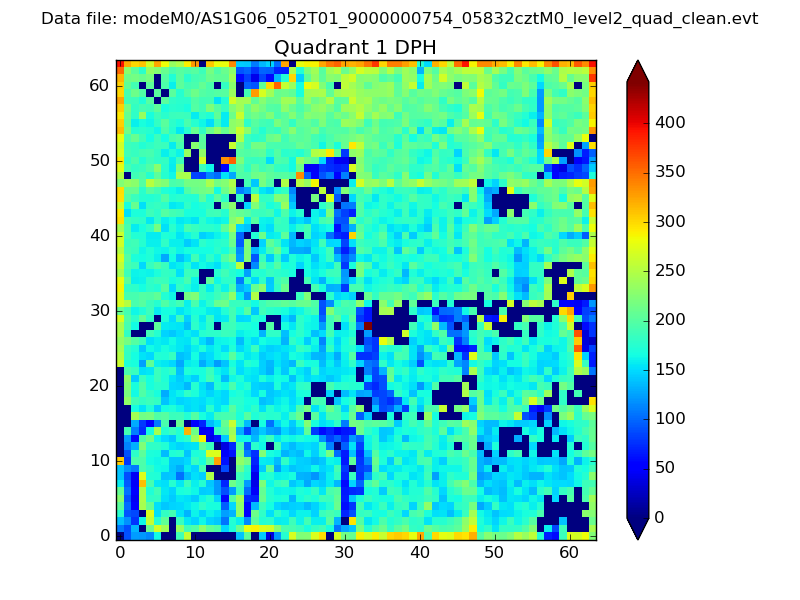 |
Quadrant B |
|---|---|---|---|
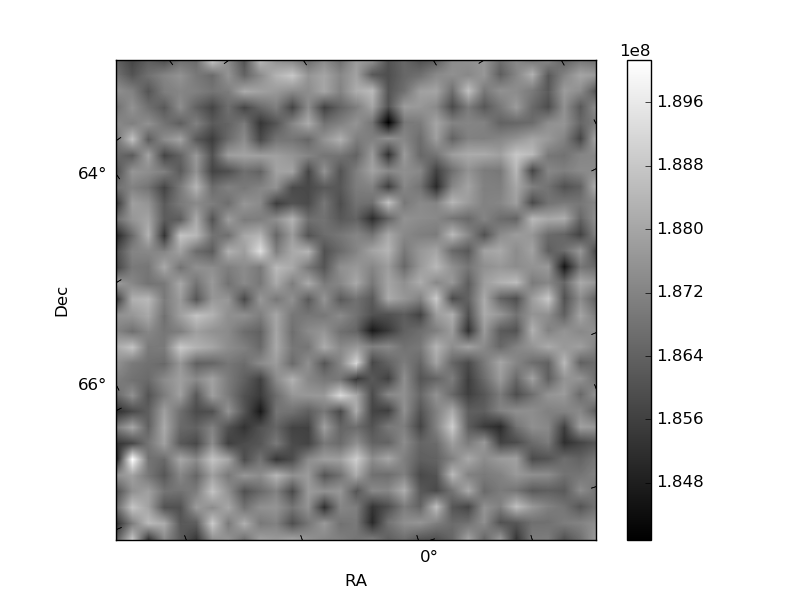
| Quadrant D | 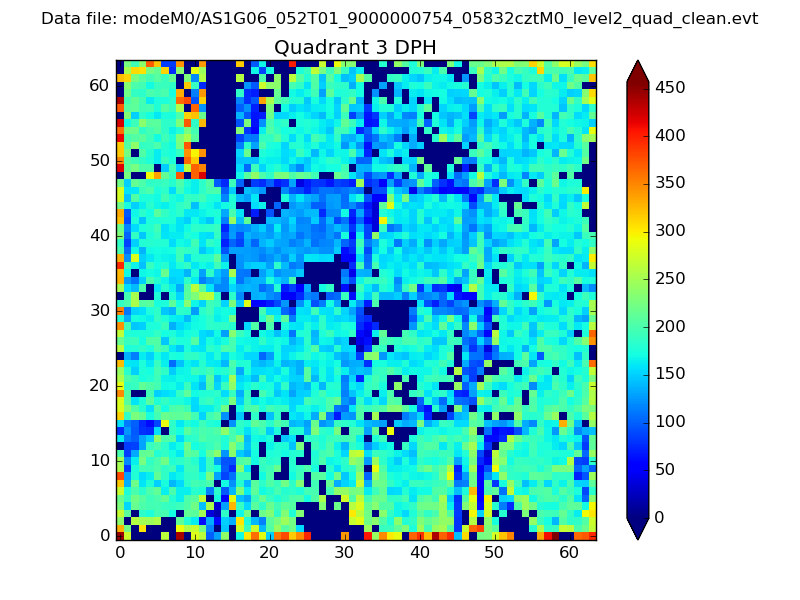 |
 |
Quadrant C |
| Plot type | Count rate plots | Images |
|---|---|---|
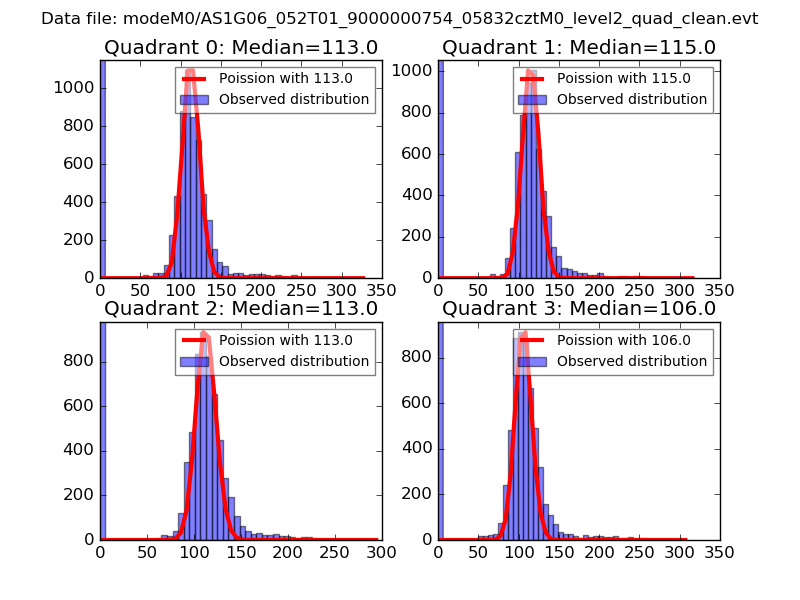
| Comparison with Poisson distribution Blue bars denote a histogram of data divided into 1 sec bins. Red curve is a Poisson curve with rate = median count rate of data. |
 |
 |
| Quadrant-wise count rates Data is divided into 100 sec bins |
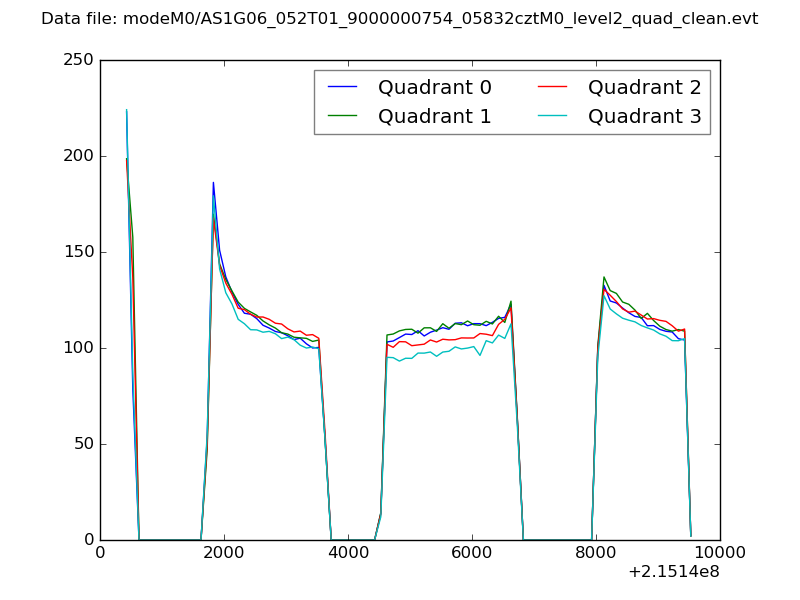 |
|
| Module-wise count rates for Quadrant A Data is divided into 100 sec bins |
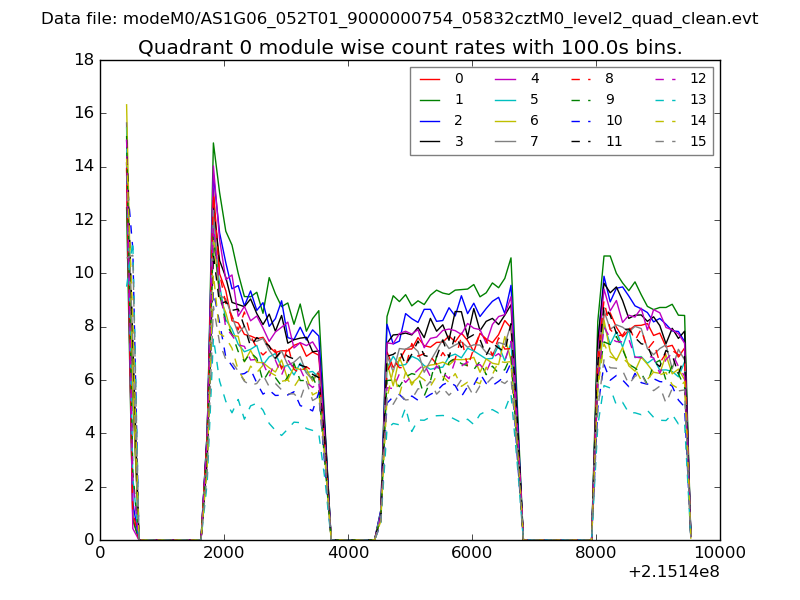 |
 |
| Module-wise count rates for Quadrant B Data is divided into 100 sec bins |
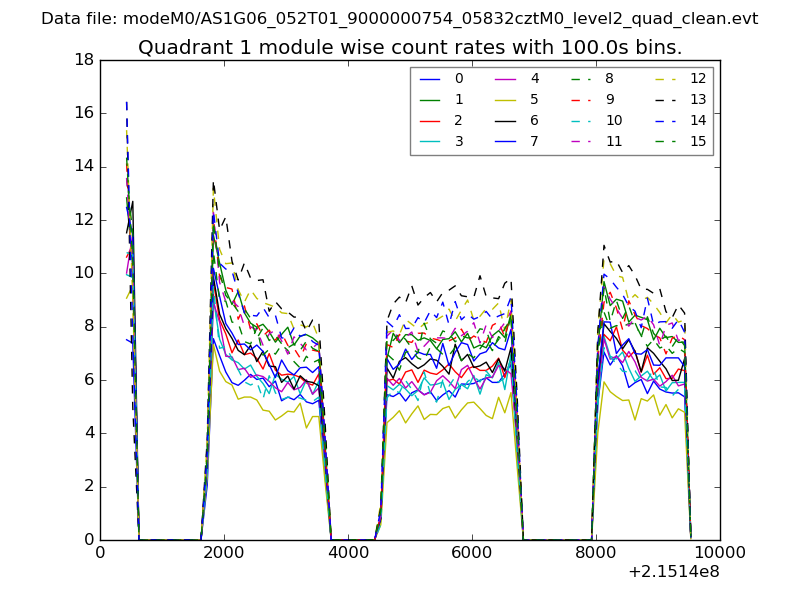 |
 |
| Module-wise count rates for Quadrant C Data is divided into 100 sec bins |
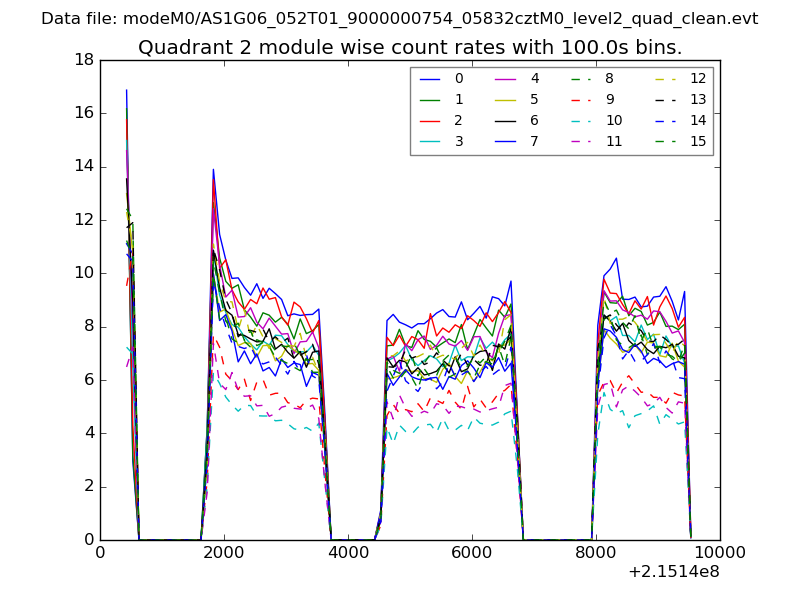 |
 |
| Module-wise count rates for Quadrant D Data is divided into 100 sec bins |
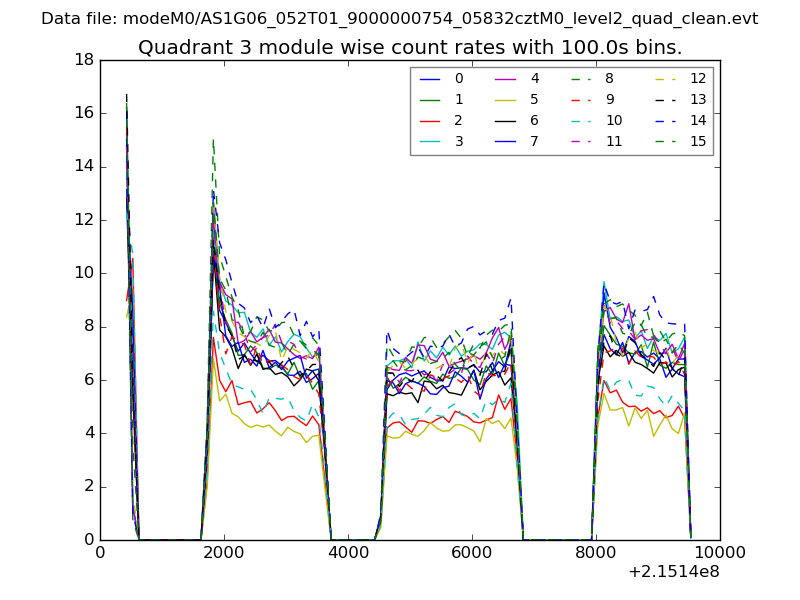 |
 |
| Parameter | Plot |
|---|---|
| CZT HV Monitor | 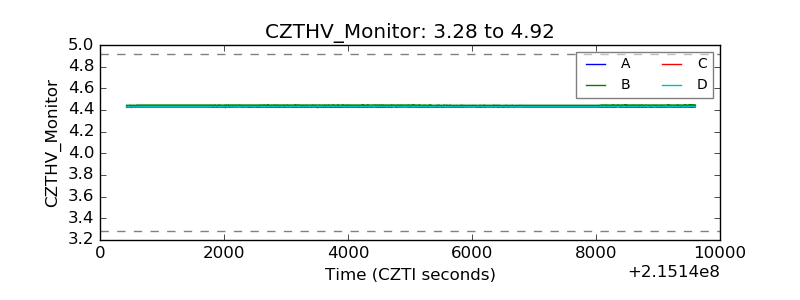 |
| D_VDD | 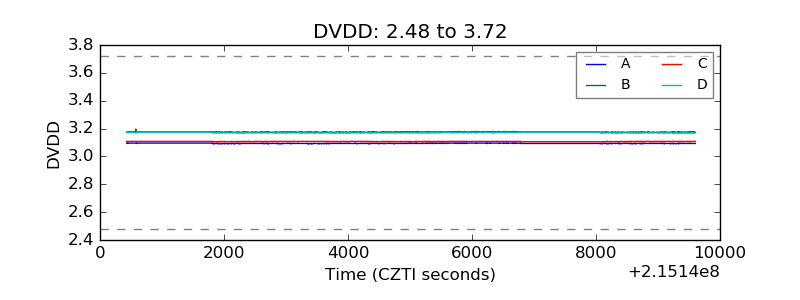 |
| Temperature 1 | 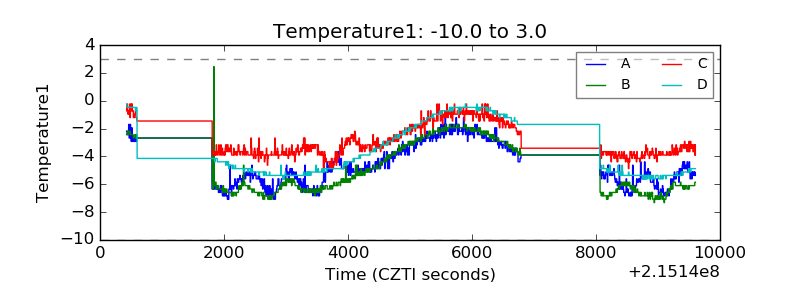 |
| Veto HV Monitor | 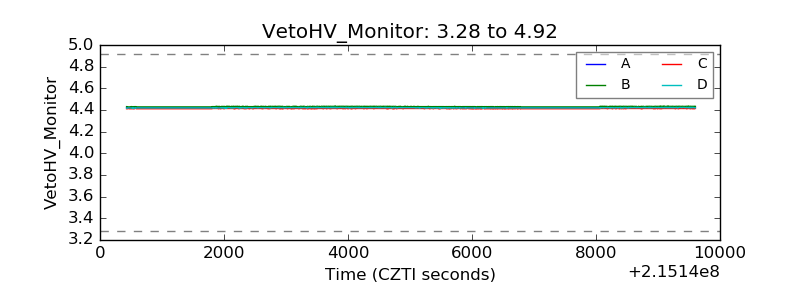 |
| Veto LLD | 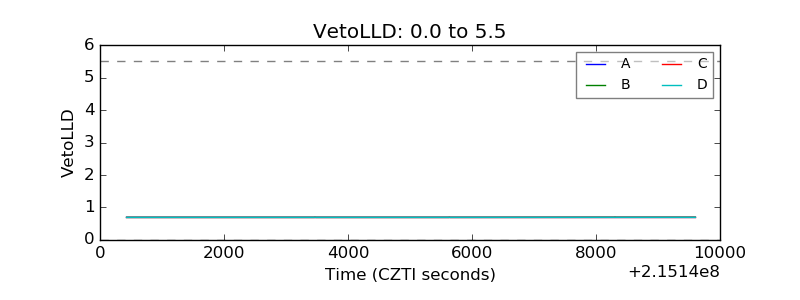 |
| Alpha Counter | 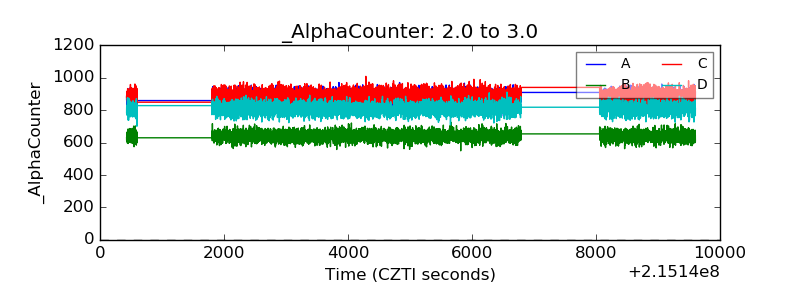 |
| _CPM_Rate | 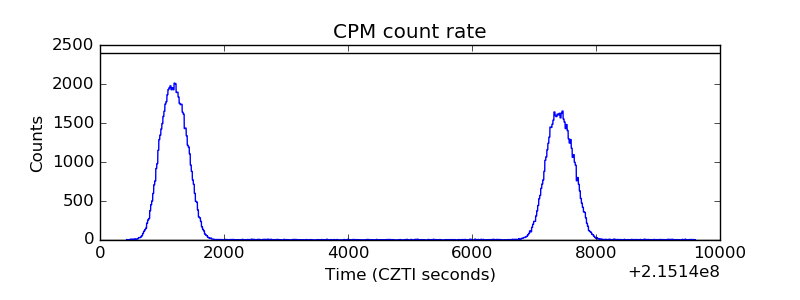 |
| CZT Counter | 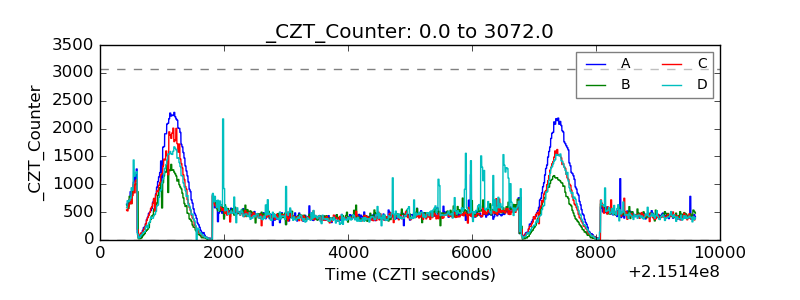 |
| +2.5 Volts monitor | 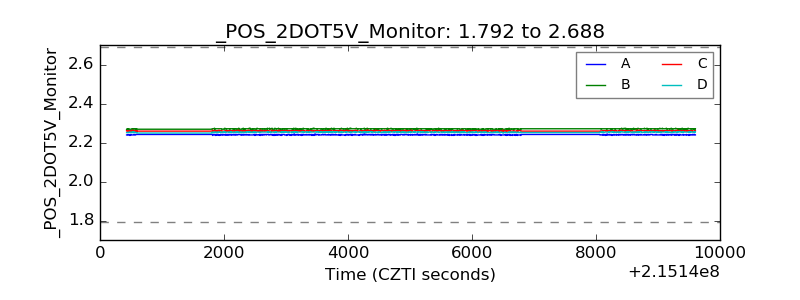 |
| +5 Volts monitor |  |
| _ROLL_ROT | 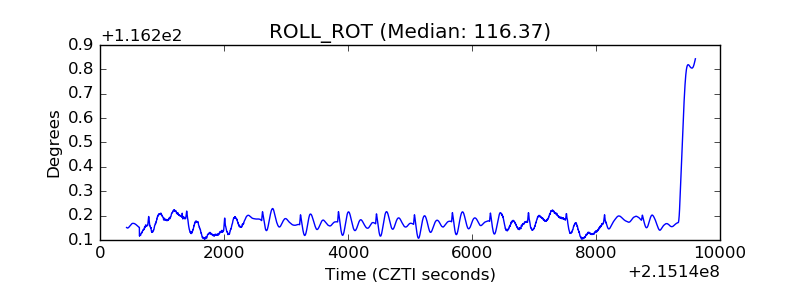 |
| _Roll_DEC | 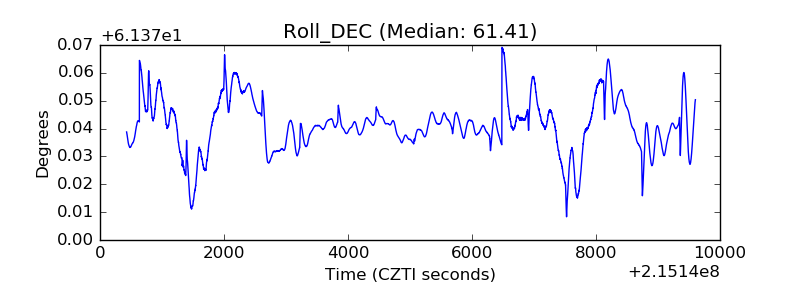 |
| _Roll_RA | 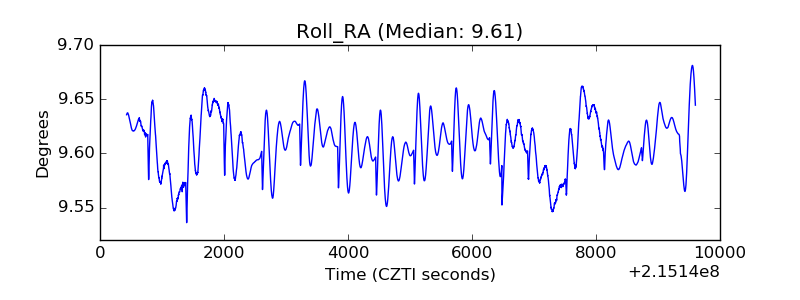 |
| Veto Counter | 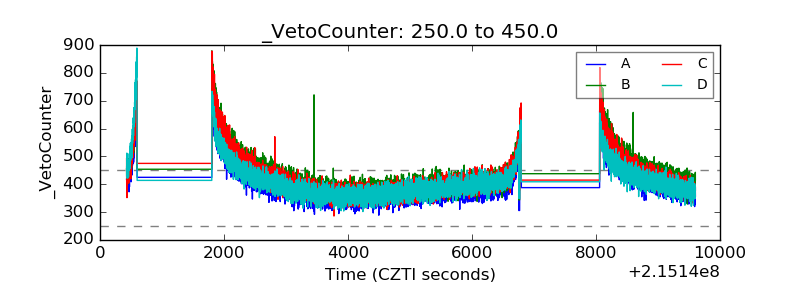 |