| Param | Original file | Final file |
|---|---|---|
| Filename | modeM0/AS1G06_052T01_9000000754_05833cztM0_level2.evt | modeM0/AS1G06_052T01_9000000754_05833cztM0_level2_quad_clean.evt |
| Size (bytes) | 403,315,200 | 83,422,080 |
| Size | 384.6 MB | 79.6 MB |
| Events in quadrant A | 3,147,231 | 525,262 |
| Events in quadrant B | 2,978,872 | 540,870 |
| Events in quadrant C | 2,707,956 | 528,936 |
| Events in quadrant D | 2,961,390 | 501,416 |
| Mode M9 | |||
|---|---|---|---|
| Quadrant | BADHDUFLAG | Total packets | Discarded packets |
| A | 0 | 12 | 0 |
| B | 0 | 12 | 0 |
| C | 0 | 12 | 0 |
| D | 0 | 12 | 0 |
| Mode SS | |||
|---|---|---|---|
| Quadrant | BADHDUFLAG | Total packets | Discarded packets |
| A | 0 | 126 | 0 |
| B | 0 | 126 | 0 |
| C | 0 | 126 | 0 |
| D | 0 | 126 | 0 |
| Mode M0 | |||
|---|---|---|---|
| Quadrant | BADHDUFLAG | Total packets | Discarded packets |
| A | 0 | 13674 | 2 |
| B | 0 | 12821 | 1 |
| C | 0 | 12512 | 1 |
| D | 0 | 13222 | 1 |
| Quadrant | Total seconds | Saturated seconds | Saturation percentage |
|---|---|---|---|
| A | 6153 | 131 | 2.129043% |
| B | 6153 | 63 | 1.023891% |
| C | 6153 | 29 | 0.471315% |
| D | 6153 | 59 | 0.958882% |
Noise dominated data is calculated using 1-second bins in cleaned event files. If a bin has >2000 counts, and if more than 50% of those come from <1% of pixels, then it is considered to be noise-dominated and hence unusable.
| Quadrant | # 1 sec bins | Bins with >0 counts | Bins with >2000 counts | High rate bins dominated by noise | Noise dominated (total time) | Noise dominated (detector-on time) | Marked lightcurve |
|---|---|---|---|---|---|---|---|
| A | 7423 | 6154 | 71 | 71 | 0.96% | 1.15% |  |
| B | 7423 | 6154 | 1 | 1 | 0.01% | 0.02% | 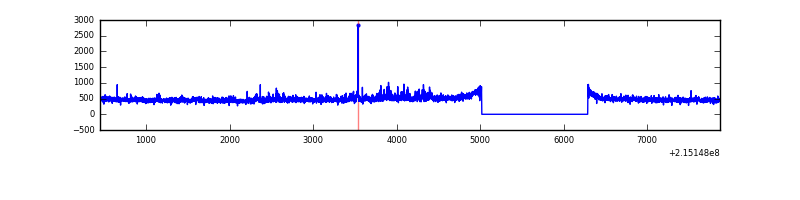 |
| C | 7423 | 6154 | 0 | 0 | 0.00% | 0.00% | 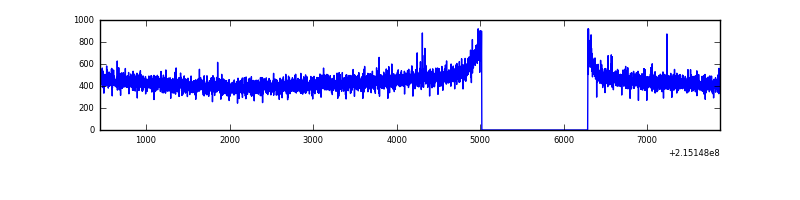 |
| D | 7423 | 6154 | 29 | 29 | 0.39% | 0.47% | 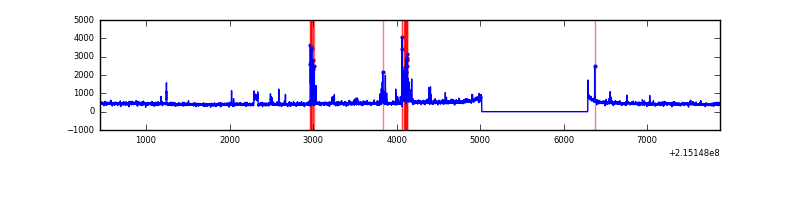 |
Top three noisy pixels from each quadrant. If the there are fewer than three noisy pixels in the level2.evt file, extra rows are filled as -1
| Pixel properties | Quadrant properties | ||||||
|---|---|---|---|---|---|---|---|
| Quadrant | DetID | PixID | Counts | Sigma | Mean | Median | Sigma |
| A | 15 | 236 | 365660 | 2520.21 | 710 | 694 | 144.8 |
| A | 15 | 223 | 28865 | 194.53 | 710 | 694 | 144.8 |
| A | 15 | 234 | 19546 | 130.18 | 710 | 694 | 144.8 |
| B | 15 | 204 | 121961 | 891.4 | 726 | 710 | 136.0 |
| B | 0 | 219 | 19004 | 134.49 | 726 | 710 | 136.0 |
| B | 4 | 48 | 13619 | 94.9 | 726 | 710 | 136.0 |
| C | 14 | 67 | 9697 | 56.62 | 690 | 694 | 159.0 |
| C | 13 | 61 | 5697 | 31.46 | 690 | 694 | 159.0 |
| C | 1 | 16 | 4589 | 24.49 | 690 | 694 | 159.0 |
| D | 11 | 241 | 150901 | 908.93 | 683 | 661 | 165.3 |
| D | 2 | 152 | 148255 | 892.92 | 683 | 661 | 165.3 |
| D | 7 | 55 | 48494 | 289.38 | 683 | 661 | 165.3 |
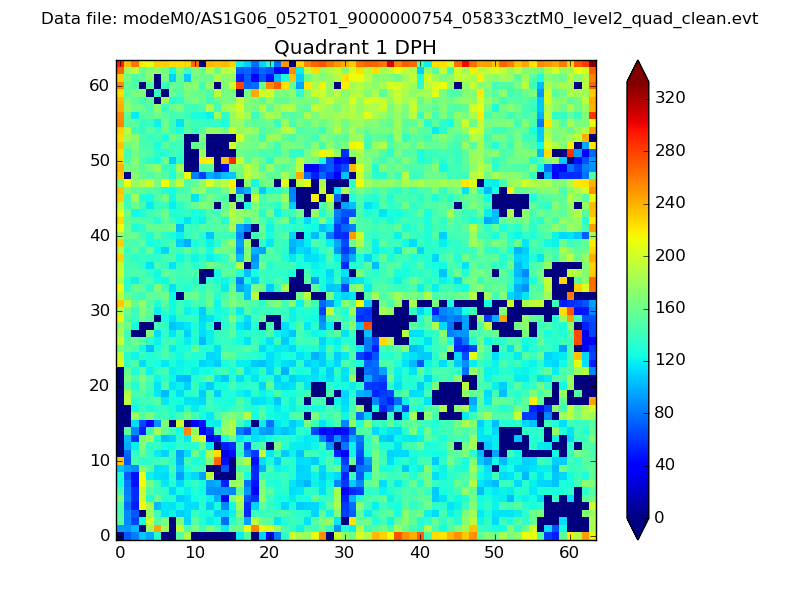
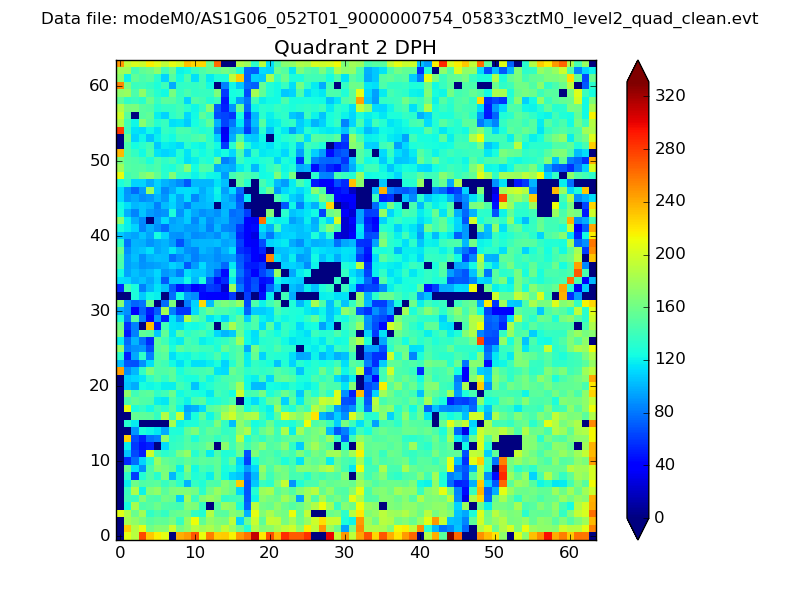
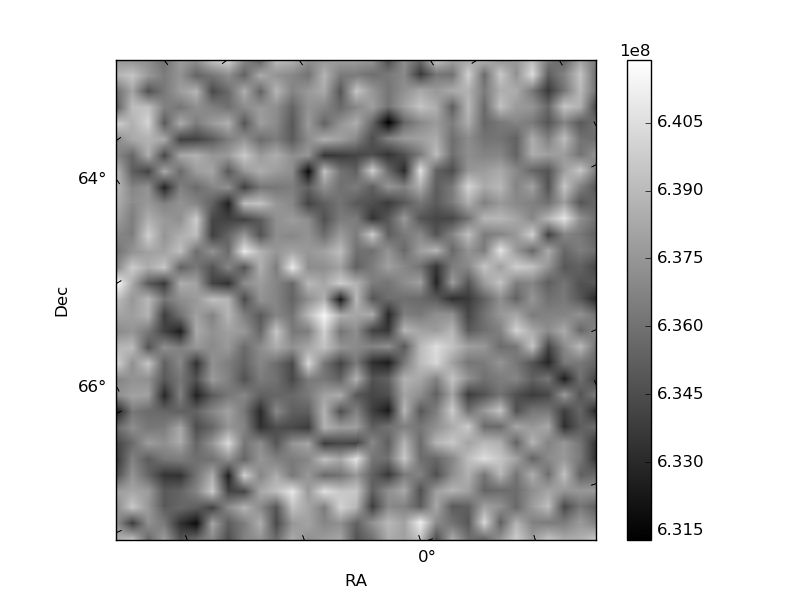
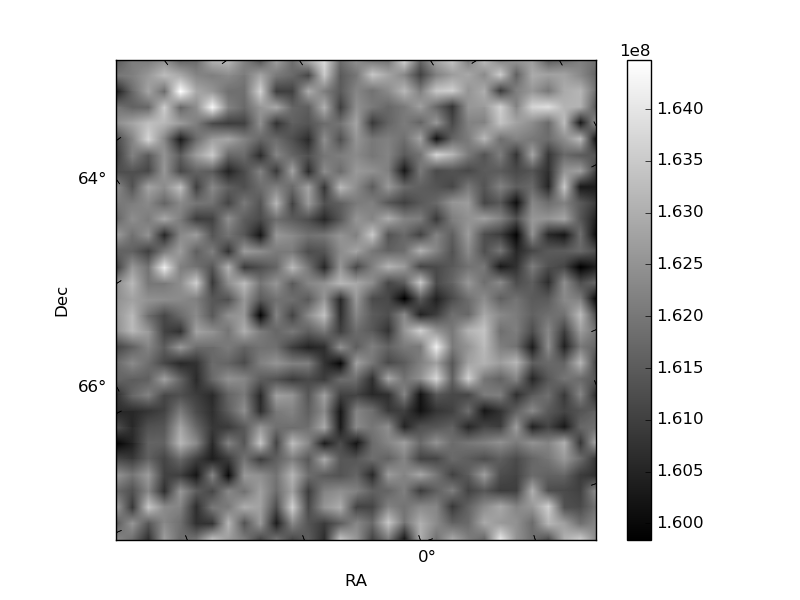
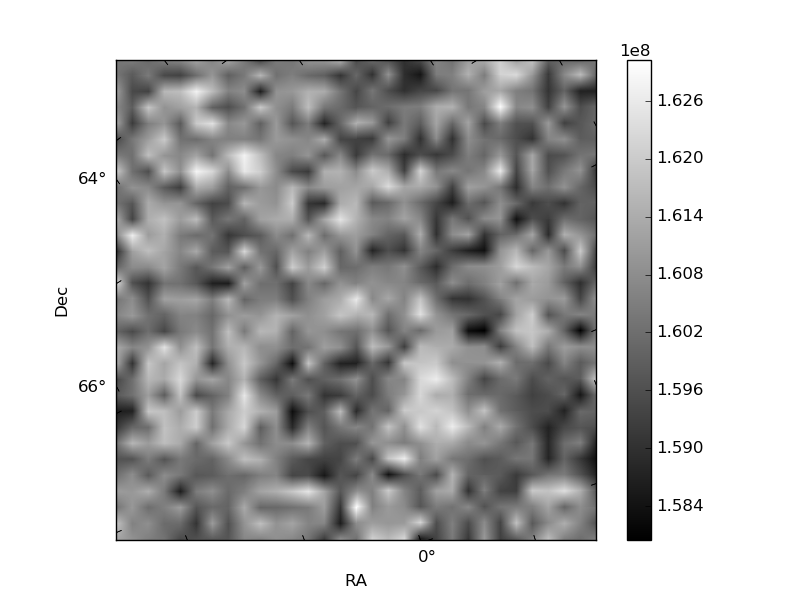
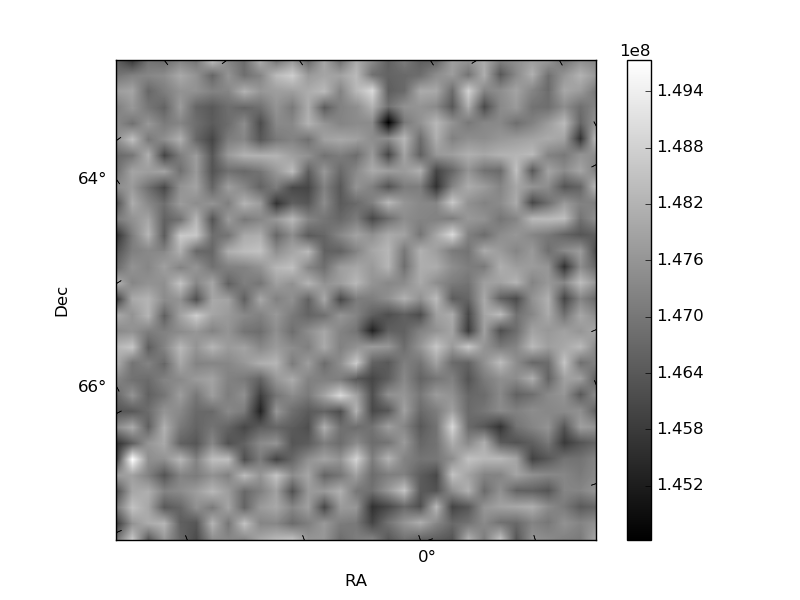
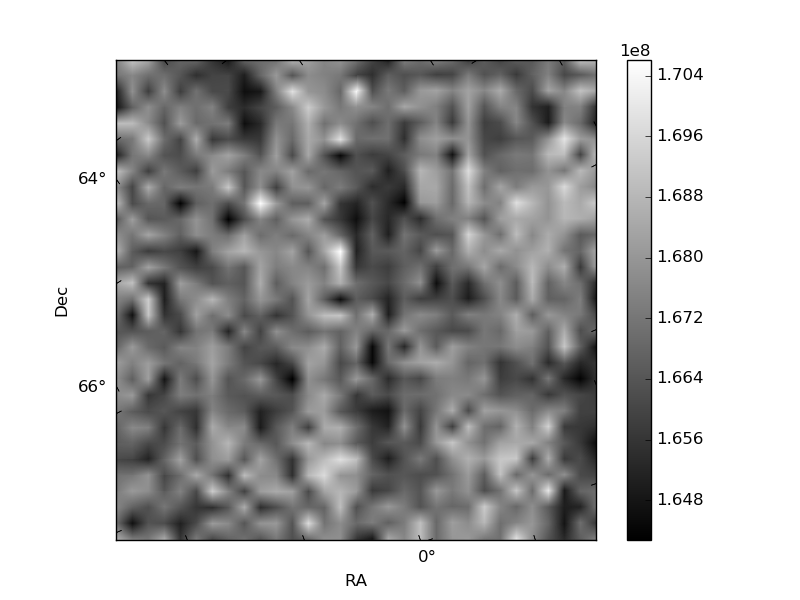
Histogram calculated using DETX and DETY for each event in the final _common_clean file
| Quadrant A | 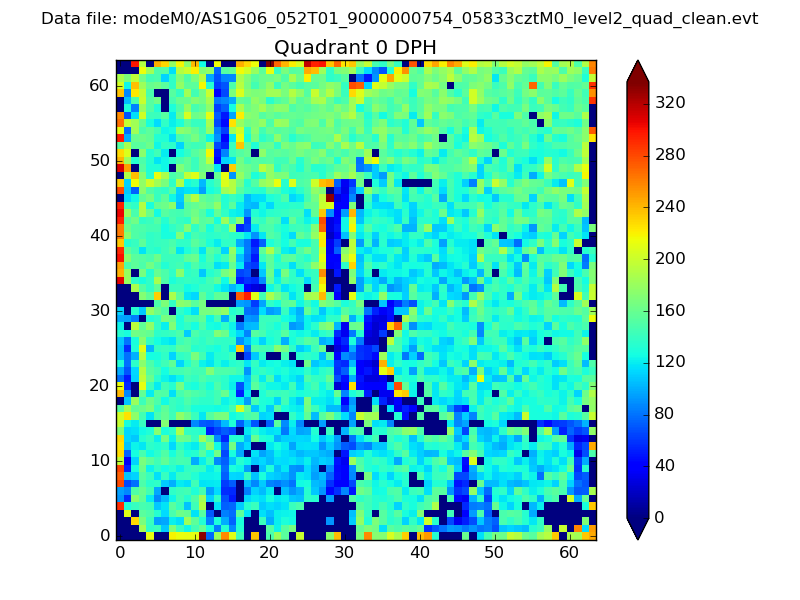 |
 |
Quadrant B |
|---|---|---|---|
| Quadrant D | 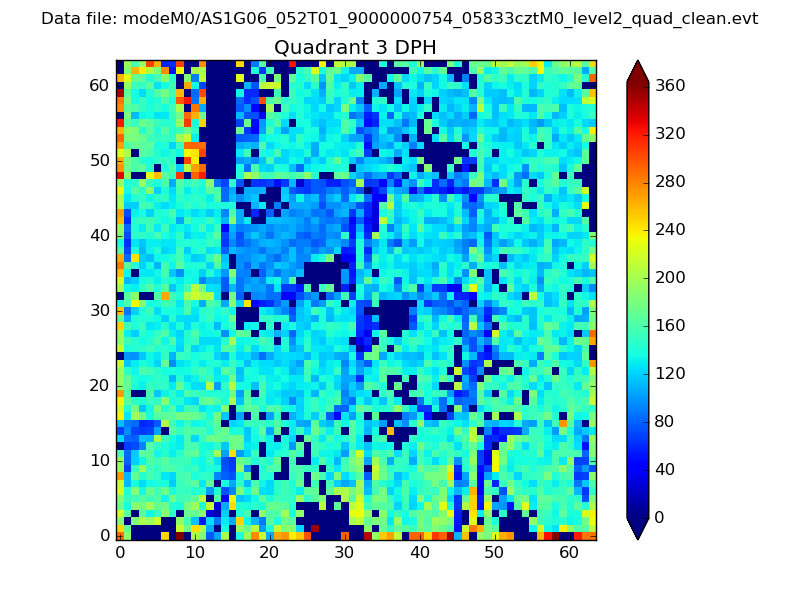 |
 |
Quadrant C |
| Plot type | Count rate plots | Images |
|---|---|---|
| Comparison with Poisson distribution Blue bars denote a histogram of data divided into 1 sec bins. Red curve is a Poisson curve with rate = median count rate of data. |
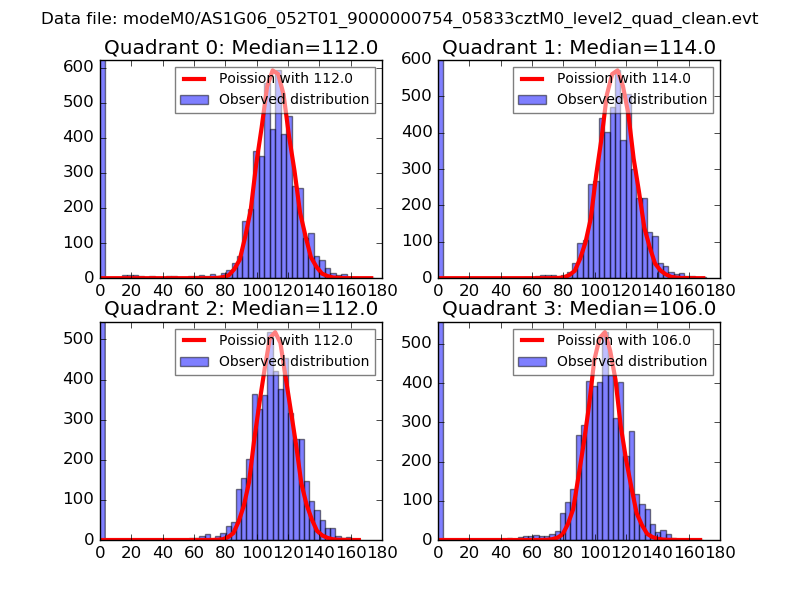 |
 |
| Quadrant-wise count rates Data is divided into 100 sec bins |
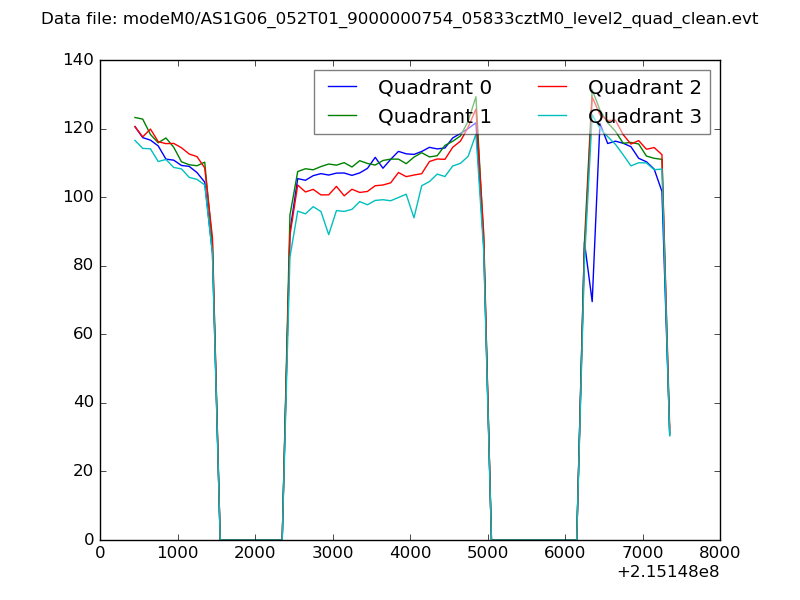 |
|
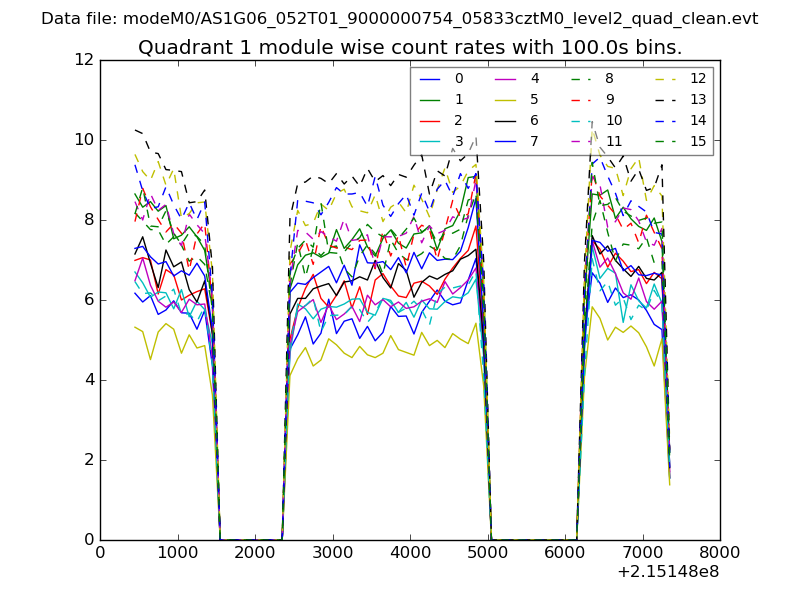
| Module-wise count rates for Quadrant A Data is divided into 100 sec bins |
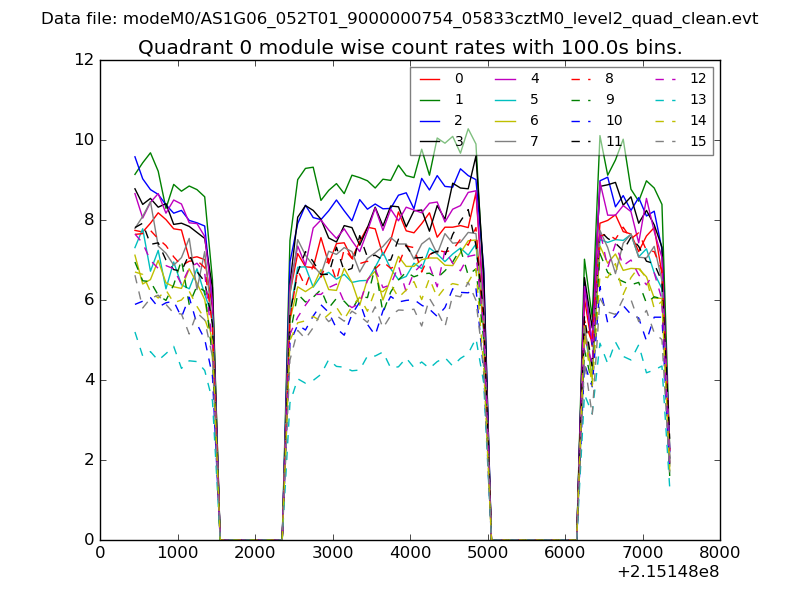 |
 |
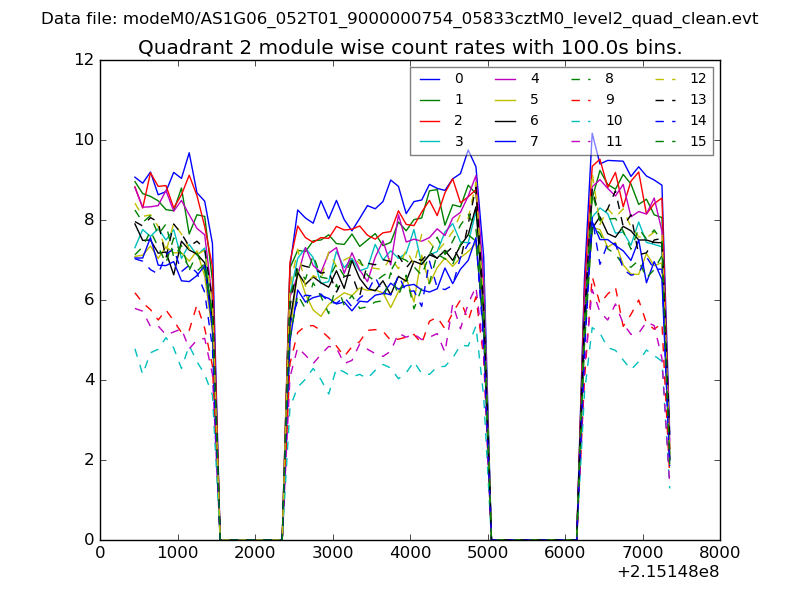
| Module-wise count rates for Quadrant B Data is divided into 100 sec bins |
 |
 |
| Module-wise count rates for Quadrant C Data is divided into 100 sec bins |
 |
 |
| Module-wise count rates for Quadrant D Data is divided into 100 sec bins |
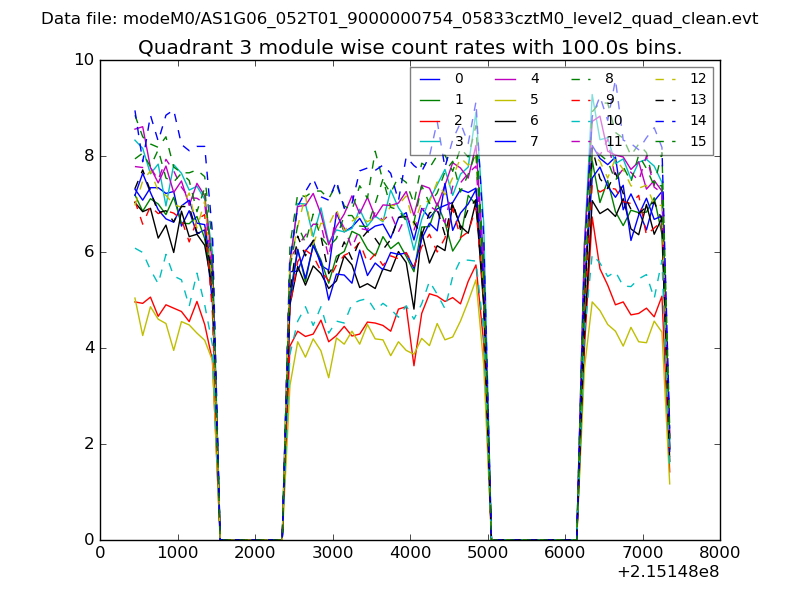 |
 |
| Parameter | Plot |
|---|---|
| CZT HV Monitor | 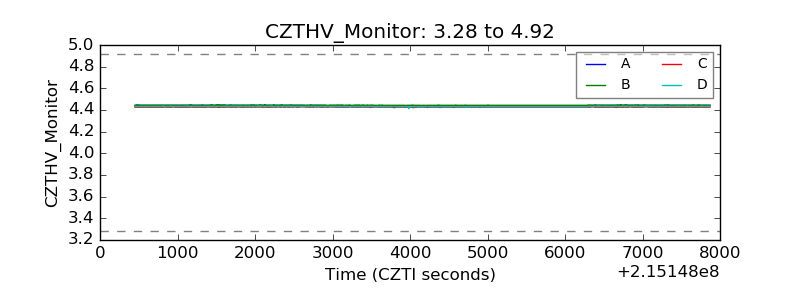 |
| D_VDD | 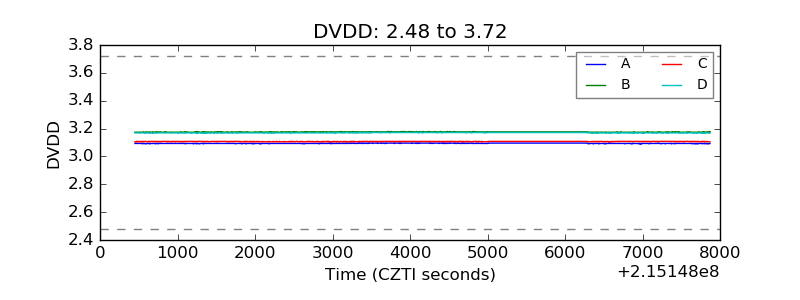 |
| Temperature 1 | 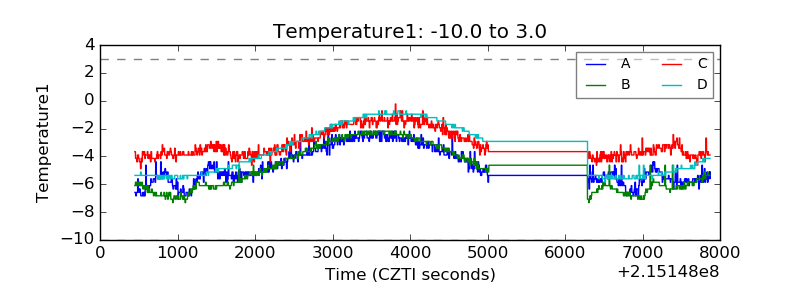 |
| Veto HV Monitor | 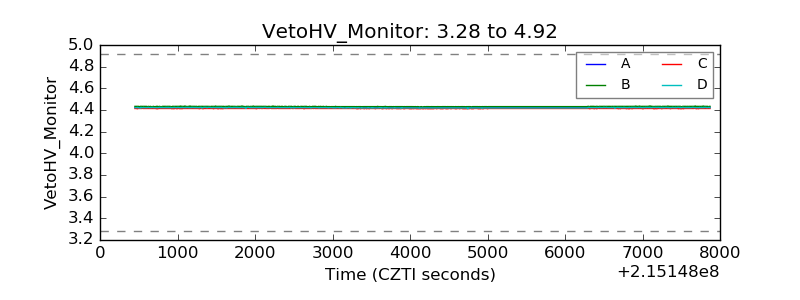 |
| Veto LLD | 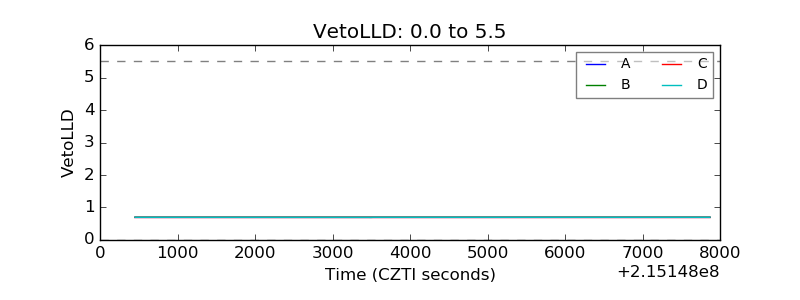 |
| Alpha Counter | 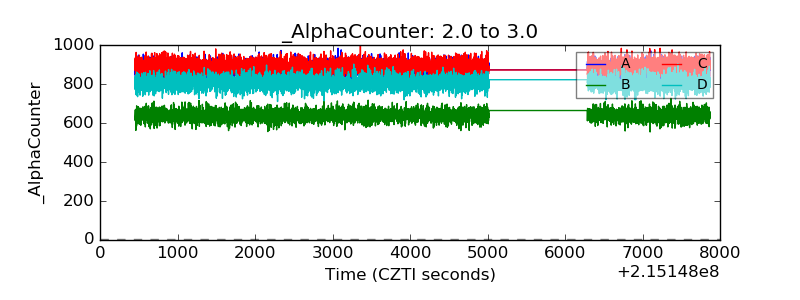 |
| _CPM_Rate | 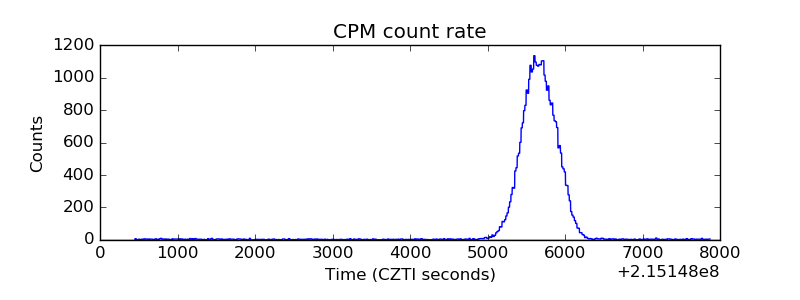 |
| CZT Counter | 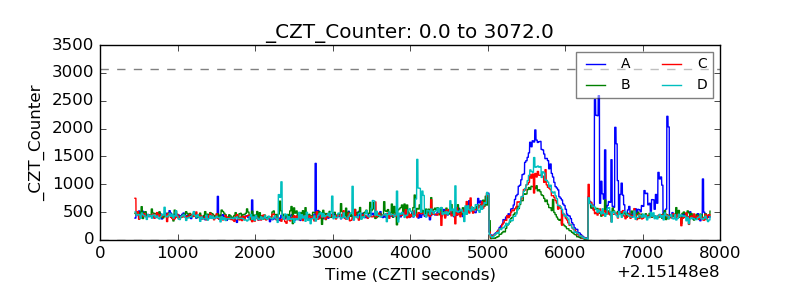 |
| +2.5 Volts monitor |  |
| +5 Volts monitor |  |
| _ROLL_ROT | 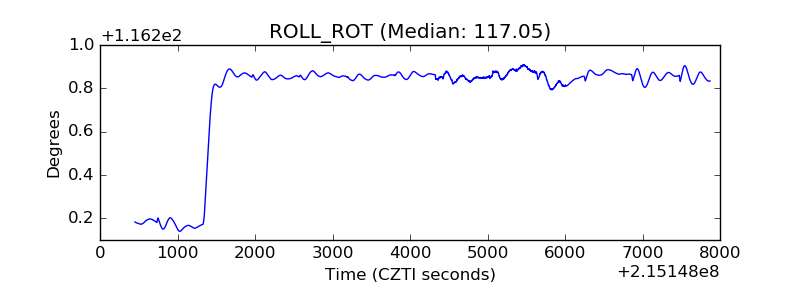 |
| _Roll_DEC | 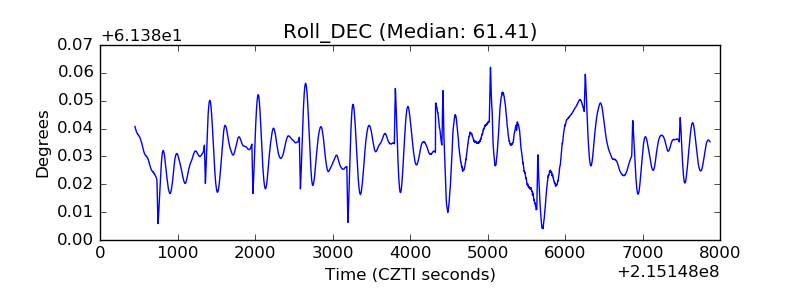 |
| _Roll_RA | 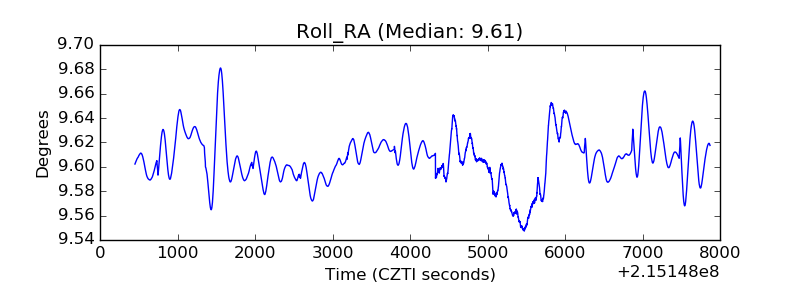 |
| Veto Counter | 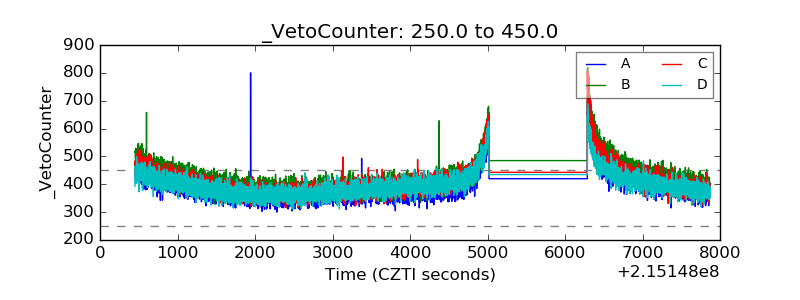 |