| Param | Original file | Final file |
|---|---|---|
| Filename | modeM0/AS1G06_052T01_9000000754_05834cztM0_level2.evt | modeM0/AS1G06_052T01_9000000754_05834cztM0_level2_quad_clean.evt |
| Size (bytes) | 415,445,760 | 73,765,440 |
| Size | 396.2 MB | 70.3 MB |
| Events in quadrant A | 3,819,947 | 460,552 |
| Events in quadrant B | 2,819,230 | 470,978 |
| Events in quadrant C | 2,595,082 | 459,226 |
| Events in quadrant D | 2,949,949 | 434,578 |
| Mode M9 | |||
|---|---|---|---|
| Quadrant | BADHDUFLAG | Total packets | Discarded packets |
| A | 0 | 12 | 0 |
| B | 0 | 12 | 0 |
| C | 0 | 12 | 0 |
| D | 0 | 12 | 0 |
| Mode SS | |||
|---|---|---|---|
| Quadrant | BADHDUFLAG | Total packets | Discarded packets |
| A | 0 | 118 | 0 |
| B | 0 | 118 | 0 |
| C | 0 | 118 | 0 |
| D | 0 | 118 | 0 |
| Mode M0 | |||
|---|---|---|---|
| Quadrant | BADHDUFLAG | Total packets | Discarded packets |
| A | 0 | 15412 | 2 |
| B | 0 | 12189 | 7 |
| C | 0 | 11956 | 5 |
| D | 0 | 12890 | 5 |
| Quadrant | Total seconds | Saturated seconds | Saturation percentage |
|---|---|---|---|
| A | 5845 | 517 | 8.845167% |
| B | 5842 | 76 | 1.300924% |
| C | 5843 | 49 | 0.838610% |
| D | 5843 | 85 | 1.454732% |
Noise dominated data is calculated using 1-second bins in cleaned event files. If a bin has >2000 counts, and if more than 50% of those come from <1% of pixels, then it is considered to be noise-dominated and hence unusable.
| Quadrant | # 1 sec bins | Bins with >0 counts | Bins with >2000 counts | High rate bins dominated by noise | Noise dominated (total time) | Noise dominated (detector-on time) | Marked lightcurve |
|---|---|---|---|---|---|---|---|
| A | 7025 | 5846 | 334 | 334 | 4.75% | 5.71% | 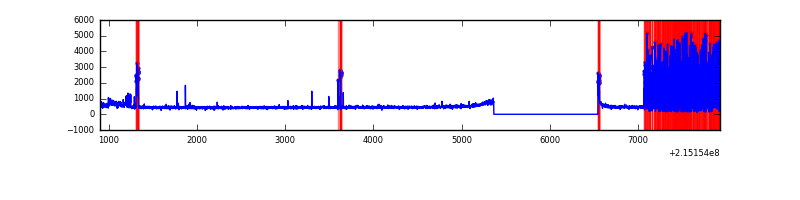 |
| B | 7025 | 5846 | 0 | 0 | 0.00% | 0.00% | 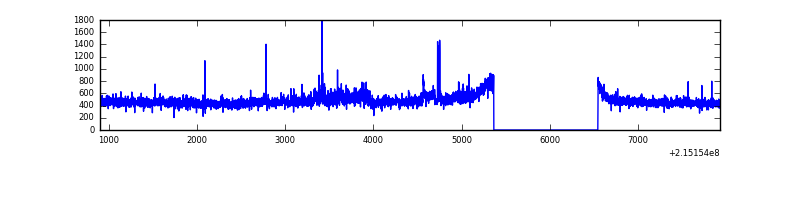 |
| C | 7025 | 5846 | 0 | 0 | 0.00% | 0.00% | 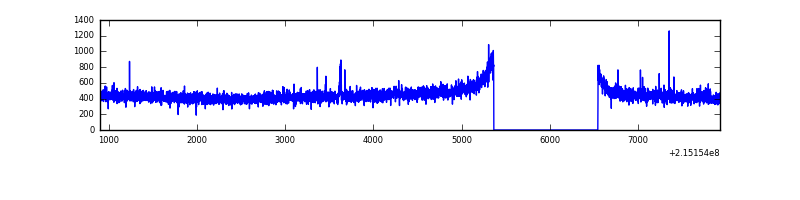 |
| D | 7025 | 5846 | 20 | 20 | 0.28% | 0.34% | 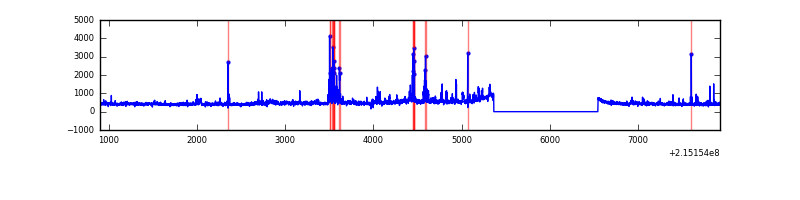 |
Top three noisy pixels from each quadrant. If the there are fewer than three noisy pixels in the level2.evt file, extra rows are filled as -1
| Pixel properties | Quadrant properties | ||||||
|---|---|---|---|---|---|---|---|
| Quadrant | DetID | PixID | Counts | Sigma | Mean | Median | Sigma |
| A | 15 | 236 | 1267522 | 9408.27 | 656 | 640 | 134.7 |
| A | 15 | 223 | 13939 | 98.76 | 656 | 640 | 134.7 |
| A | 15 | 234 | 7839 | 53.46 | 656 | 640 | 134.7 |
| B | 15 | 204 | 81493 | 626.67 | 686 | 669 | 129.0 |
| B | 4 | 81 | 41285 | 314.92 | 686 | 669 | 129.0 |
| B | 0 | 219 | 28073 | 212.48 | 686 | 669 | 129.0 |
| C | 14 | 67 | 28860 | 188.15 | 653 | 656 | 149.9 |
| C | 1 | 16 | 13791 | 87.63 | 653 | 656 | 149.9 |
| C | 13 | 61 | 5238 | 30.57 | 653 | 656 | 149.9 |
| D | 2 | 152 | 268781 | 1693.38 | 652 | 631 | 158.4 |
| D | 11 | 241 | 112888 | 708.91 | 652 | 631 | 158.4 |
| D | 9 | 85 | 58846 | 367.63 | 652 | 631 | 158.4 |
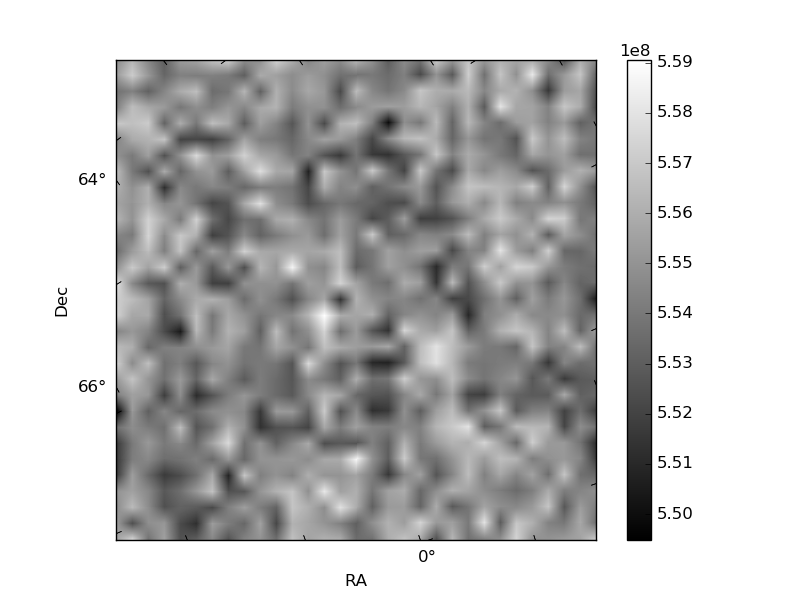
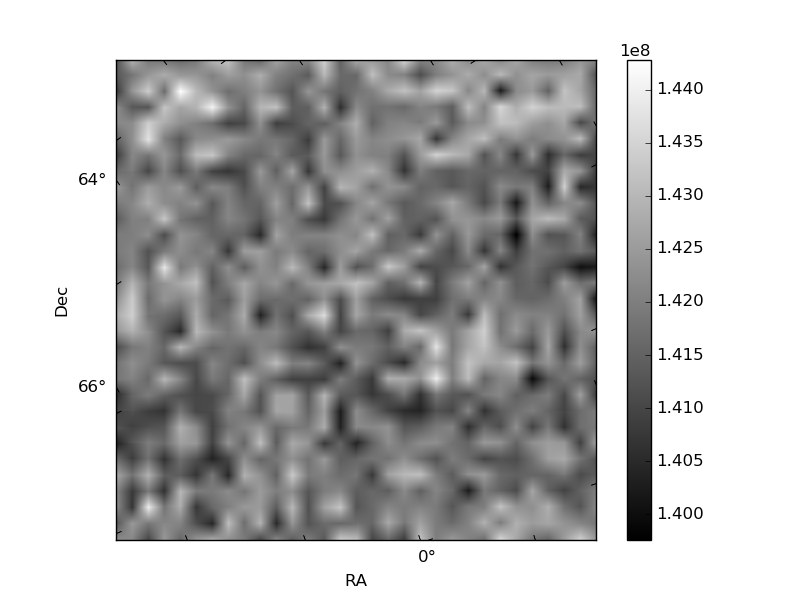
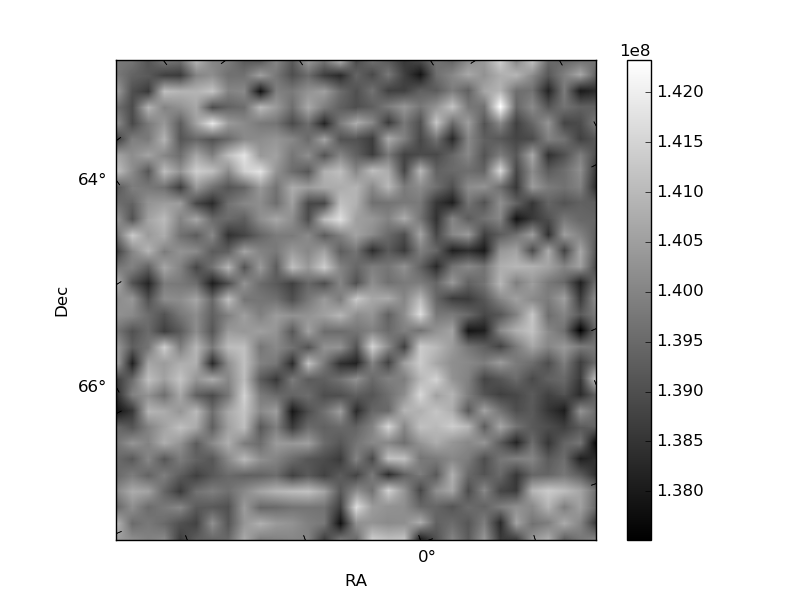
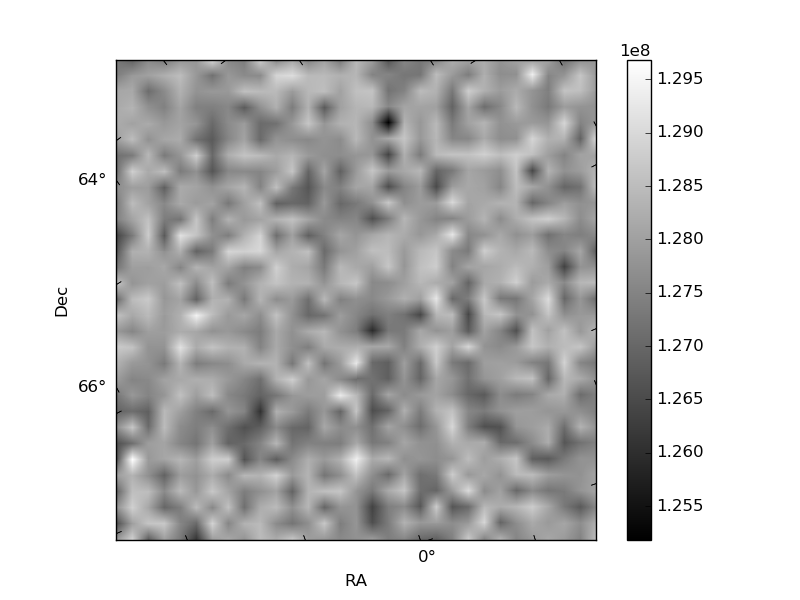
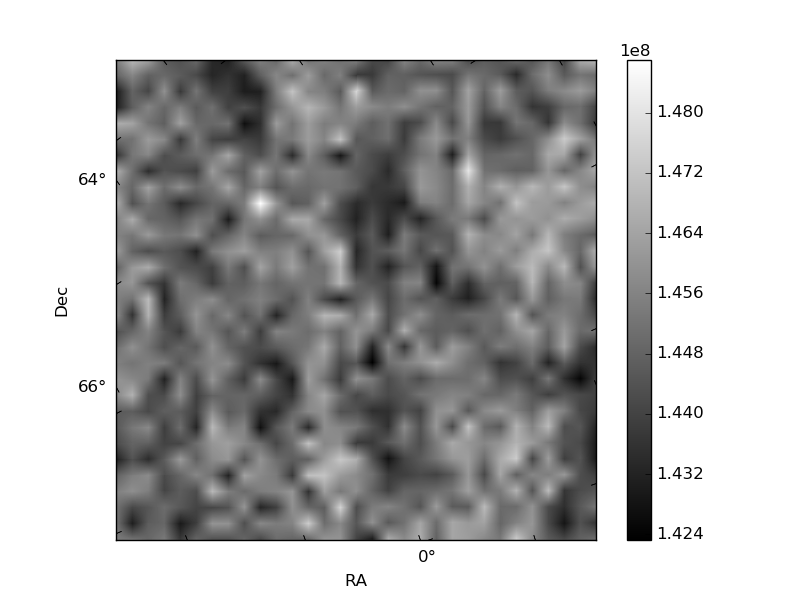
Histogram calculated using DETX and DETY for each event in the final _common_clean file
| Quadrant A | 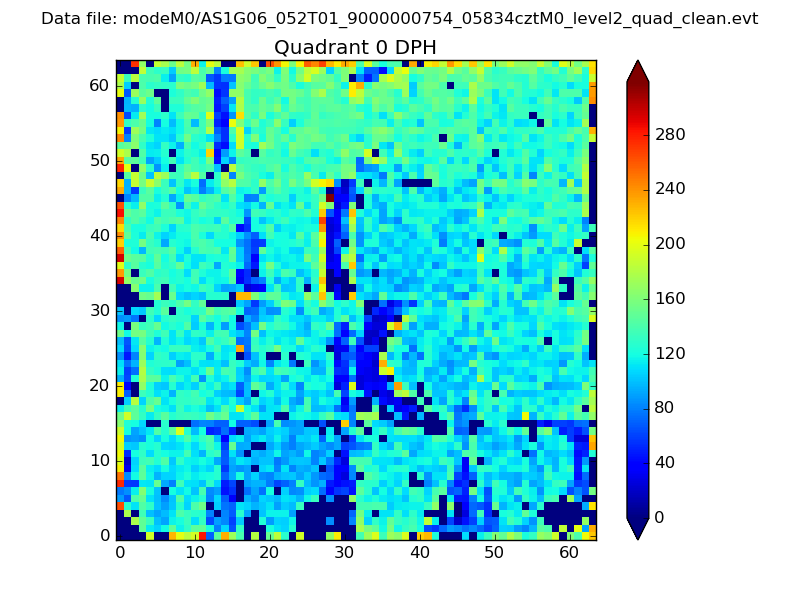 |
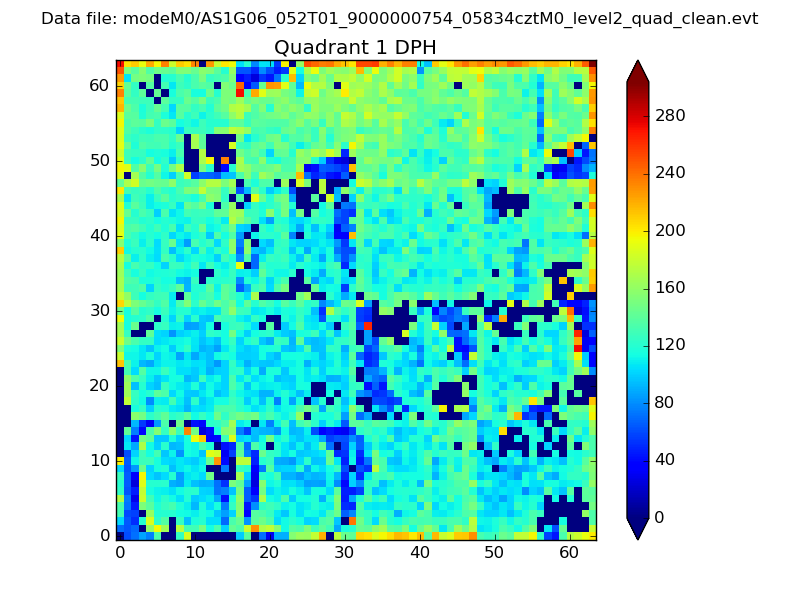 |
Quadrant B |
|---|---|---|---|
| Quadrant D | 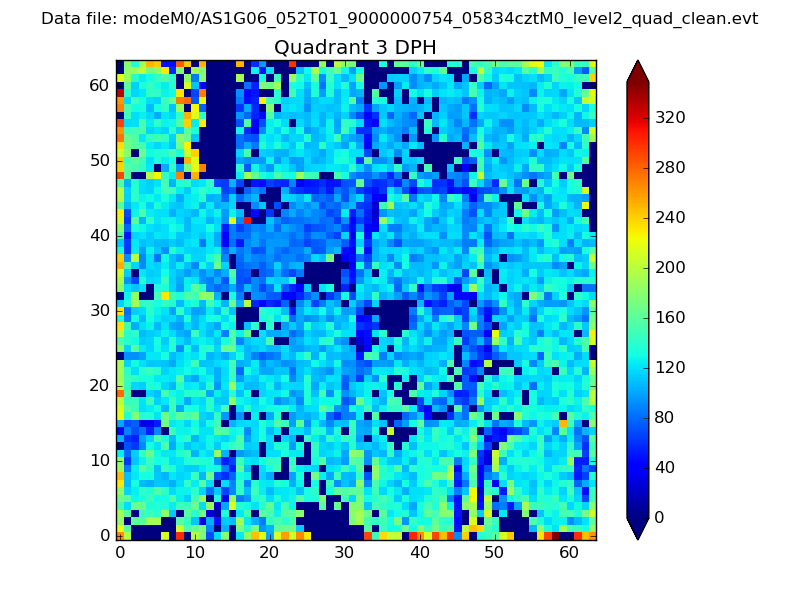 |
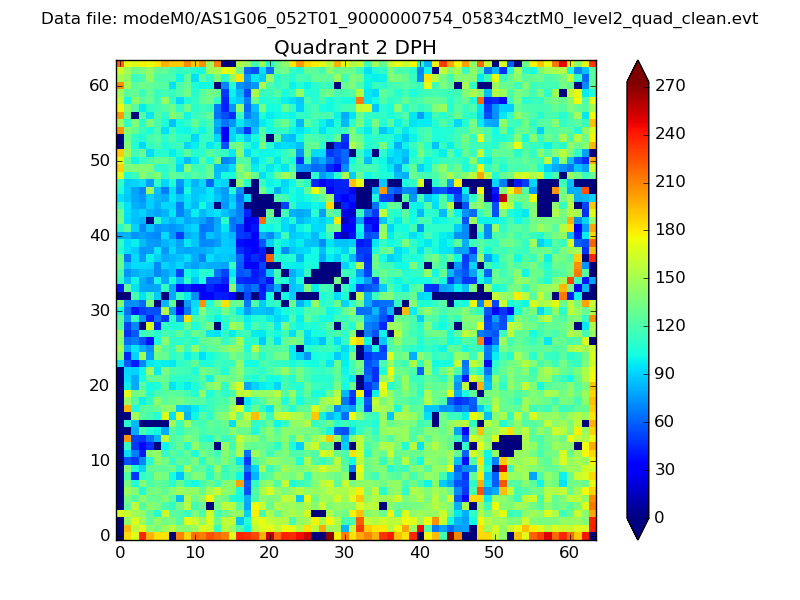 |
Quadrant C |
| Plot type | Count rate plots | Images |
|---|---|---|
| Comparison with Poisson distribution Blue bars denote a histogram of data divided into 1 sec bins. Red curve is a Poisson curve with rate = median count rate of data. |
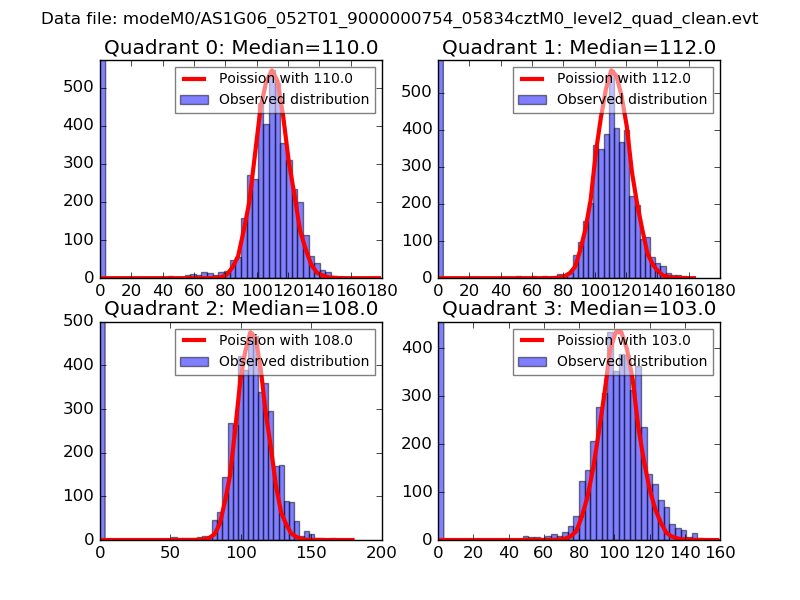 |
 |
| Quadrant-wise count rates Data is divided into 100 sec bins |
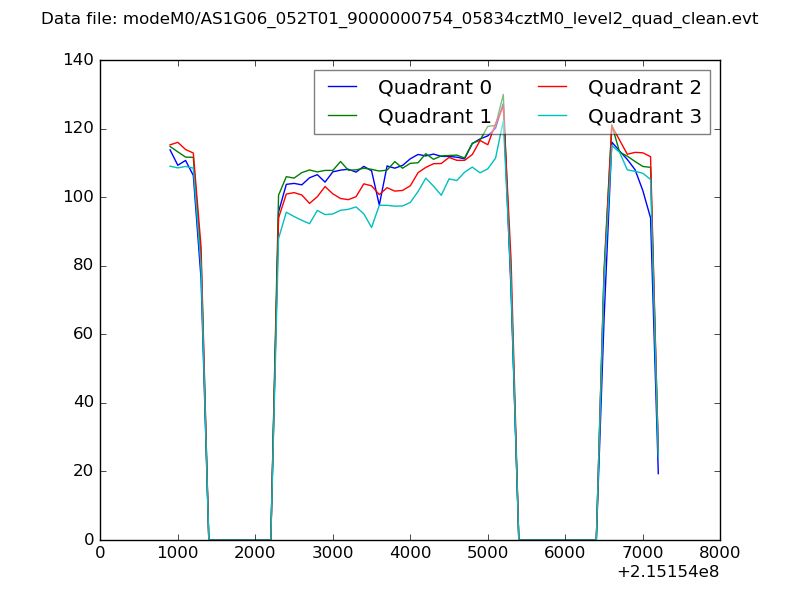 |
|
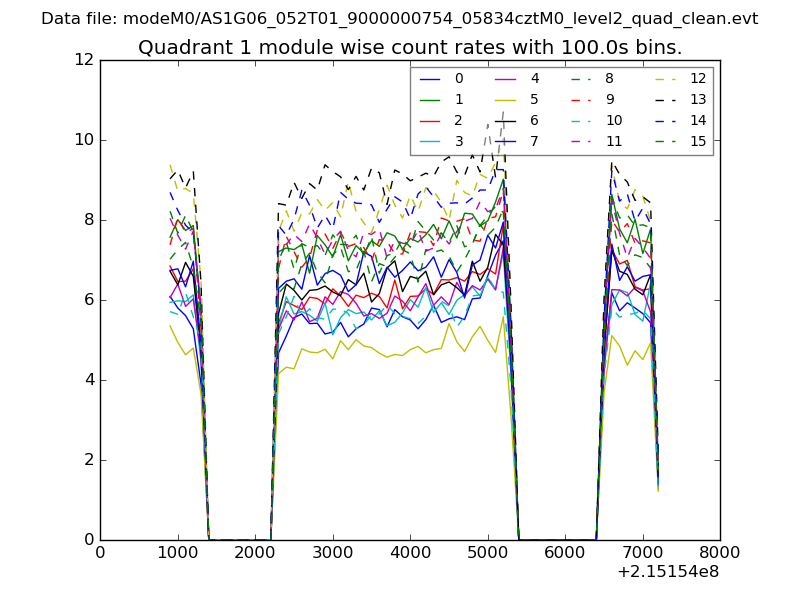
| Module-wise count rates for Quadrant A Data is divided into 100 sec bins |
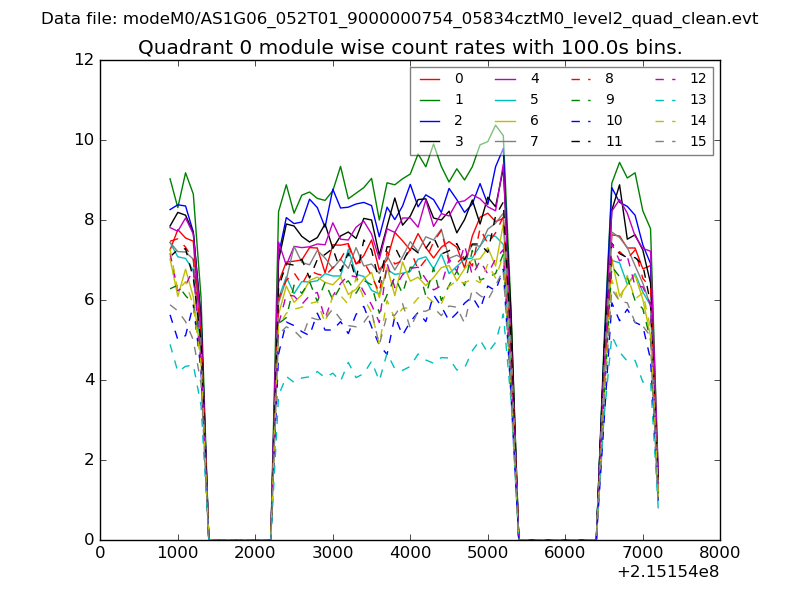 |
 |
| Module-wise count rates for Quadrant B Data is divided into 100 sec bins |
 |
 |
| Module-wise count rates for Quadrant C Data is divided into 100 sec bins |
 |
 |
| Module-wise count rates for Quadrant D Data is divided into 100 sec bins |
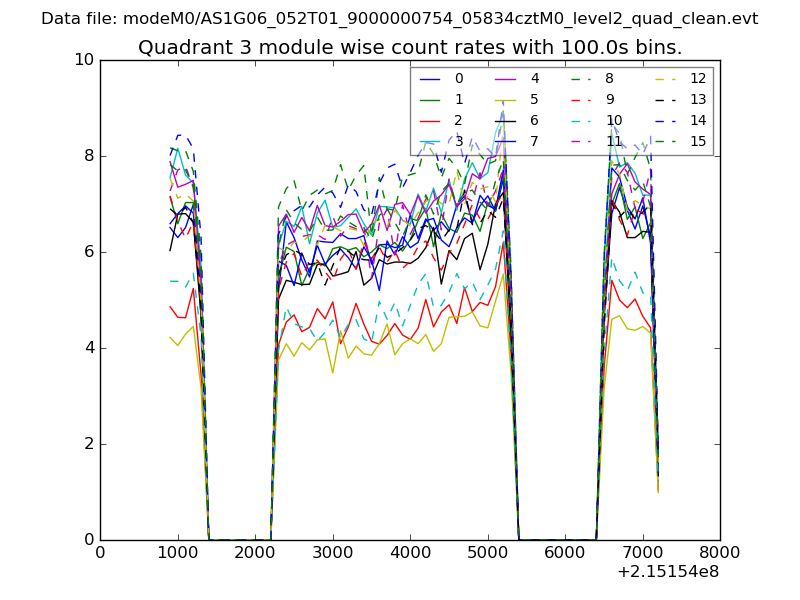 |
 |
| Parameter | Plot |
|---|---|
| CZT HV Monitor | 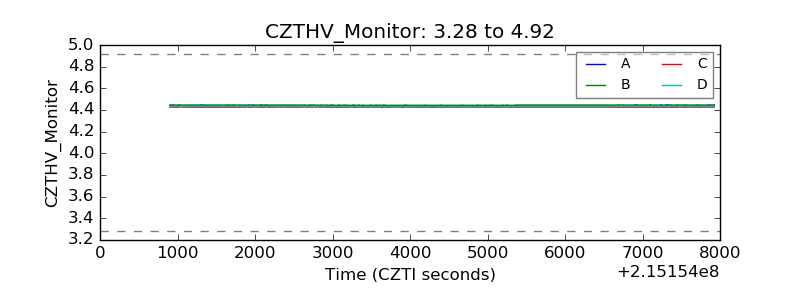 |
| D_VDD | 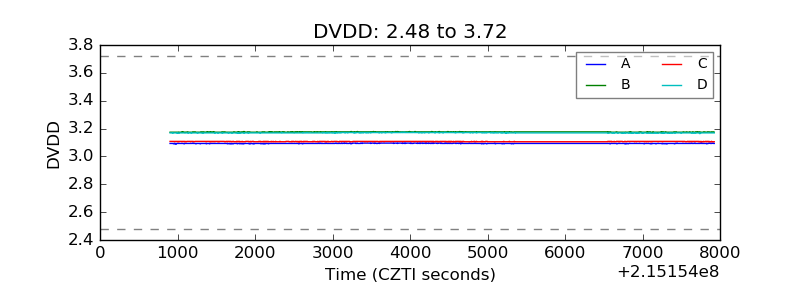 |
| Temperature 1 | 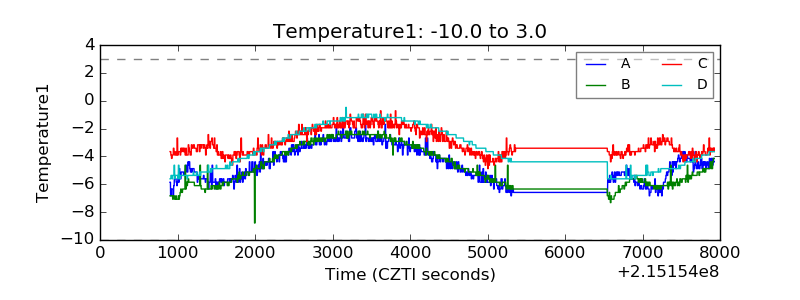 |
| Veto HV Monitor | 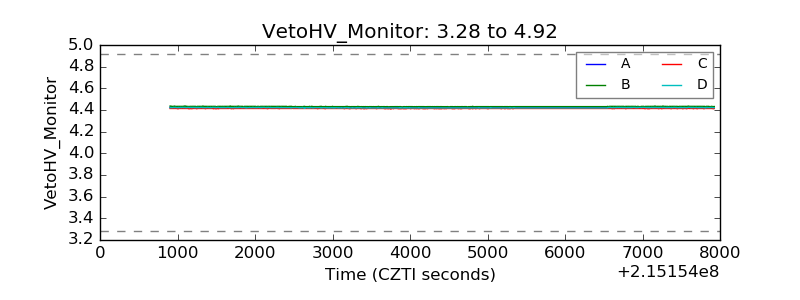 |
| Veto LLD | 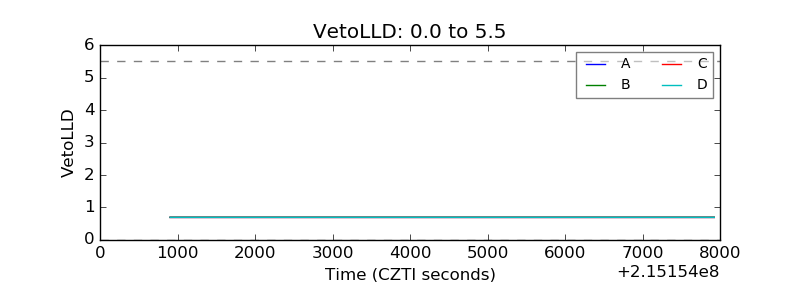 |
| Alpha Counter | 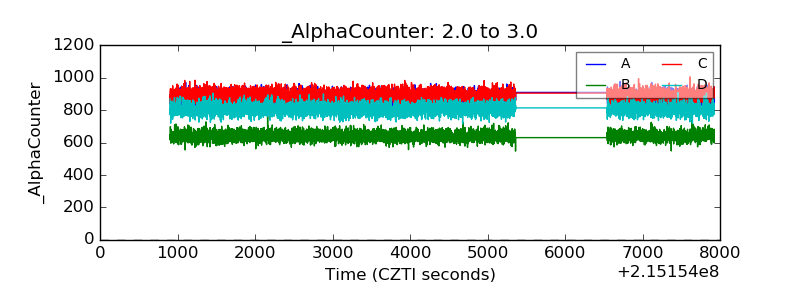 |
| _CPM_Rate | 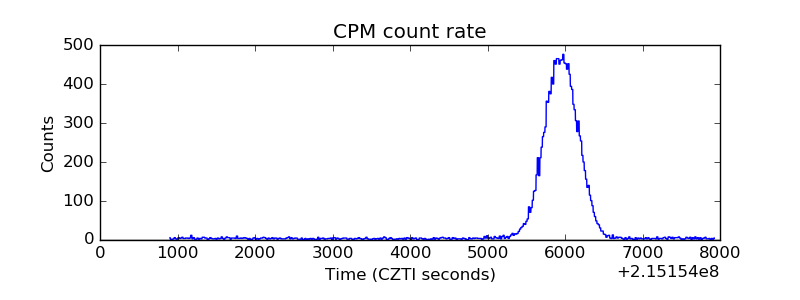 |
| CZT Counter | 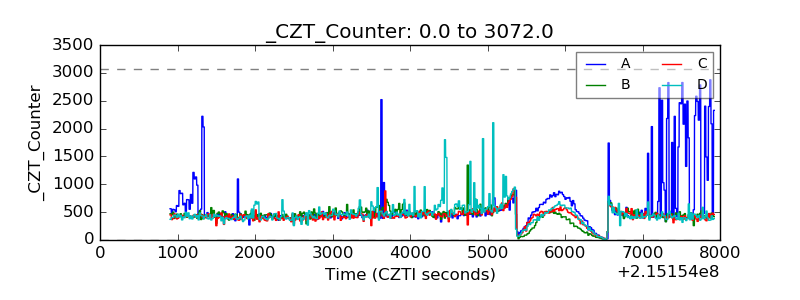 |
| +2.5 Volts monitor |  |
| +5 Volts monitor |  |
| _ROLL_ROT | 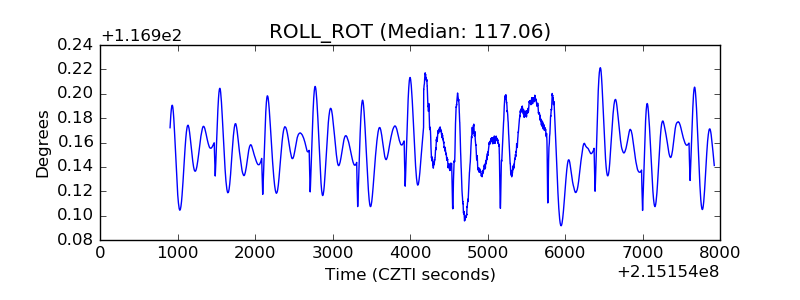 |
| _Roll_DEC | 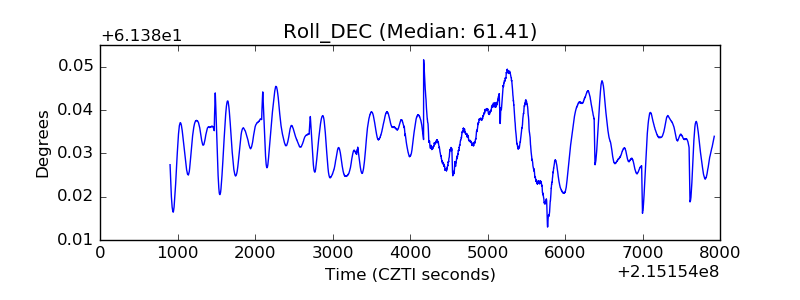 |
| _Roll_RA | 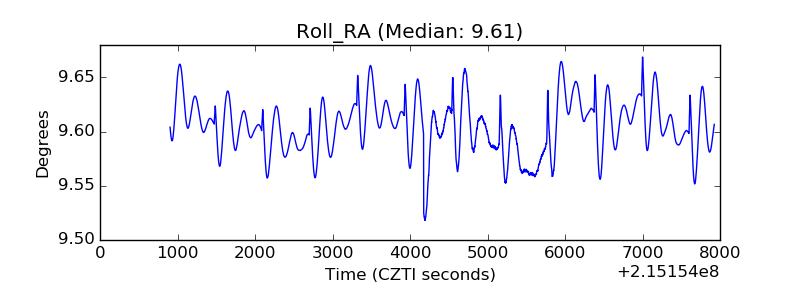 |
| Veto Counter | 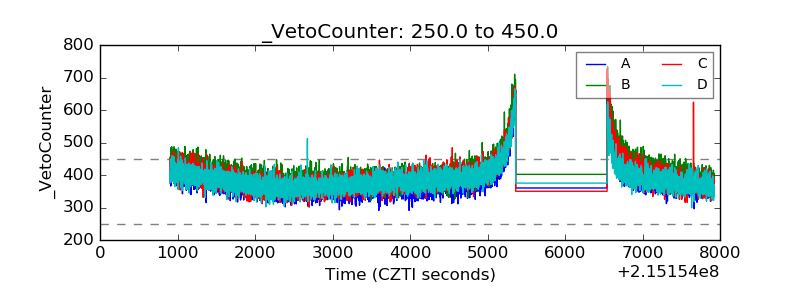 |