| Param | Original file | Final file |
|---|---|---|
| Filename | modeM0/AS1G06_052T01_9000000754_05835cztM0_level2.evt | modeM0/AS1G06_052T01_9000000754_05835cztM0_level2_quad_clean.evt |
| Size (bytes) | 455,731,200 | 72,380,160 |
| Size | 434.6 MB | 69.0 MB |
| Events in quadrant A | 4,931,612 | 423,819 |
| Events in quadrant B | 2,844,183 | 460,829 |
| Events in quadrant C | 2,698,894 | 450,328 |
| Events in quadrant D | 2,912,722 | 430,959 |
| Mode M9 | |||
|---|---|---|---|
| Quadrant | BADHDUFLAG | Total packets | Discarded packets |
| A | 0 | 9 | 0 |
| B | 0 | 9 | 0 |
| C | 0 | 9 | 0 |
| D | 0 | 9 | 0 |
| Mode SS | |||
|---|---|---|---|
| Quadrant | BADHDUFLAG | Total packets | Discarded packets |
| A | 0 | 122 | 0 |
| B | 0 | 122 | 0 |
| C | 0 | 122 | 0 |
| D | 0 | 122 | 0 |
| Mode M0 | |||
|---|---|---|---|
| Quadrant | BADHDUFLAG | Total packets | Discarded packets |
| A | 0 | 18961 | 2 |
| B | 0 | 12571 | 1 |
| C | 0 | 12498 | 1 |
| D | 0 | 13066 | 1 |
| Quadrant | Total seconds | Saturated seconds | Saturation percentage |
|---|---|---|---|
| A | 6094 | 1087 | 17.837217% |
| B | 6094 | 148 | 2.428618% |
| C | 6094 | 113 | 1.854283% |
| D | 6094 | 140 | 2.297342% |
Noise dominated data is calculated using 1-second bins in cleaned event files. If a bin has >2000 counts, and if more than 50% of those come from <1% of pixels, then it is considered to be noise-dominated and hence unusable.
| Quadrant | # 1 sec bins | Bins with >0 counts | Bins with >2000 counts | High rate bins dominated by noise | Noise dominated (total time) | Noise dominated (detector-on time) | Marked lightcurve |
|---|---|---|---|---|---|---|---|
| A | 6959 | 6094 | 749 | 749 | 10.76% | 12.29% |  |
| B | 6959 | 6094 | 2 | 2 | 0.03% | 0.03% |  |
| C | 6959 | 6095 | 0 | 0 | 0.00% | 0.00% |  |
| D | 6959 | 6095 | 16 | 16 | 0.23% | 0.26% | 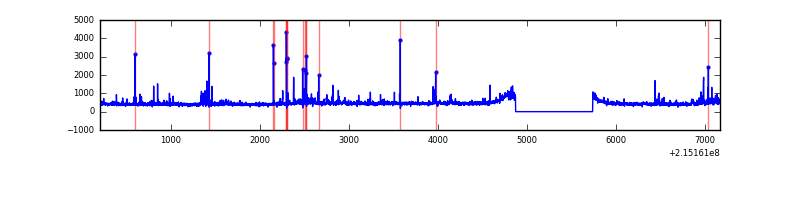 |
Top three noisy pixels from each quadrant. If the there are fewer than three noisy pixels in the level2.evt file, extra rows are filled as -1
| Pixel properties | Quadrant properties | ||||||
|---|---|---|---|---|---|---|---|
| Quadrant | DetID | PixID | Counts | Sigma | Mean | Median | Sigma |
| A | 15 | 236 | 2422809 | 18294.3 | 646 | 629 | 132.4 |
| A | 15 | 234 | 13657 | 98.4 | 646 | 629 | 132.4 |
| A | 12 | 194 | 6403 | 43.61 | 646 | 629 | 132.4 |
| B | 15 | 204 | 46942 | 341.24 | 708 | 689 | 135.5 |
| B | 0 | 219 | 26567 | 190.92 | 708 | 689 | 135.5 |
| B | 12 | 111 | 12572 | 87.67 | 708 | 689 | 135.5 |
| C | 1 | 16 | 20883 | 128.81 | 681 | 683 | 156.8 |
| C | 7 | 234 | 13189 | 79.74 | 681 | 683 | 156.8 |
| C | 14 | 67 | 7580 | 43.98 | 681 | 683 | 156.8 |
| D | 2 | 152 | 167872 | 999.49 | 680 | 655 | 167.3 |
| D | 12 | 233 | 51960 | 306.66 | 680 | 655 | 167.3 |
| D | 9 | 85 | 49053 | 289.28 | 680 | 655 | 167.3 |
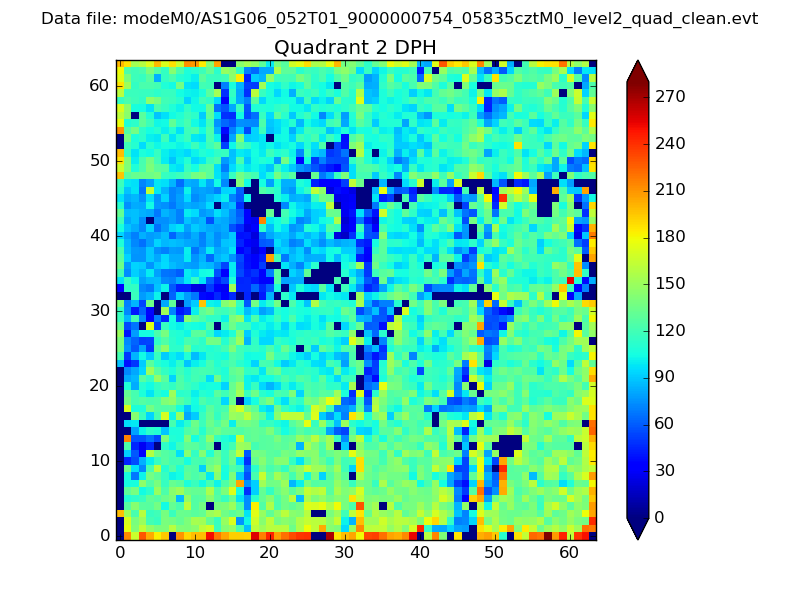
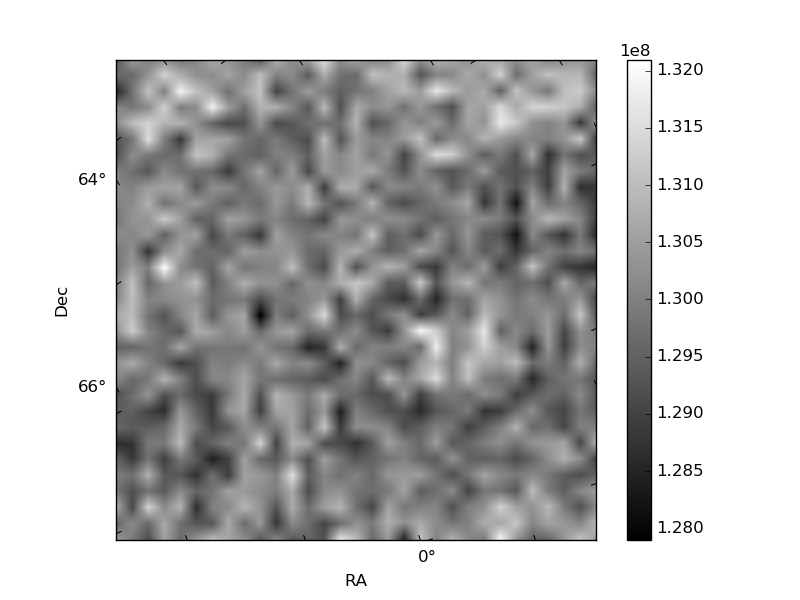
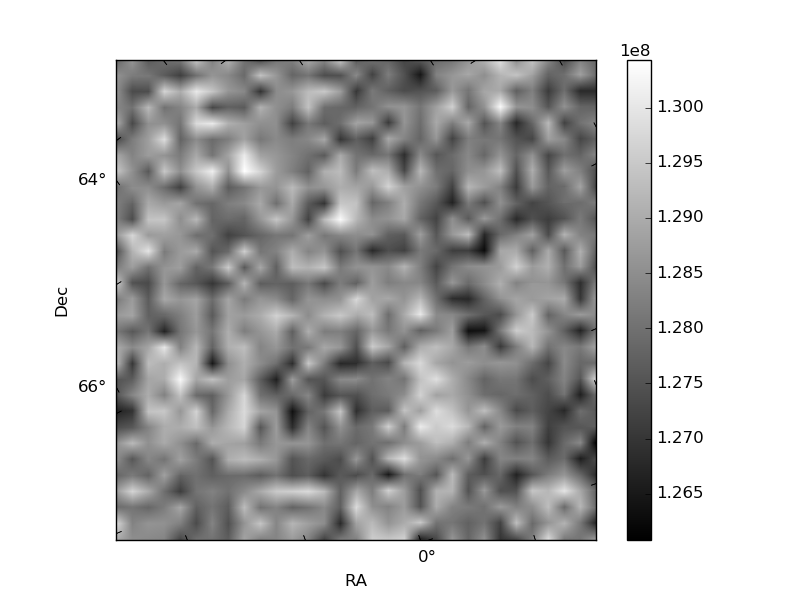
Histogram calculated using DETX and DETY for each event in the final _common_clean file
| Quadrant A | 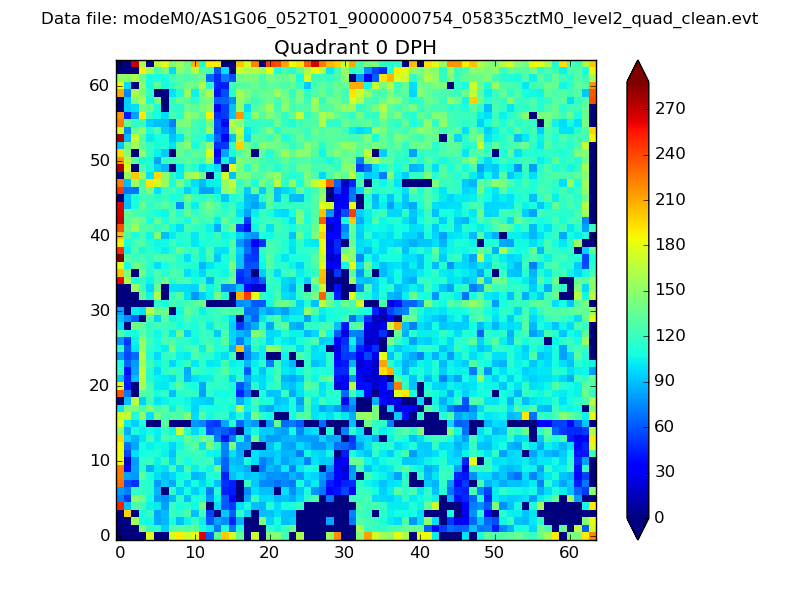 |
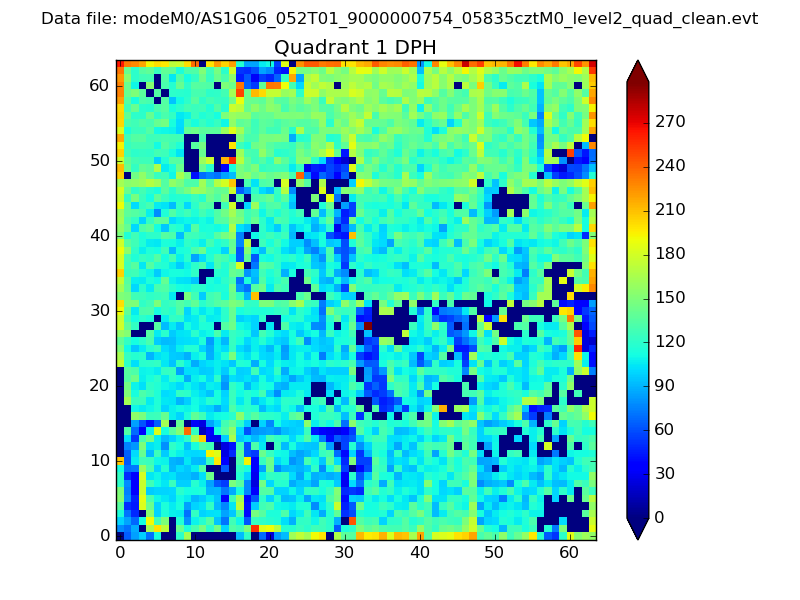 |
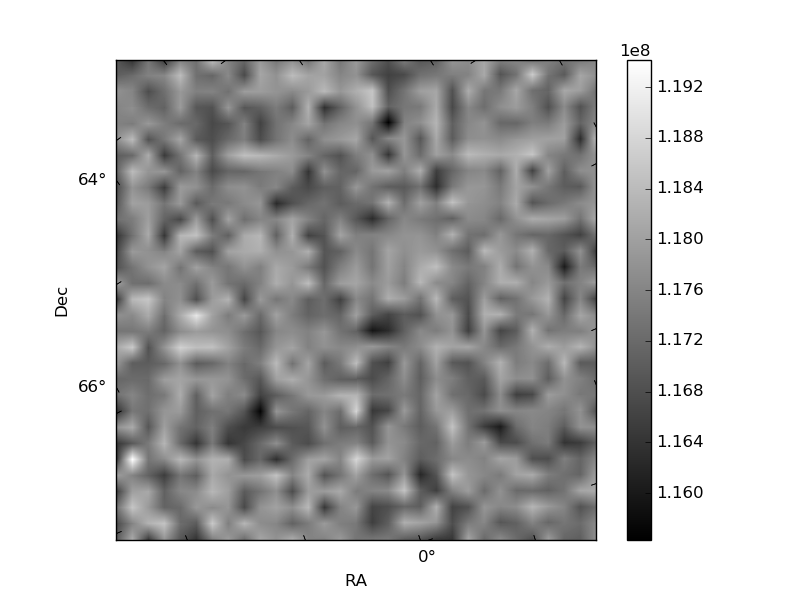
Quadrant B |
|---|---|---|---|
| Quadrant D | 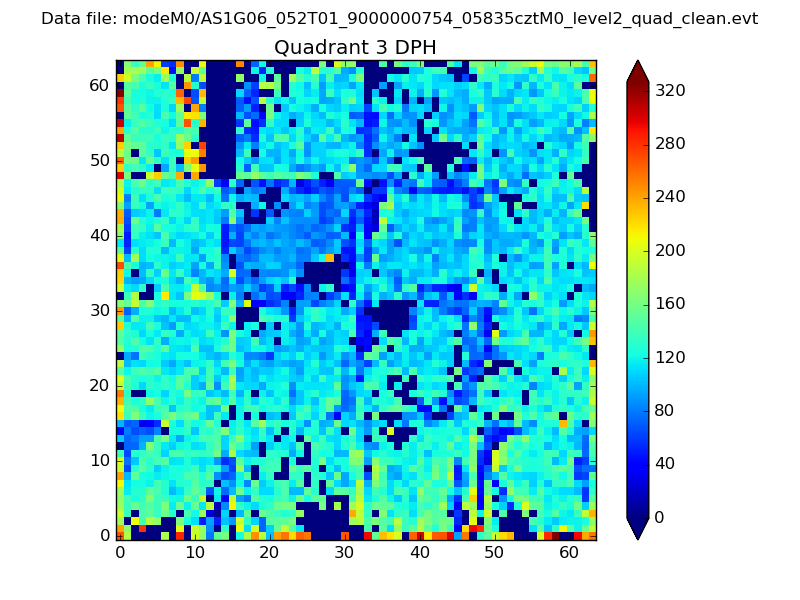 |
 |
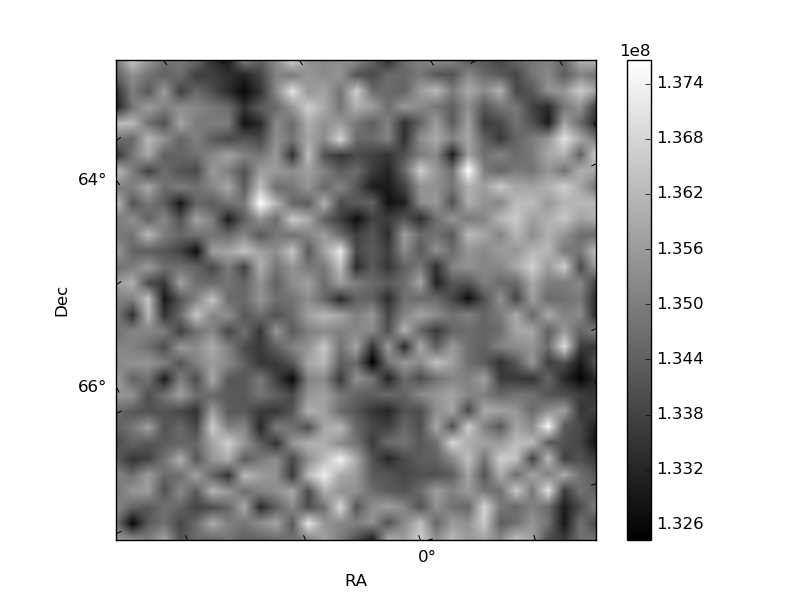
Quadrant C |
| Plot type | Count rate plots | Images |
|---|---|---|
| Comparison with Poisson distribution Blue bars denote a histogram of data divided into 1 sec bins. Red curve is a Poisson curve with rate = median count rate of data. |
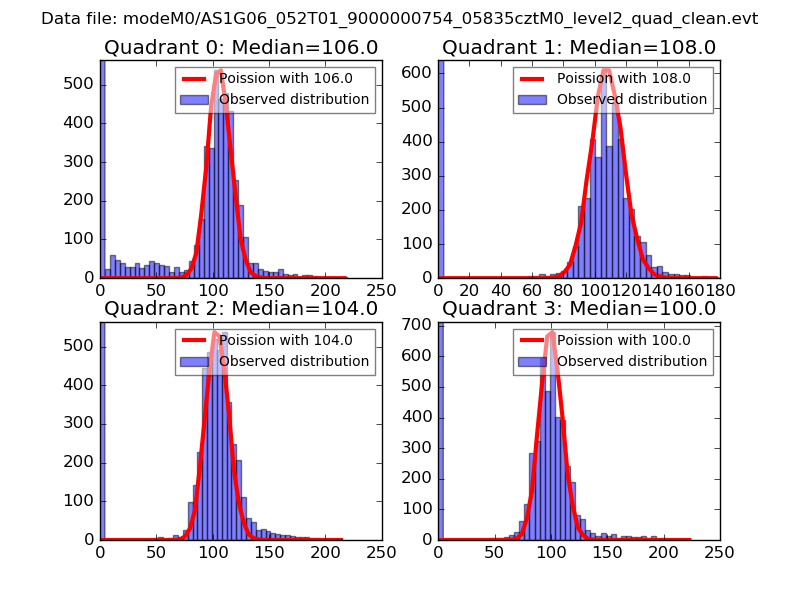 |
 |
| Quadrant-wise count rates Data is divided into 100 sec bins |
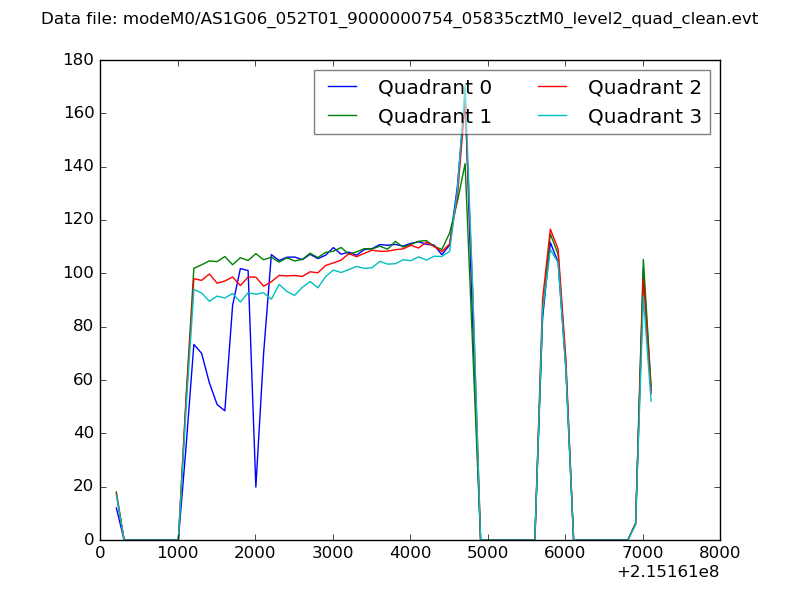 |
|
| Module-wise count rates for Quadrant A Data is divided into 100 sec bins |
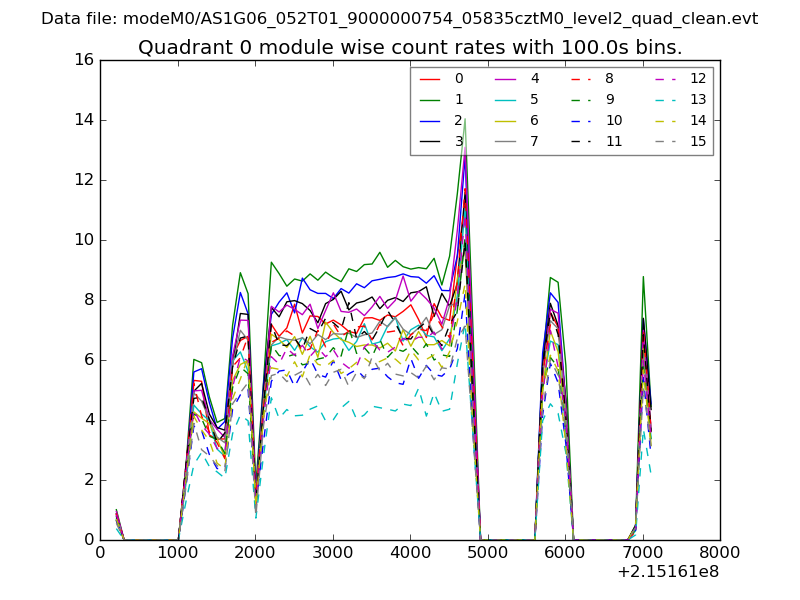 |
 |
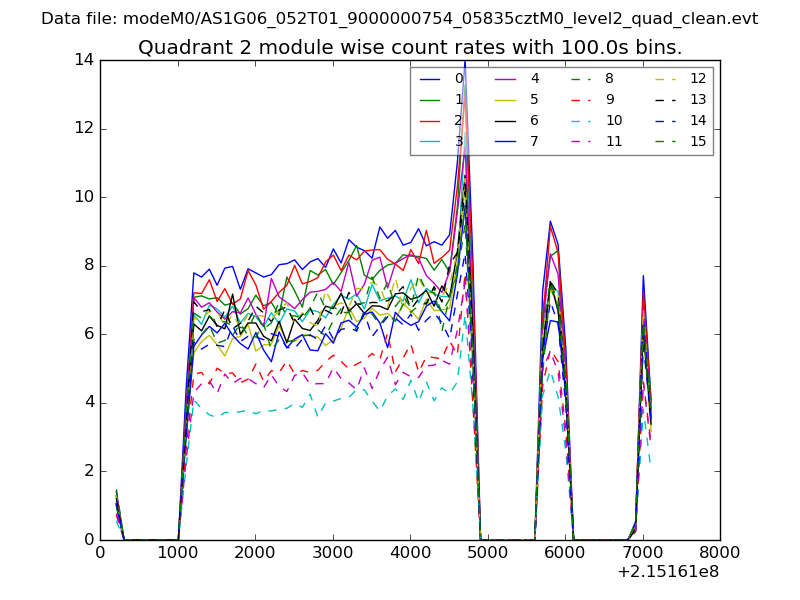
| Module-wise count rates for Quadrant B Data is divided into 100 sec bins |
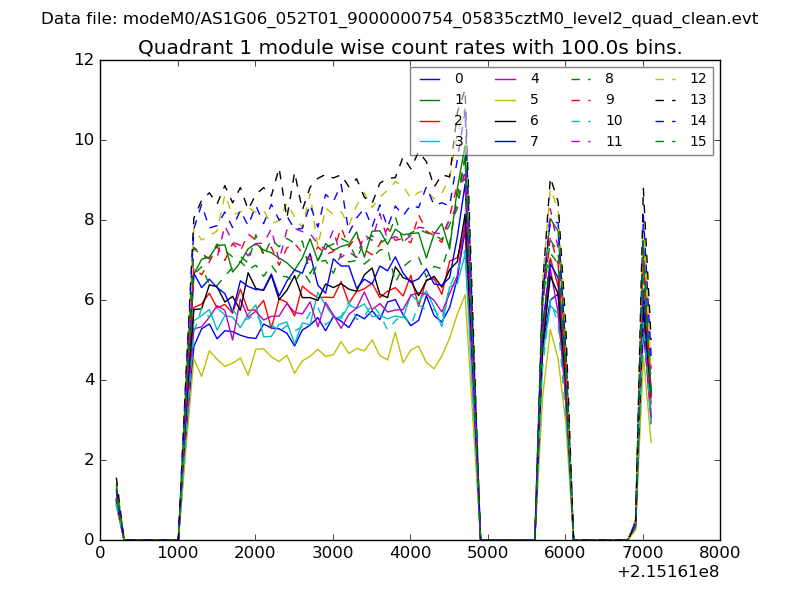 |
 |
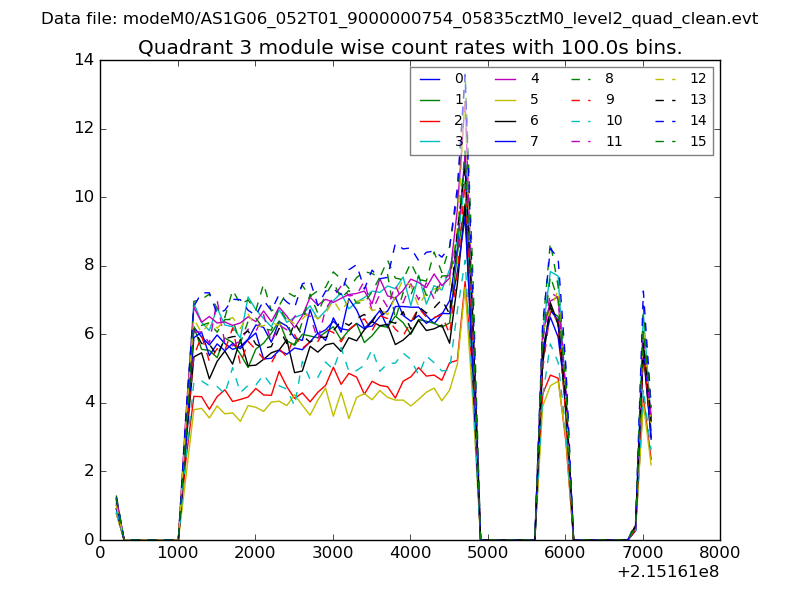
| Module-wise count rates for Quadrant C Data is divided into 100 sec bins |
 |
 |
| Module-wise count rates for Quadrant D Data is divided into 100 sec bins |
 |
 |
| Parameter | Plot |
|---|---|
| CZT HV Monitor | 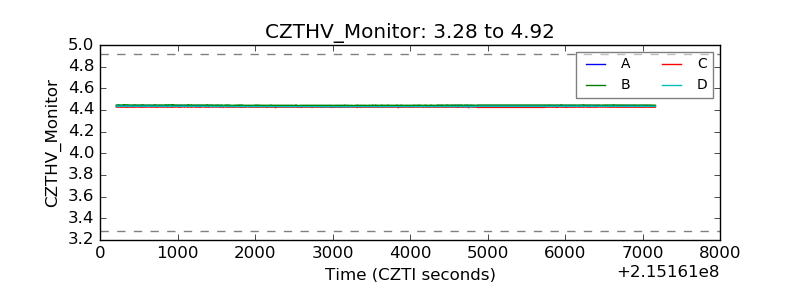 |
| D_VDD | 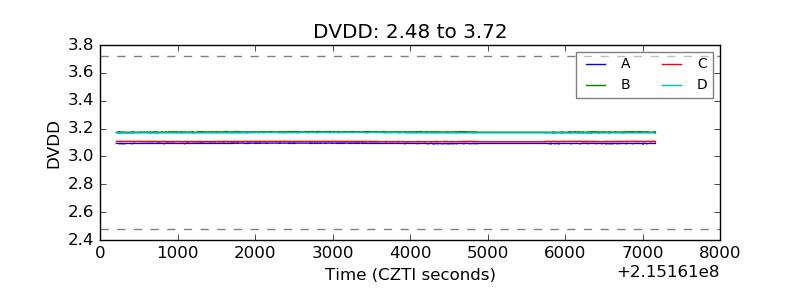 |
| Temperature 1 | 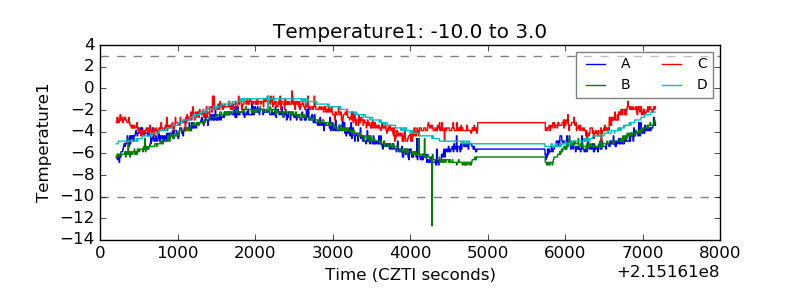 |
| Veto HV Monitor | 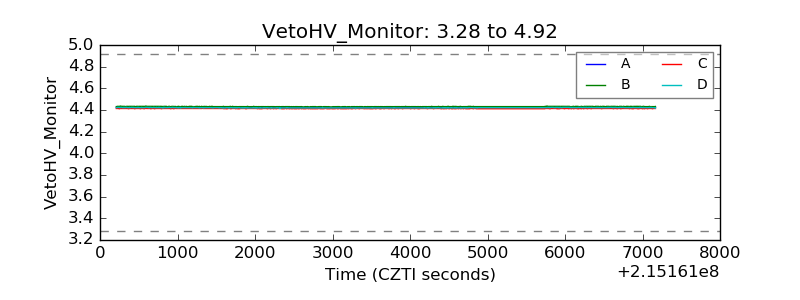 |
| Veto LLD | 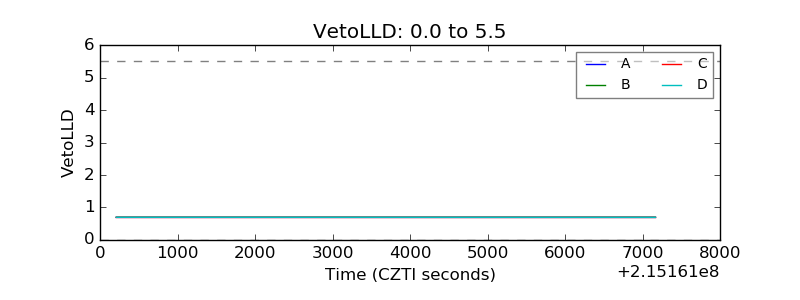 |
| Alpha Counter | 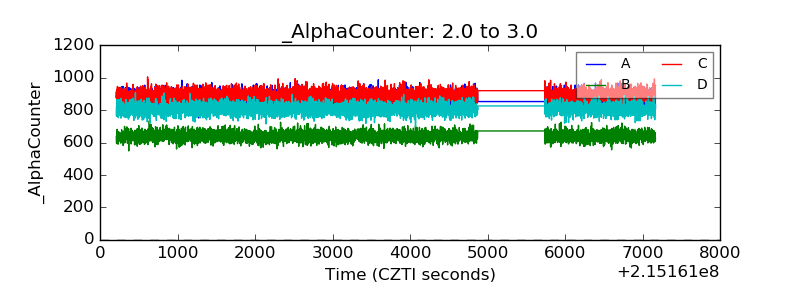 |
| _CPM_Rate | 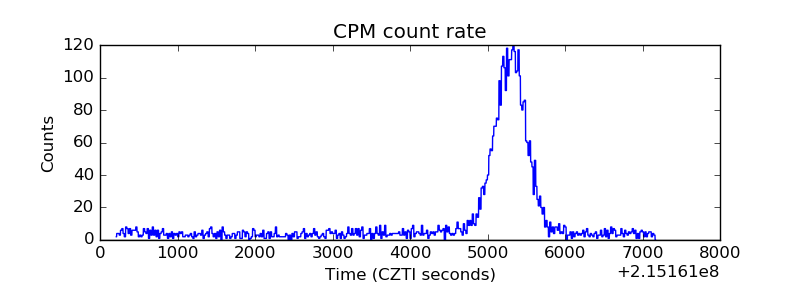 |
| CZT Counter | 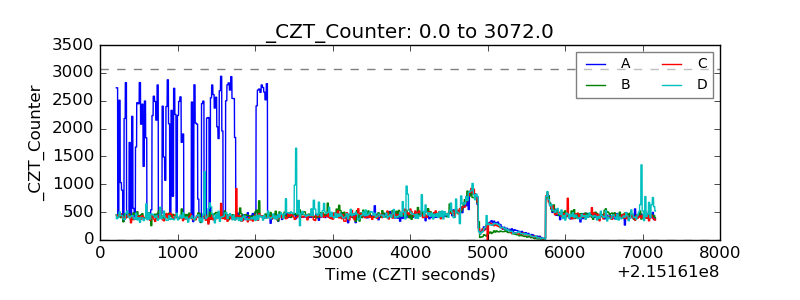 |
| +2.5 Volts monitor | 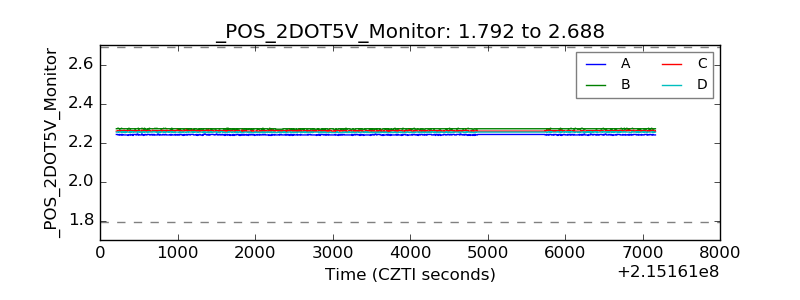 |
| +5 Volts monitor |  |
| _ROLL_ROT | 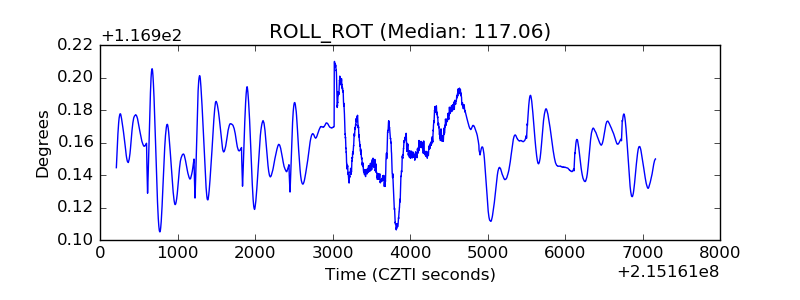 |
| _Roll_DEC | 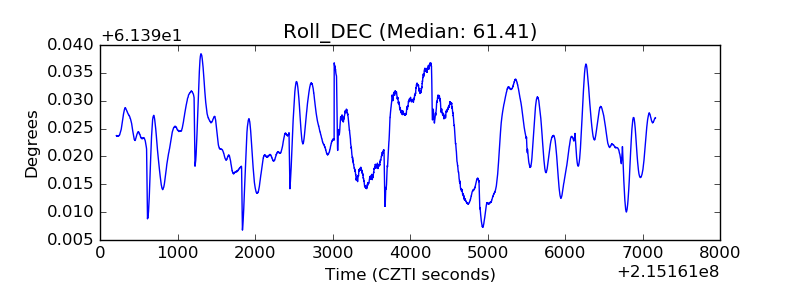 |
| _Roll_RA | 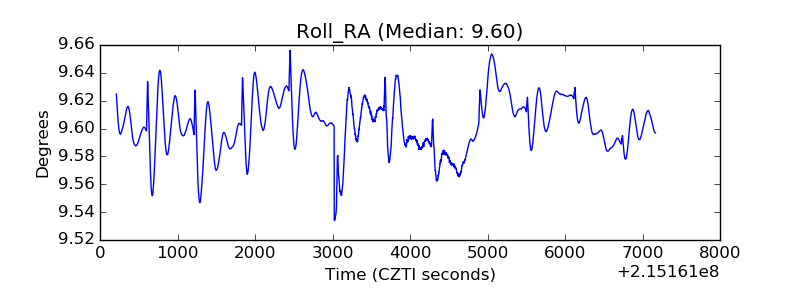 |
| Veto Counter | 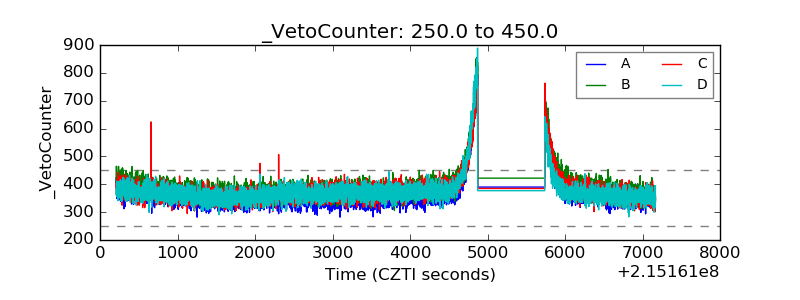 |