| Param | Original file | Final file |
|---|---|---|
| Filename | modeM0/AS1G06_052T01_9000000754_05836cztM0_level2.evt | modeM0/AS1G06_052T01_9000000754_05836cztM0_level2_quad_clean.evt |
| Size (bytes) | 468,544,320 | 95,299,200 |
| Size | 446.8 MB | 90.9 MB |
| Events in quadrant A | 3,333,193 | 602,960 |
| Events in quadrant B | 3,446,573 | 599,515 |
| Events in quadrant C | 3,300,932 | 591,478 |
| Events in quadrant D | 3,601,040 | 572,118 |
| Mode M9 | |||
|---|---|---|---|
| Quadrant | BADHDUFLAG | Total packets | Discarded packets |
| A | 0 | 5 | 0 |
| B | 0 | 5 | 0 |
| C | 0 | 5 | 0 |
| D | 0 | 6 | 0 |
| Mode SS | |||
|---|---|---|---|
| Quadrant | BADHDUFLAG | Total packets | Discarded packets |
| A | 0 | 152 | 0 |
| B | 0 | 152 | 0 |
| C | 0 | 152 | 0 |
| D | 0 | 152 | 0 |
| Mode M0 | |||
|---|---|---|---|
| Quadrant | BADHDUFLAG | Total packets | Discarded packets |
| A | 0 | 15307 | 3 |
| B | 0 | 15375 | 2 |
| C | 0 | 15373 | 2 |
| D | 0 | 16160 | 2 |
| Quadrant | Total seconds | Saturated seconds | Saturation percentage |
|---|---|---|---|
| A | 7468 | 167 | 2.236208% |
| B | 7468 | 165 | 2.209427% |
| C | 7468 | 116 | 1.553294% |
| D | 7468 | 126 | 1.687199% |
Noise dominated data is calculated using 1-second bins in cleaned event files. If a bin has >2000 counts, and if more than 50% of those come from <1% of pixels, then it is considered to be noise-dominated and hence unusable.
| Quadrant | # 1 sec bins | Bins with >0 counts | Bins with >2000 counts | High rate bins dominated by noise | Noise dominated (total time) | Noise dominated (detector-on time) | Marked lightcurve |
|---|---|---|---|---|---|---|---|
| A | 7968 | 7469 | 4 | 4 | 0.05% | 0.05% | 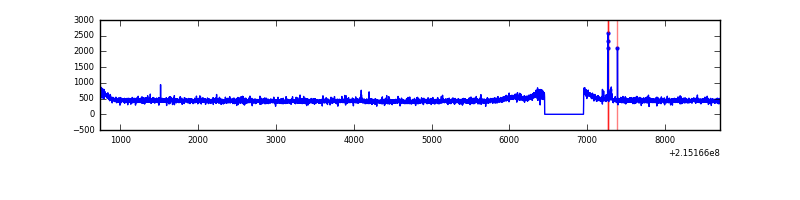 |
| B | 7968 | 7469 | 2 | 2 | 0.03% | 0.03% | 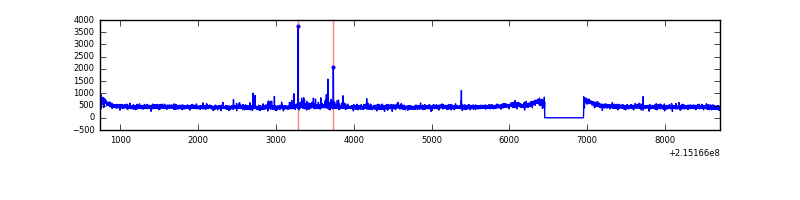 |
| C | 7968 | 7469 | 0 | 0 | 0.00% | 0.00% | 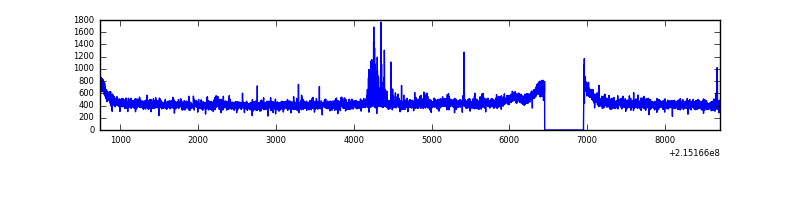 |
| D | 7968 | 7469 | 10 | 10 | 0.13% | 0.13% | 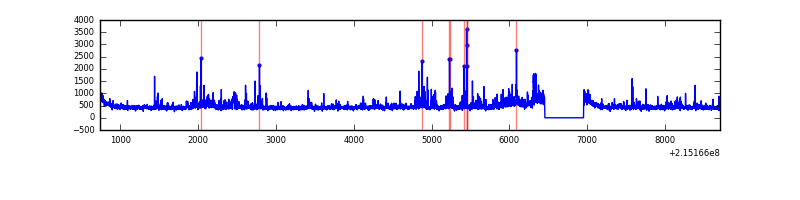 |
Top three noisy pixels from each quadrant. If the there are fewer than three noisy pixels in the level2.evt file, extra rows are filled as -1
| Pixel properties | Quadrant properties | ||||||
|---|---|---|---|---|---|---|---|
| Quadrant | DetID | PixID | Counts | Sigma | Mean | Median | Sigma |
| A | 15 | 234 | 28903 | 160.79 | 857 | 837 | 174.5 |
| A | 12 | 194 | 8357 | 43.08 | 857 | 837 | 174.5 |
| A | 0 | 226 | 8240 | 42.41 | 857 | 837 | 174.5 |
| B | 15 | 204 | 37392 | 221.26 | 863 | 842 | 165.2 |
| B | 0 | 214 | 35068 | 207.19 | 863 | 842 | 165.2 |
| B | 10 | 245 | 26049 | 152.59 | 863 | 842 | 165.2 |
| C | 1 | 16 | 59558 | 306.75 | 830 | 833 | 191.4 |
| C | 13 | 61 | 6828 | 31.32 | 830 | 833 | 191.4 |
| C | 14 | 67 | 3020 | 11.42 | 830 | 833 | 191.4 |
| D | 2 | 152 | 203581 | 1011.59 | 826 | 800 | 200.5 |
| D | 12 | 233 | 198353 | 985.51 | 826 | 800 | 200.5 |
| D | 2 | 234 | 14521 | 68.45 | 826 | 800 | 200.5 |
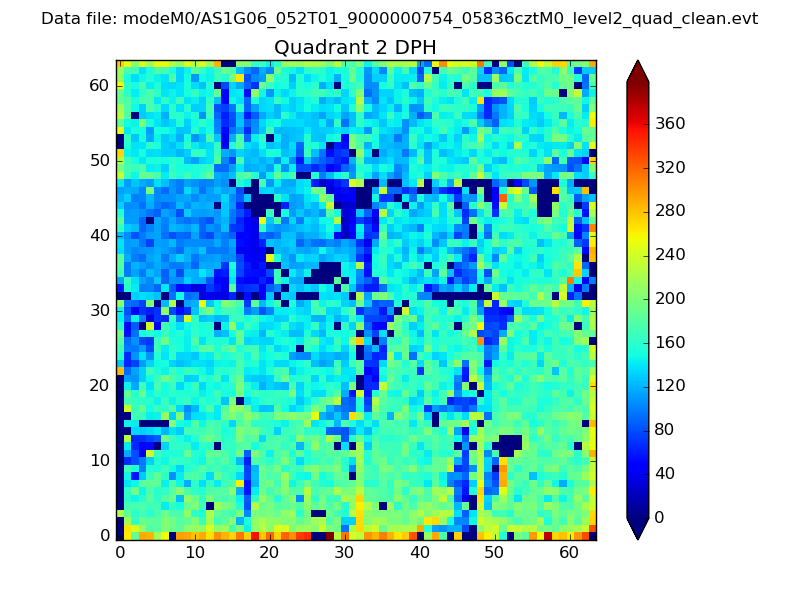
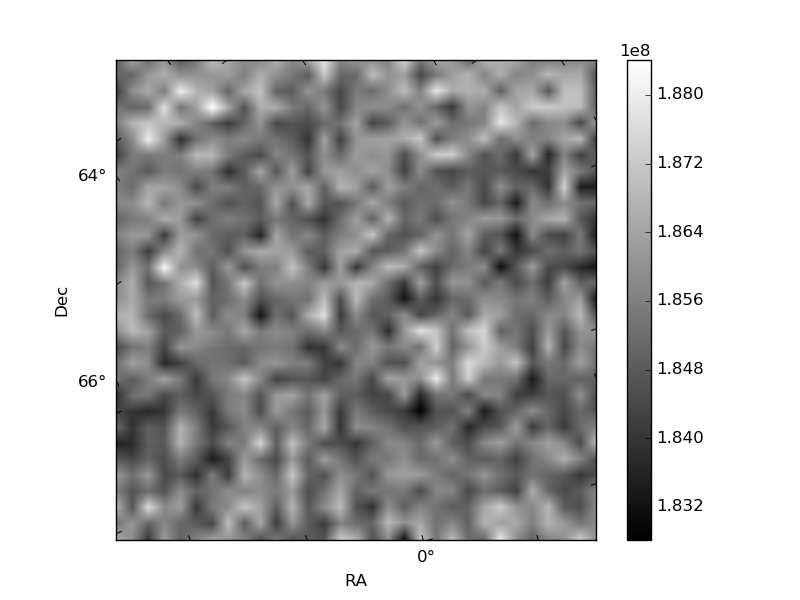
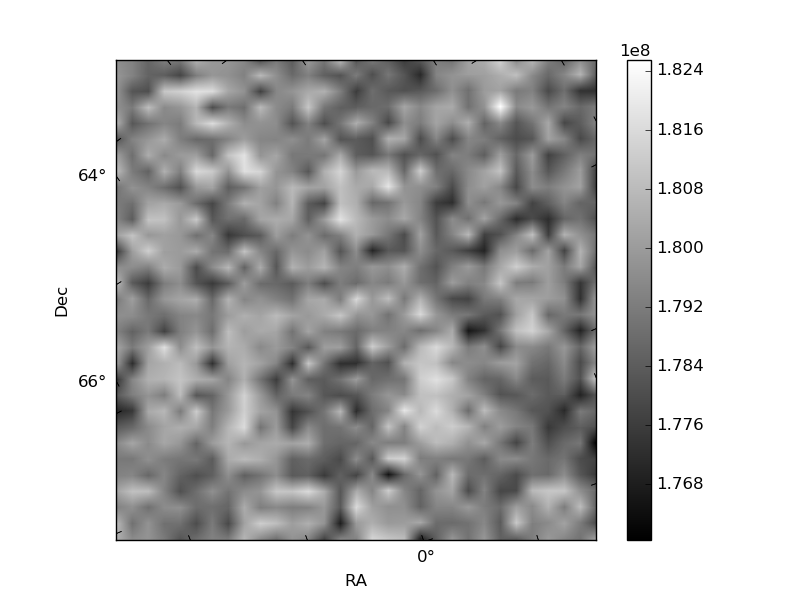
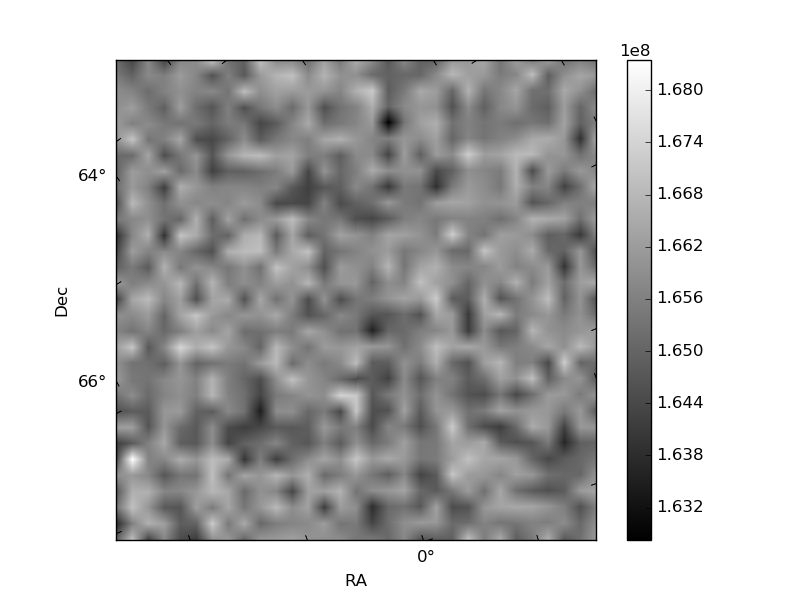
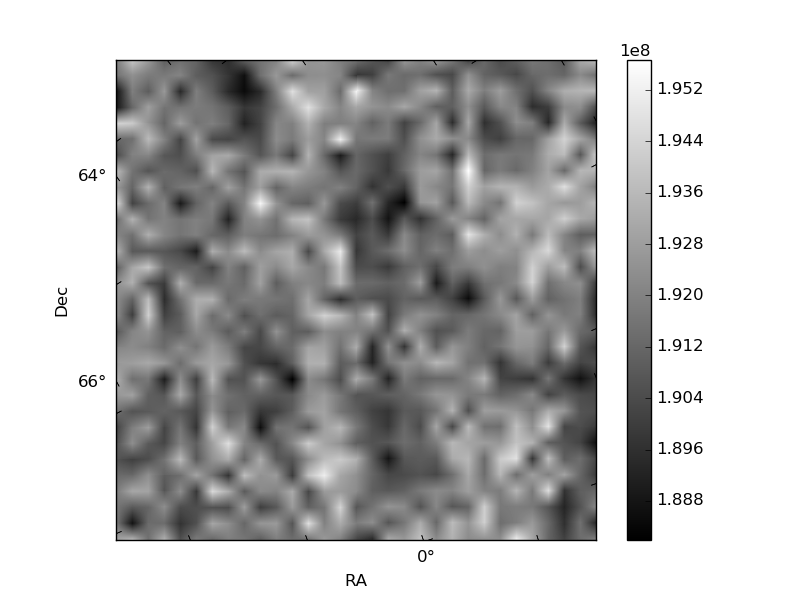
Histogram calculated using DETX and DETY for each event in the final _common_clean file
| Quadrant A | 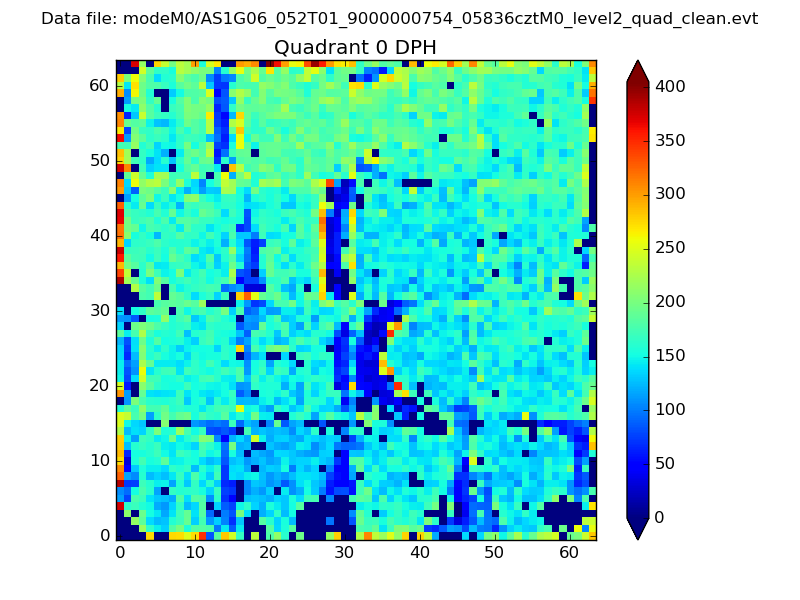 |
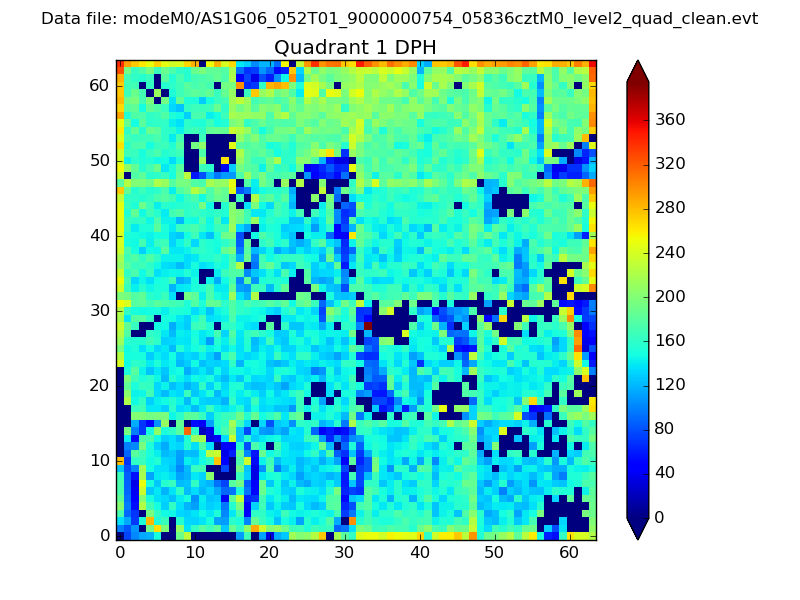 |
Quadrant B |
|---|---|---|---|
| Quadrant D | 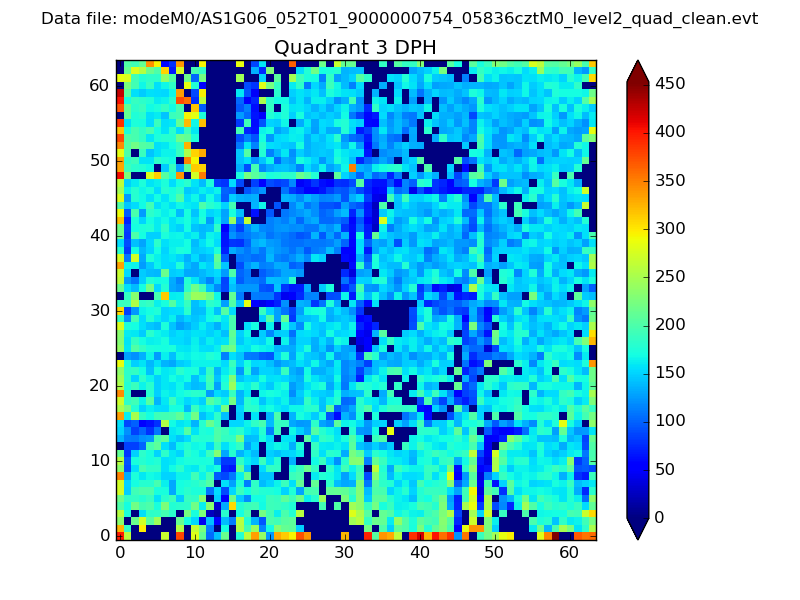 |
 |
Quadrant C |
| Plot type | Count rate plots | Images |
|---|---|---|
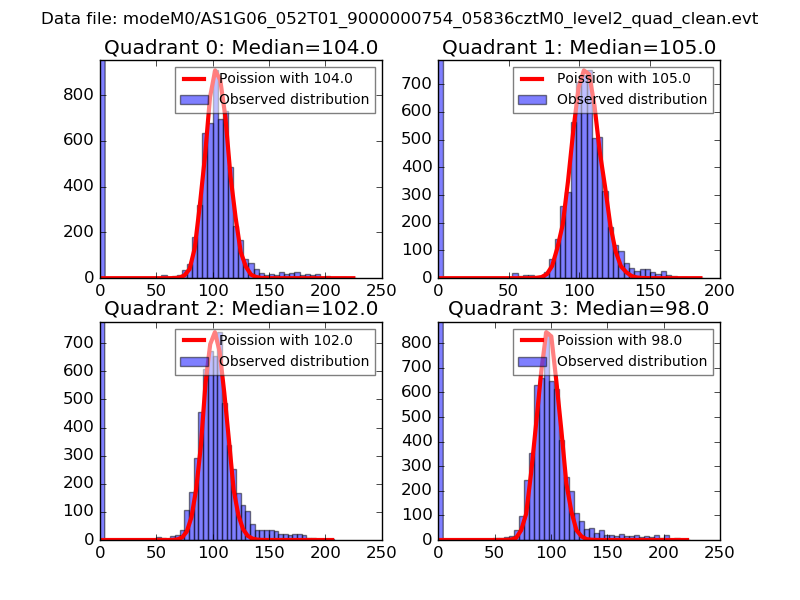
| Comparison with Poisson distribution Blue bars denote a histogram of data divided into 1 sec bins. Red curve is a Poisson curve with rate = median count rate of data. |
 |
 |
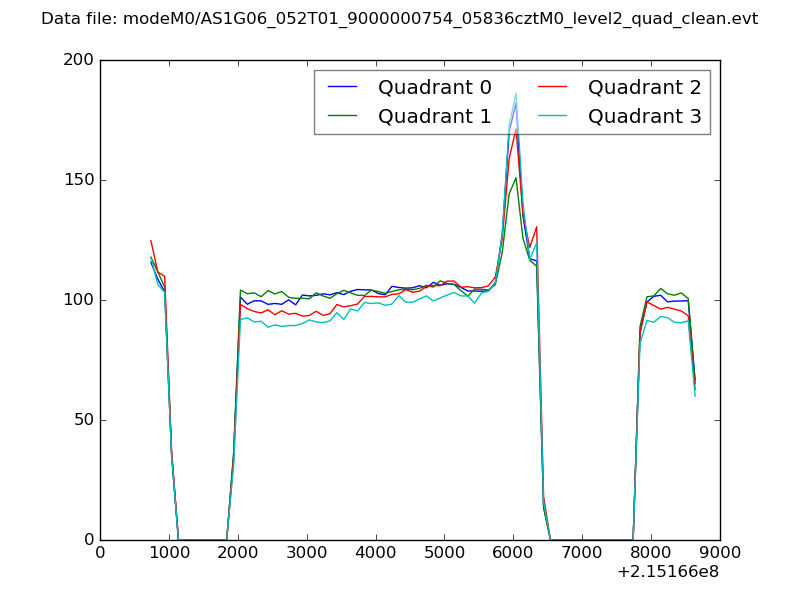
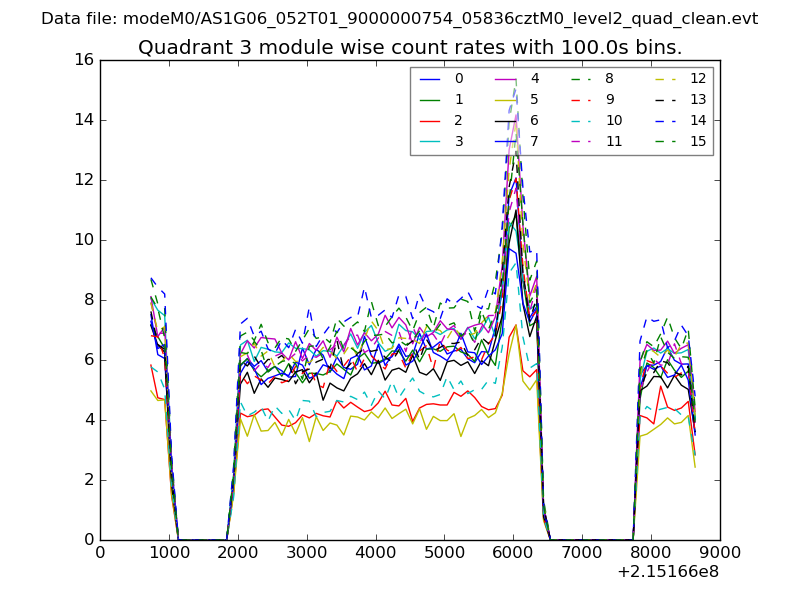
| Quadrant-wise count rates Data is divided into 100 sec bins |
 |
|
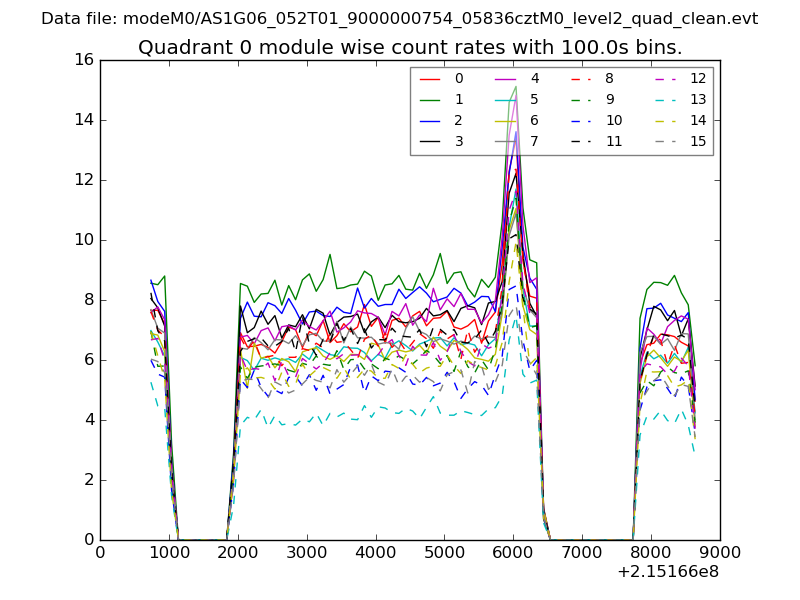
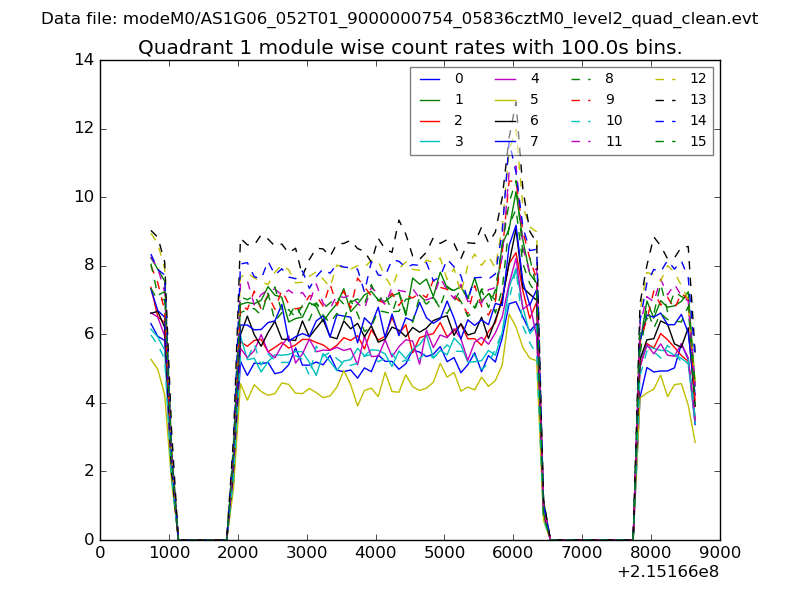
| Module-wise count rates for Quadrant A Data is divided into 100 sec bins |
 |
 |
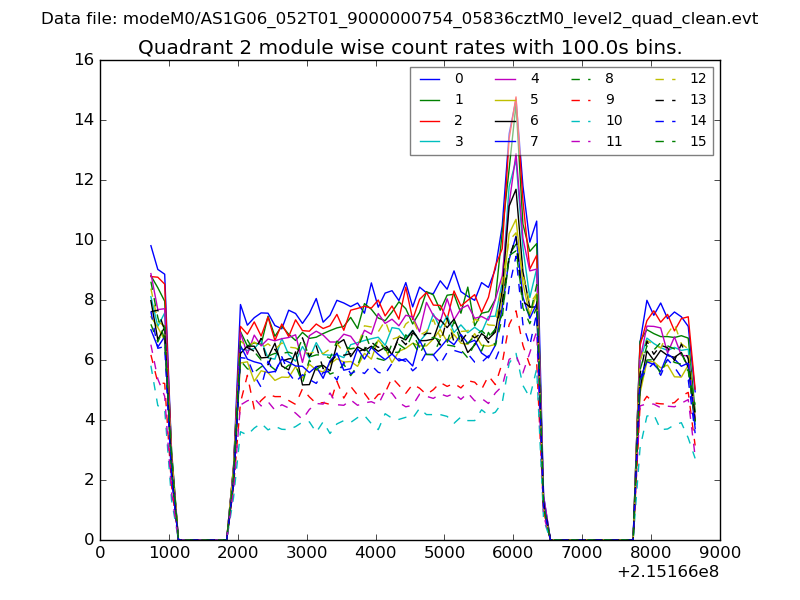
| Module-wise count rates for Quadrant B Data is divided into 100 sec bins |
 |
 |
| Module-wise count rates for Quadrant C Data is divided into 100 sec bins |
 |
 |
| Module-wise count rates for Quadrant D Data is divided into 100 sec bins |
 |
 |
| Parameter | Plot |
|---|---|
| CZT HV Monitor | 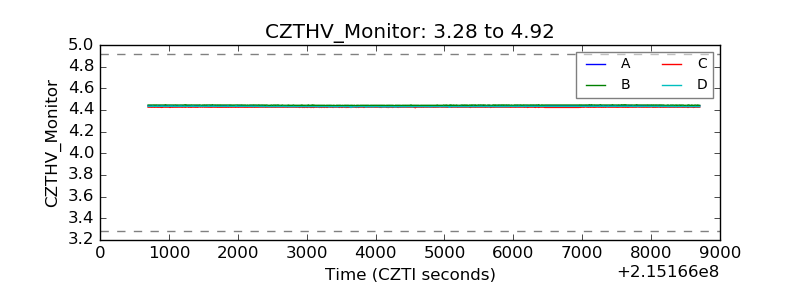 |
| D_VDD | 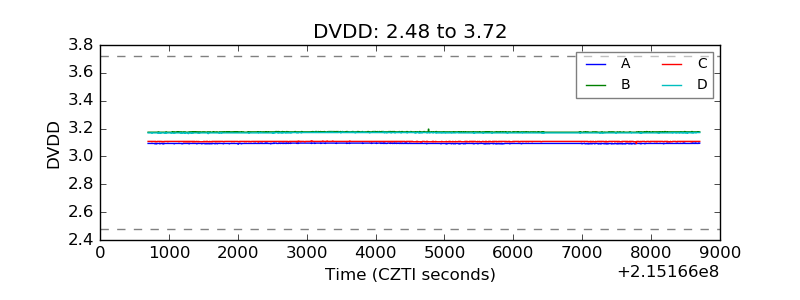 |
| Temperature 1 | 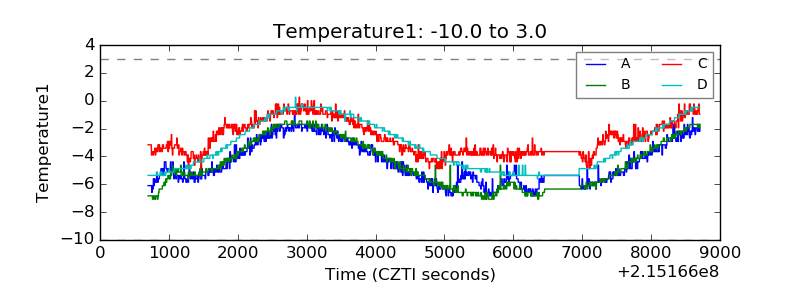 |
| Veto HV Monitor | 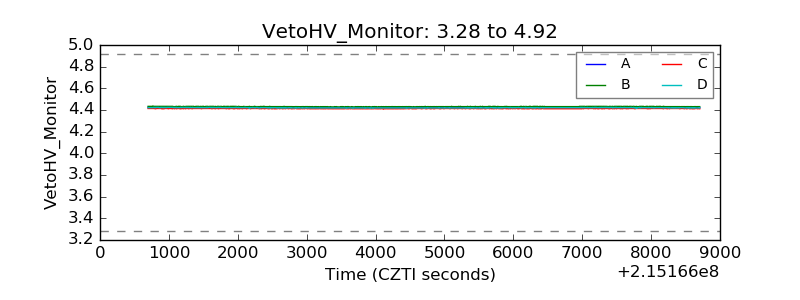 |
| Veto LLD | 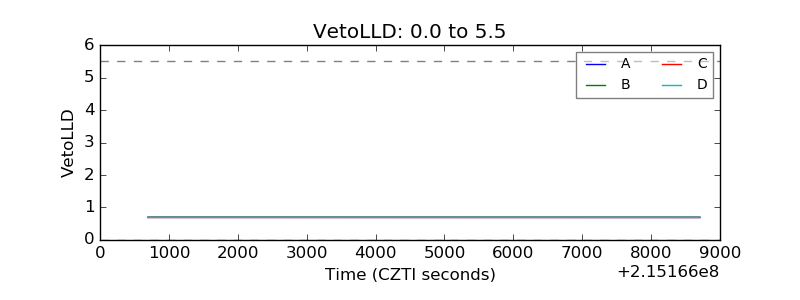 |
| Alpha Counter | 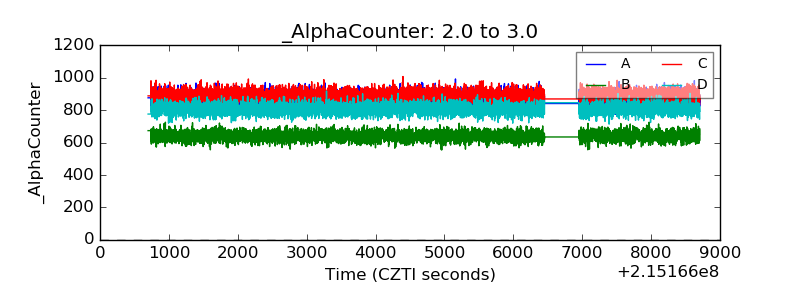 |
| _CPM_Rate | 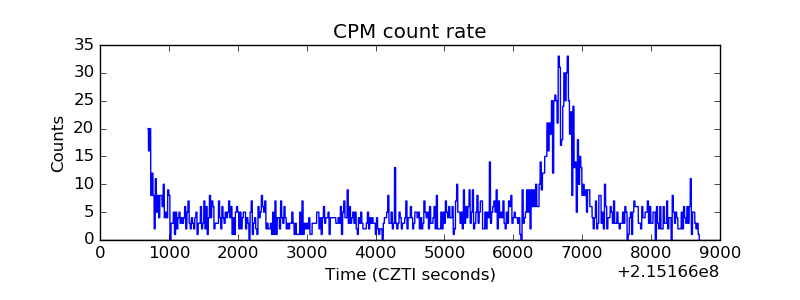 |
| CZT Counter | 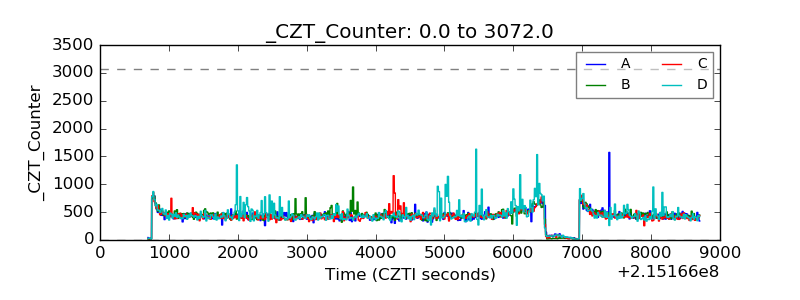 |
| +2.5 Volts monitor |  |
| +5 Volts monitor | 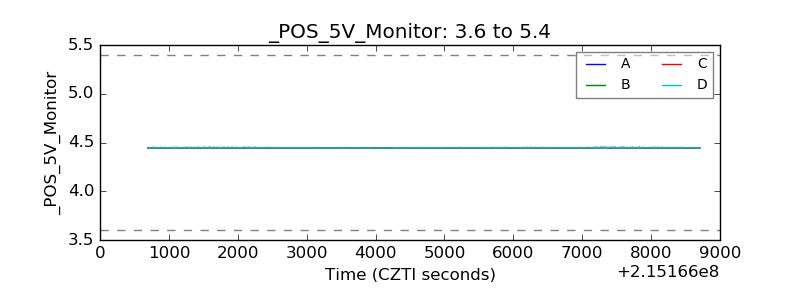 |
| _ROLL_ROT | 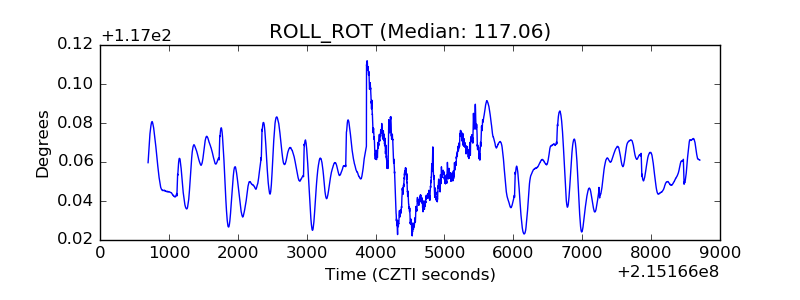 |
| _Roll_DEC | 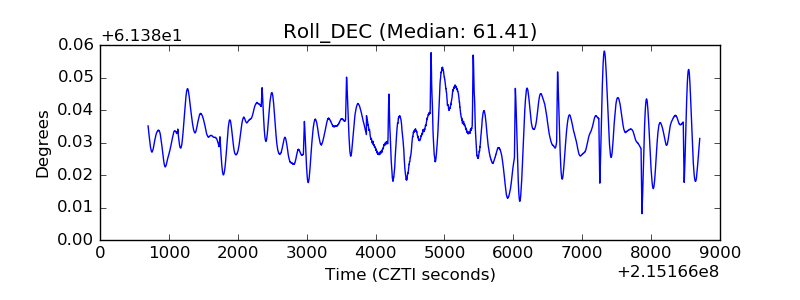 |
| _Roll_RA | 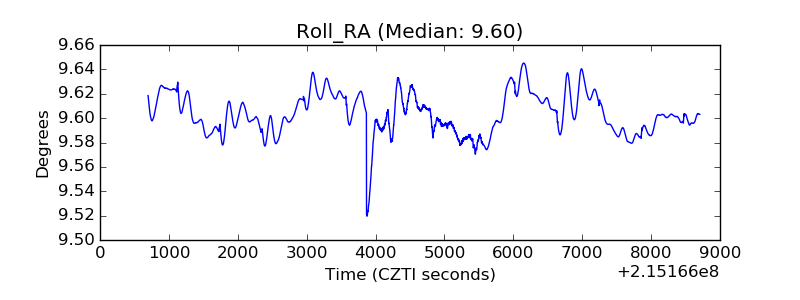 |
| Veto Counter | 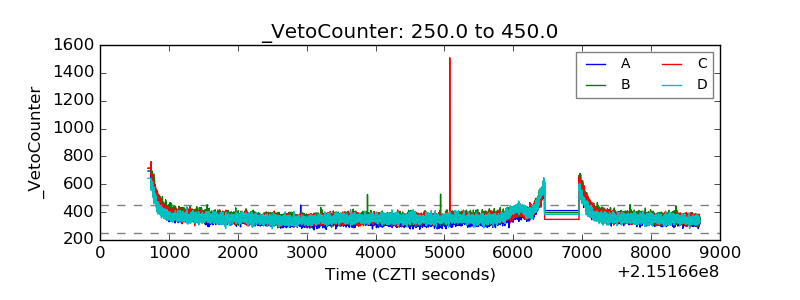 |