| Param | Original file | Final file |
|---|---|---|
| Filename | modeM0/AS1G06_052T01_9000000754_05837cztM0_level2.evt | modeM0/AS1G06_052T01_9000000754_05837cztM0_level2_quad_clean.evt |
| Size (bytes) | 433,713,600 | 96,687,360 |
| Size | 413.6 MB | 92.2 MB |
| Events in quadrant A | 3,130,715 | 620,419 |
| Events in quadrant B | 3,227,067 | 624,385 |
| Events in quadrant C | 3,101,509 | 609,680 |
| Events in quadrant D | 3,196,778 | 583,420 |
| Mode SS | |||
|---|---|---|---|
| Quadrant | BADHDUFLAG | Total packets | Discarded packets |
| A | 0 | 140 | 0 |
| B | 0 | 140 | 0 |
| C | 0 | 140 | 0 |
| D | 0 | 140 | 0 |
| Mode M0 | |||
|---|---|---|---|
| Quadrant | BADHDUFLAG | Total packets | Discarded packets |
| A | 0 | 14484 | 1 |
| B | 0 | 14540 | 0 |
| C | 0 | 14578 | 0 |
| D | 0 | 14796 | 0 |
| Quadrant | Total seconds | Saturated seconds | Saturation percentage |
|---|---|---|---|
| A | 7042 | 120 | 1.704061% |
| B | 7042 | 104 | 1.476853% |
| C | 7042 | 74 | 1.050838% |
| D | 7042 | 73 | 1.036637% |
Noise dominated data is calculated using 1-second bins in cleaned event files. If a bin has >2000 counts, and if more than 50% of those come from <1% of pixels, then it is considered to be noise-dominated and hence unusable.
| Quadrant | # 1 sec bins | Bins with >0 counts | Bins with >2000 counts | High rate bins dominated by noise | Noise dominated (total time) | Noise dominated (detector-on time) | Marked lightcurve |
|---|---|---|---|---|---|---|---|
| A | 7042 | 7042 | 0 | 0 | 0.00% | 0.00% | 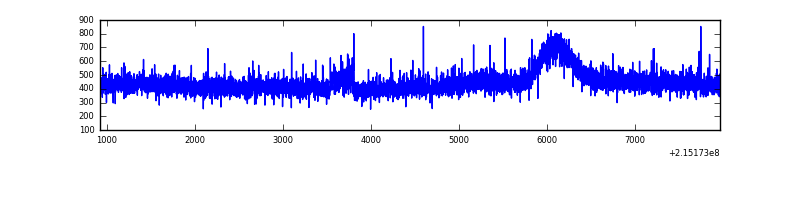 |
| B | 7042 | 7042 | 0 | 0 | 0.00% | 0.00% | 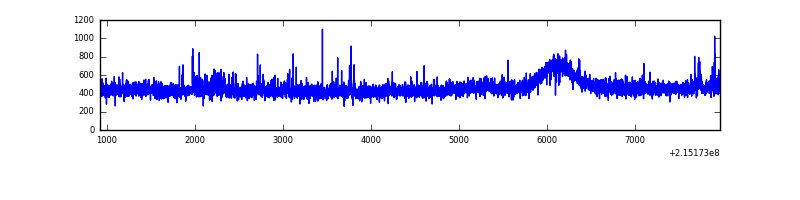 |
| C | 7042 | 7042 | 5 | 5 | 0.07% | 0.07% | 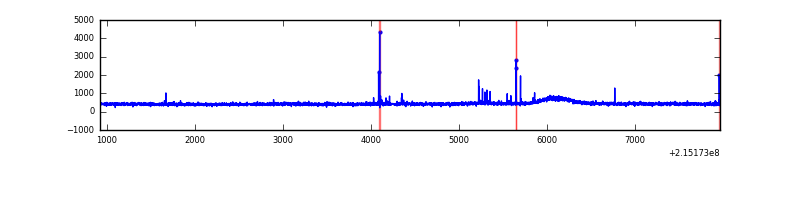 |
| D | 7042 | 7042 | 9 | 9 | 0.13% | 0.13% |  |
Top three noisy pixels from each quadrant. If the there are fewer than three noisy pixels in the level2.evt file, extra rows are filled as -1
| Pixel properties | Quadrant properties | ||||||
|---|---|---|---|---|---|---|---|
| Quadrant | DetID | PixID | Counts | Sigma | Mean | Median | Sigma |
| A | 15 | 234 | 28494 | 166.33 | 804 | 784 | 166.6 |
| A | 0 | 226 | 7851 | 42.42 | 804 | 784 | 166.6 |
| A | 12 | 194 | 7654 | 41.24 | 804 | 784 | 166.6 |
| B | 0 | 214 | 38635 | 244.81 | 810 | 790 | 154.6 |
| B | 15 | 204 | 33736 | 213.12 | 810 | 790 | 154.6 |
| B | 12 | 111 | 14609 | 89.39 | 810 | 790 | 154.6 |
| C | 1 | 16 | 58495 | 320.3 | 779 | 782 | 180.2 |
| C | 13 | 61 | 6321 | 30.74 | 779 | 782 | 180.2 |
| C | 8 | 222 | 2304 | 8.45 | 779 | 782 | 180.2 |
| D | 2 | 152 | 152683 | 797.96 | 777 | 751 | 190.4 |
| D | 12 | 233 | 24861 | 126.63 | 777 | 751 | 190.4 |
| D | 5 | 190 | 19550 | 98.73 | 777 | 751 | 190.4 |
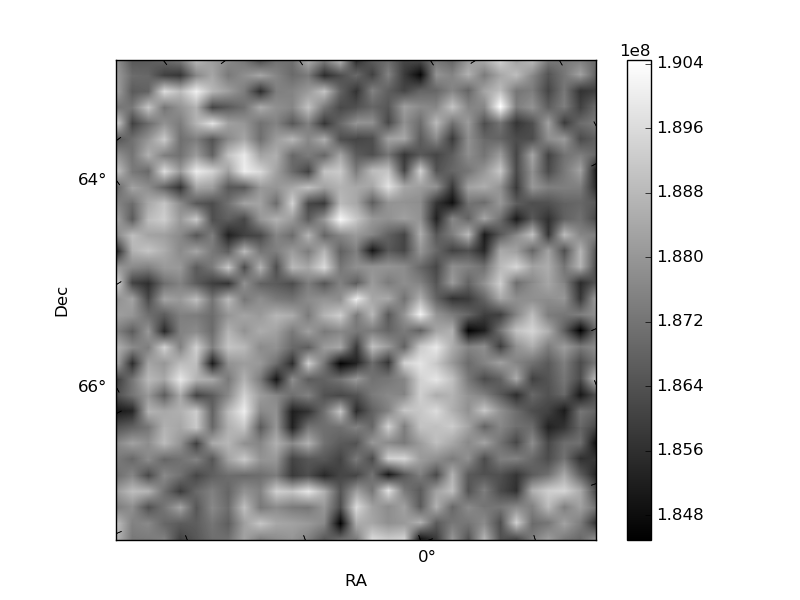
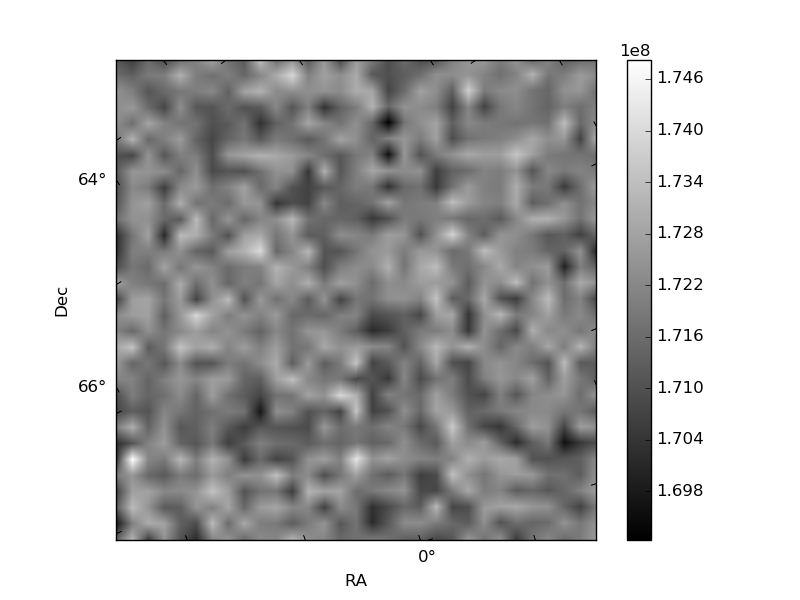
Histogram calculated using DETX and DETY for each event in the final _common_clean file
| Quadrant A |  |
 |
Quadrant B |
|---|---|---|---|
| Quadrant D | 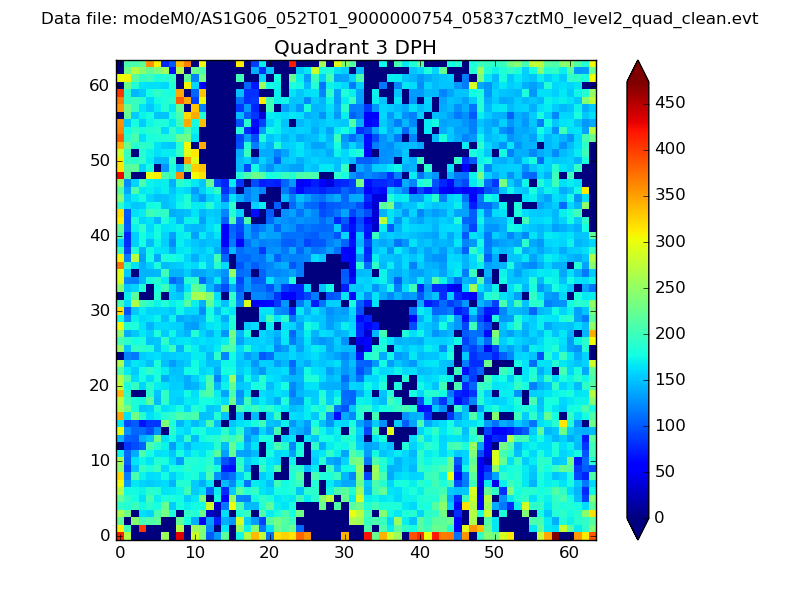 |
 |
Quadrant C |
| Plot type | Count rate plots | Images |
|---|---|---|
| Comparison with Poisson distribution Blue bars denote a histogram of data divided into 1 sec bins. Red curve is a Poisson curve with rate = median count rate of data. |
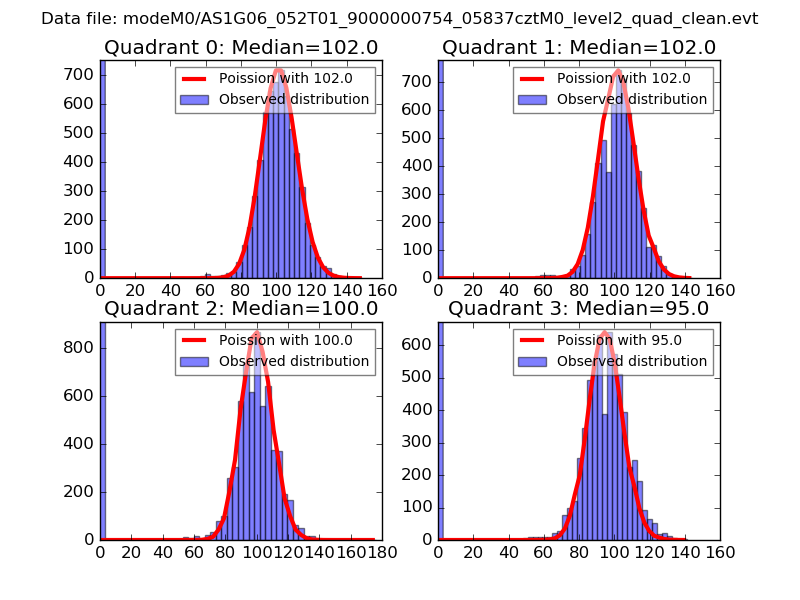 |
 |
| Quadrant-wise count rates Data is divided into 100 sec bins |
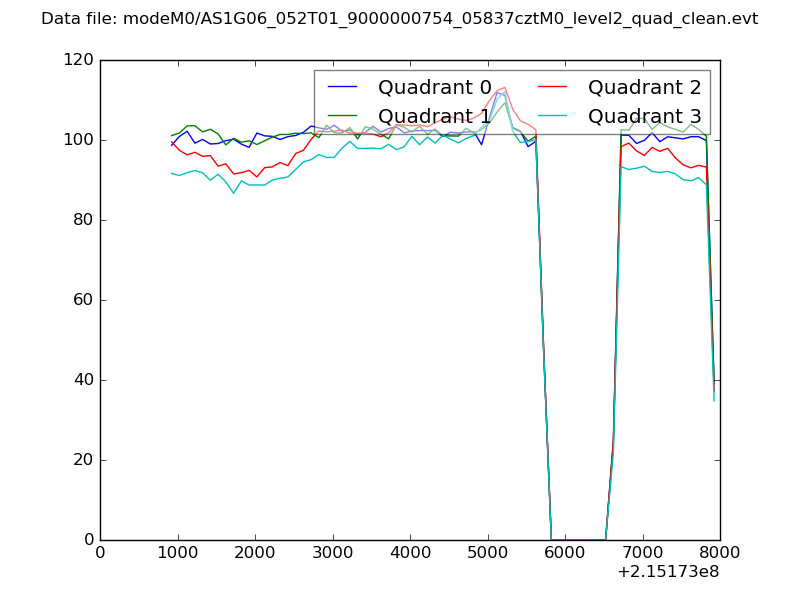 |
|
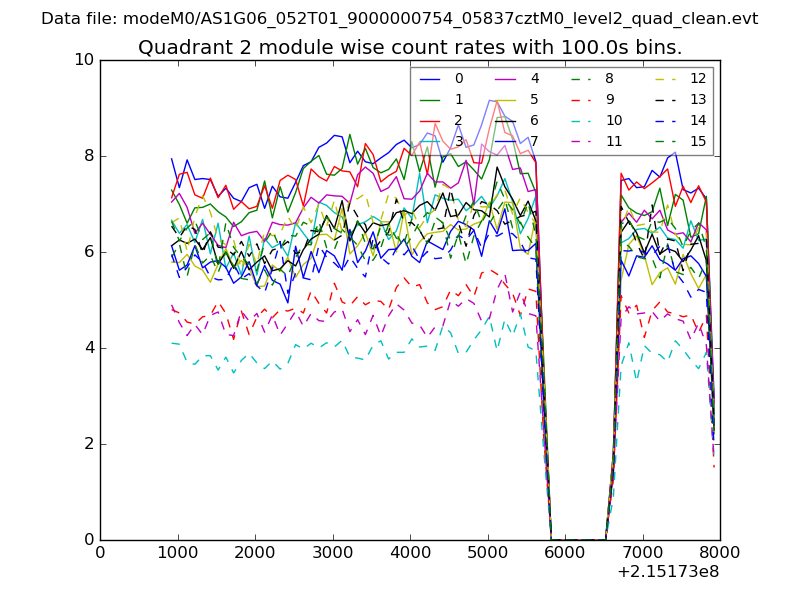
| Module-wise count rates for Quadrant A Data is divided into 100 sec bins |
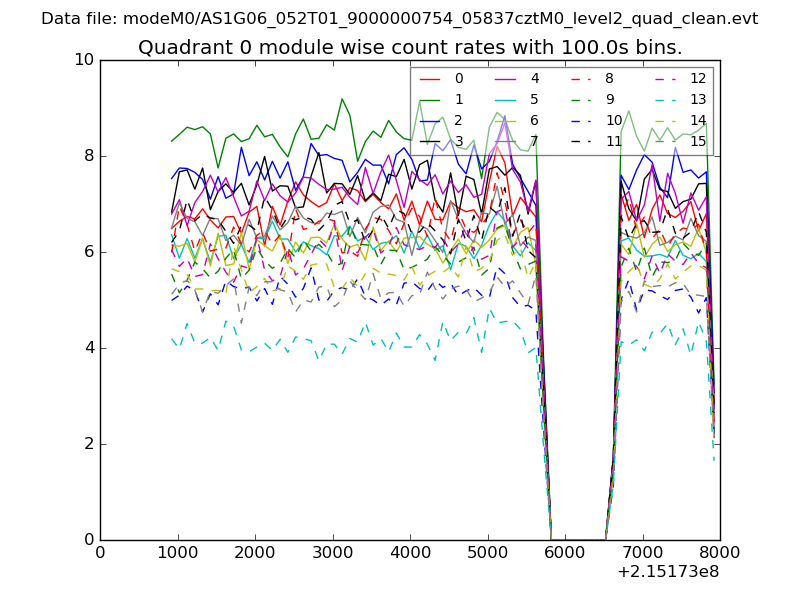 |
 |
| Module-wise count rates for Quadrant B Data is divided into 100 sec bins |
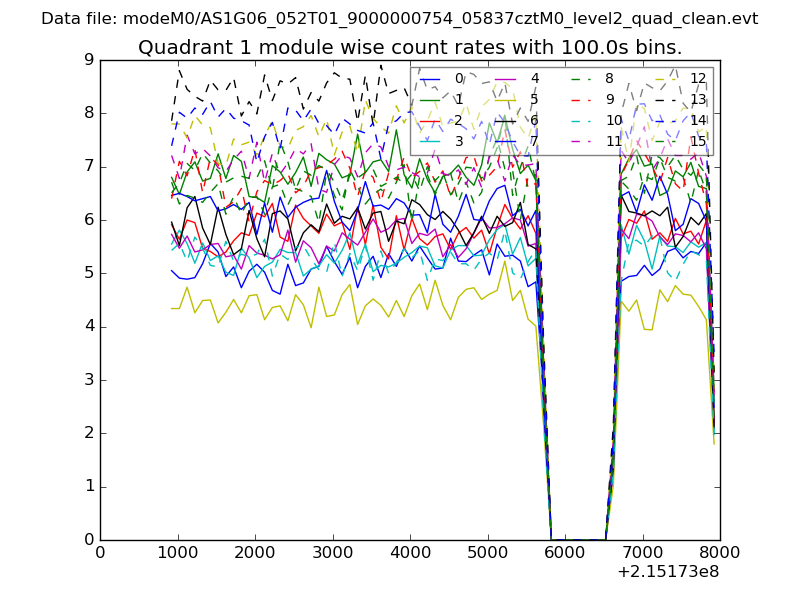 |
 |
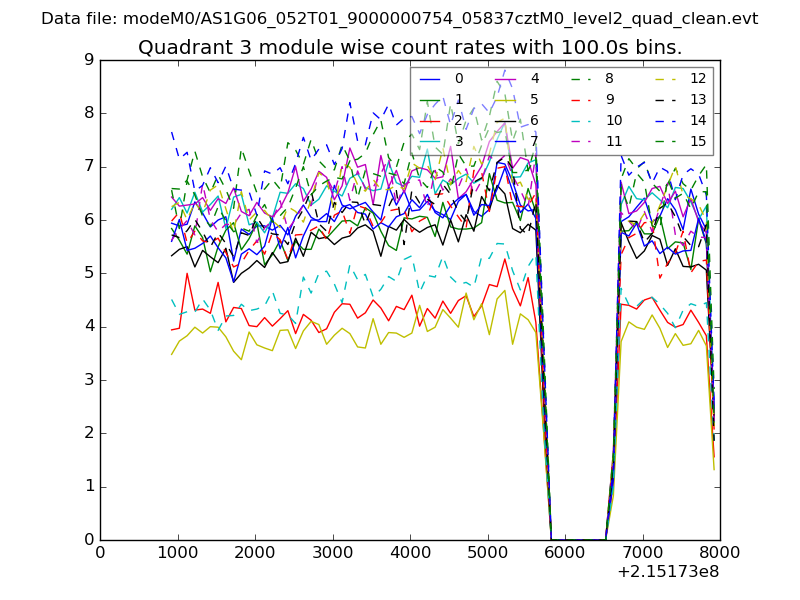
| Module-wise count rates for Quadrant C Data is divided into 100 sec bins |
 |
 |
| Module-wise count rates for Quadrant D Data is divided into 100 sec bins |
 |
 |
| Parameter | Plot |
|---|---|
| CZT HV Monitor | 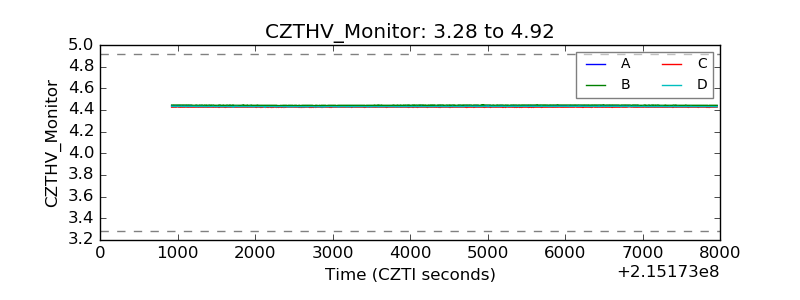 |
| D_VDD | 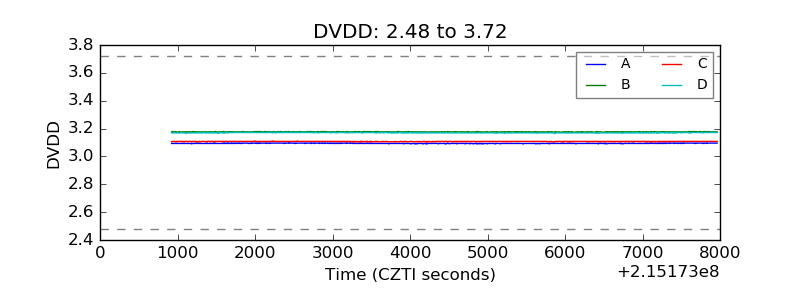 |
| Temperature 1 | 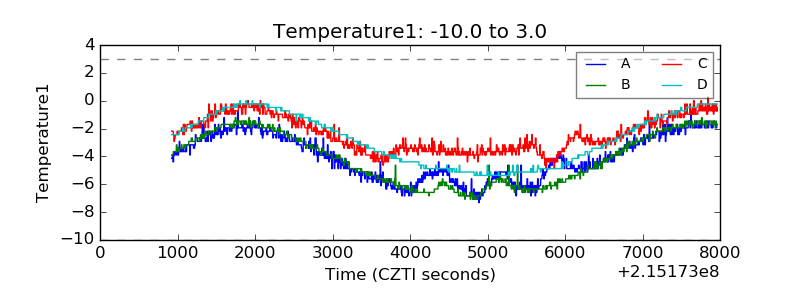 |
| Veto HV Monitor | 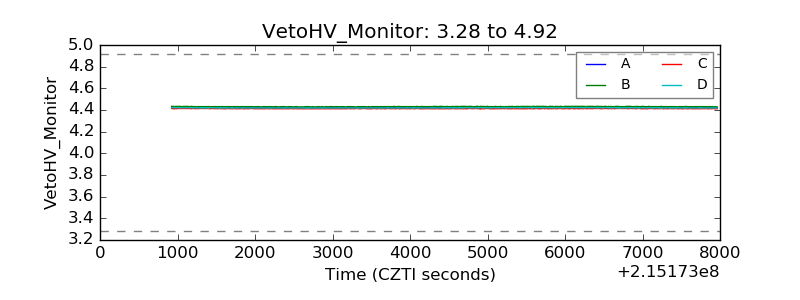 |
| Veto LLD | 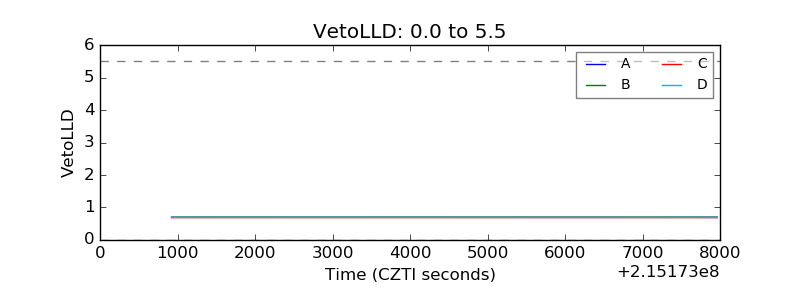 |
| Alpha Counter | 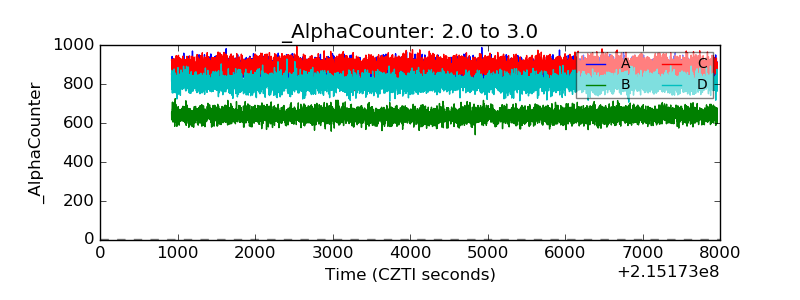 |
| _CPM_Rate | 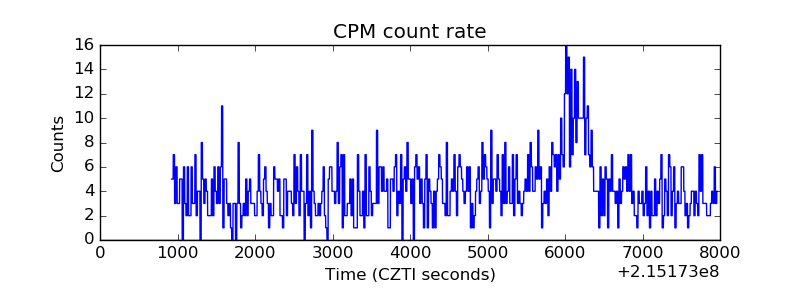 |
| CZT Counter |  |
| +2.5 Volts monitor |  |
| +5 Volts monitor |  |
| _ROLL_ROT | 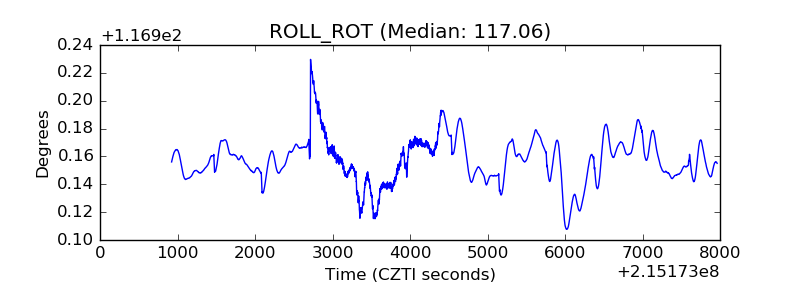 |
| _Roll_DEC | 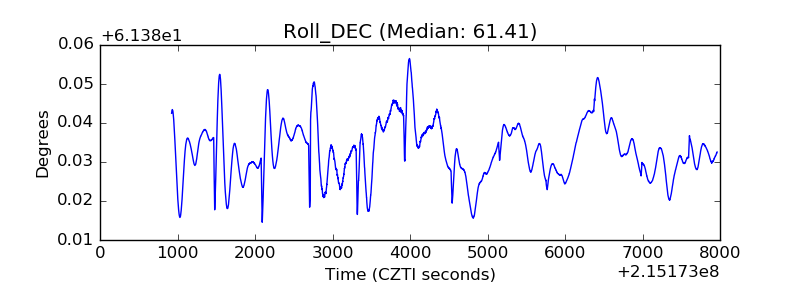 |
| _Roll_RA | 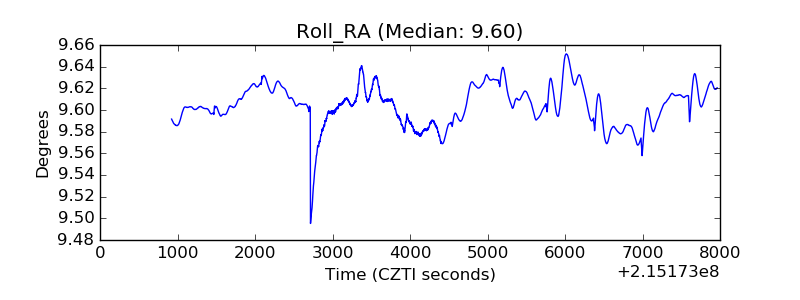 |
| Veto Counter | 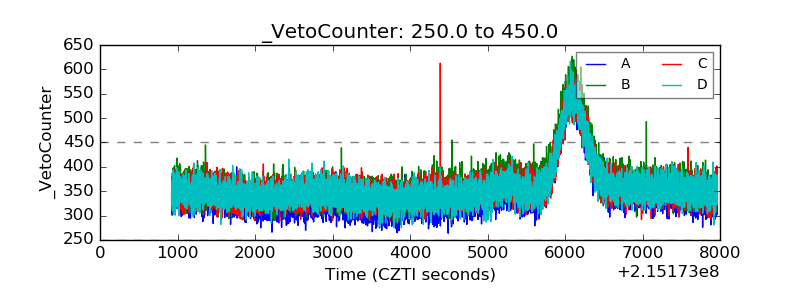 |