| Param | Original file | Final file |
|---|---|---|
| Filename | modeM0/AS1G06_168T07_9000000750cztM0_level2.fits | modeM0/AS1G06_168T07_9000000750cztM0_level2_quad_clean.evt |
| Size (bytes) | 260,075,520 | 228,159,360 |
| Size | 248.0 MB | 217.6 MB |
| Events in quadrant A | 1,556,686 | 1,287,629 |
| Events in quadrant B | 1,538,508 | 1,314,028 |
| Events in quadrant C | 1,581,988 | 1,282,701 |
| Events in quadrant D | 1,336,962 | 1,162,079 |
| Mode M9 | |||
|---|---|---|---|
| Quadrant | BADHDUFLAG | Total packets | Discarded packets |
| A | 0 | 63 | 0 |
| B | 0 | 63 | 0 |
| C | 0 | 63 | 0 |
| D | 0 | 63 | 0 |
| Mode SS | |||
|---|---|---|---|
| Quadrant | BADHDUFLAG | Total packets | Discarded packets |
| A | 0 | 550 | 0 |
| B | 0 | 552 | 0 |
| C | 0 | 552 | 0 |
| D | 0 | 552 | 0 |
| Mode M0 | |||
|---|---|---|---|
| Quadrant | BADHDUFLAG | Total packets | Discarded packets |
| A | 0 | 64313 | 0 |
| B | 0 | 55438 | 0 |
| C | 0 | 55214 | 0 |
| D | 0 | 65773 | 0 |
| Quadrant | Total seconds | Saturated seconds | Saturation percentage |
|---|---|---|---|
| A | 27081 | 187 | 0.690521% |
| B | 27085 | 134 | 0.494739% |
| C | 27089 | 126 | 0.465133% |
| D | 27088 | 711 | 2.624778% |
Noise dominated data is calculated using 1-second bins in cleaned event files. If a bin has >2000 counts, and if more than 50% of those come from <1% of pixels, then it is considered to be noise-dominated and hence unusable.
| Quadrant | # 1 sec bins | Bins with >0 counts | Bins with >2000 counts | High rate bins dominated by noise | Noise dominated (total time) | Noise dominated (detector-on time) | Marked lightcurve |
|---|---|---|---|---|---|---|---|
| A | 33339 | 27135 | 0 | 0 | 0.00% | 0.00% |  |
| B | 33339 | 27143 | 0 | 0 | 0.00% | 0.00% | 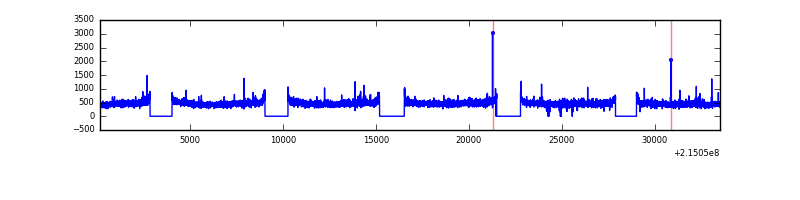 |
| C | 33339 | 27131 | 0 | 0 | 0.00% | 0.00% |  |
| D | 33339 | 27134 | 0 | 0 | 0.00% | 0.00% |  |
Top three noisy pixels from each quadrant. If the there are fewer than three noisy pixels in the level2.evt file, extra rows are filled as -1
| Pixel properties | Quadrant properties | ||||||
|---|---|---|---|---|---|---|---|
| Quadrant | DetID | PixID | Counts | Sigma | Mean | Median | Sigma |
| A | 0 | 29 | 1558 | 11.47 | 405 | 380 | 102.7 |
| A | 7 | 110 | 1313 | 9.09 | 405 | 380 | 102.7 |
| A | 0 | 30 | 1205 | 8.04 | 405 | 380 | 102.7 |
| B | 2 | 9 | 1324 | 11.56 | 406 | 388 | 80.9 |
| B | 5 | 128 | 1096 | 8.75 | 406 | 388 | 80.9 |
| B | 12 | 226 | 1090 | 8.67 | 406 | 388 | 80.9 |
| C | 1 | 80 | 1155 | 6.89 | 417 | 391 | 110.8 |
| C | 1 | 81 | 1137 | 6.73 | 417 | 391 | 110.8 |
| C | 12 | 241 | 1102 | 6.42 | 417 | 391 | 110.8 |
| D | 11 | 82 | 993 | 6.37 | 381 | 349 | 101.1 |
| D | 10 | 189 | 971 | 6.16 | 381 | 349 | 101.1 |
| D | 3 | 14 | 965 | 6.1 | 381 | 349 | 101.1 |
Histogram calculated using DETX and DETY for each event in the final _common_clean file
| Quadrant A |  |
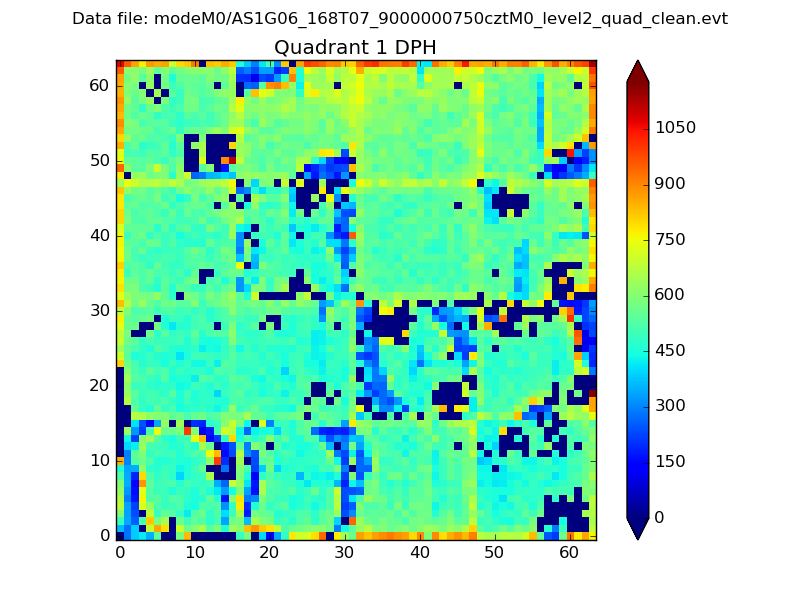 |
Quadrant B |
|---|---|---|---|
| Quadrant D |  |
 |
Quadrant C |
| Plot type | Count rate plots | Images |
|---|---|---|
| Comparison with Poisson distribution Blue bars denote a histogram of data divided into 1 sec bins. Red curve is a Poisson curve with rate = median count rate of data. |
 |
 |
| Quadrant-wise count rates Data is divided into 100 sec bins |
 |
|
| Module-wise count rates for Quadrant A Data is divided into 100 sec bins |
 |
 |
| Module-wise count rates for Quadrant B Data is divided into 100 sec bins |
 |
 |
| Module-wise count rates for Quadrant C Data is divided into 100 sec bins |
 |
 |
| Module-wise count rates for Quadrant D Data is divided into 100 sec bins |
 |
 |
| Parameter | Plot |
|---|---|
| CZT HV Monitor |  |
| D_VDD |  |
| Temperature 1 |  |
| Veto HV Monitor |  |
| Veto LLD |  |
| Alpha Counter |  |
| _CPM_Rate |  |
| CZT Counter |  |
| +2.5 Volts monitor |  |
| +5 Volts monitor |  |
| _ROLL_ROT | 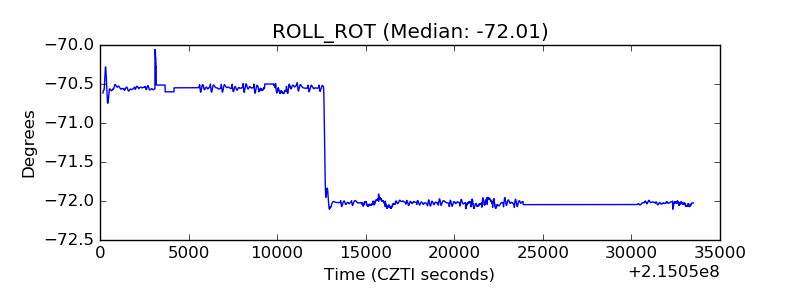 |
| _Roll_DEC |  |
| _Roll_RA |  |
| Veto Counter |  |