| Param | Original file | Final file |
|---|---|---|
| Filename | modeM0/AS1G06_168T07_9000000750_05817cztM0_level2.evt | modeM0/AS1G06_168T07_9000000750_05817cztM0_level2_quad_clean.evt |
| Size (bytes) | 483,906,240 | 87,865,920 |
| Size | 461.5 MB | 83.8 MB |
| Events in quadrant A | 3,796,457 | 554,984 |
| Events in quadrant B | 2,973,751 | 576,585 |
| Events in quadrant C | 2,936,080 | 566,177 |
| Events in quadrant D | 4,522,728 | 524,764 |
| Mode M9 | |||
|---|---|---|---|
| Quadrant | BADHDUFLAG | Total packets | Discarded packets |
| A | 0 | 12 | 0 |
| B | 0 | 12 | 0 |
| C | 0 | 12 | 0 |
| D | 0 | 12 | 0 |
| Mode SS | |||
|---|---|---|---|
| Quadrant | BADHDUFLAG | Total packets | Discarded packets |
| A | 0 | 128 | 0 |
| B | 0 | 128 | 0 |
| C | 0 | 128 | 0 |
| D | 0 | 128 | 0 |
| Mode M0 | |||
|---|---|---|---|
| Quadrant | BADHDUFLAG | Total packets | Discarded packets |
| A | 0 | 15815 | 2 |
| B | 0 | 12852 | 1 |
| C | 0 | 12797 | 1 |
| D | 0 | 17626 | 1 |
| Quadrant | Total seconds | Saturated seconds | Saturation percentage |
|---|---|---|---|
| A | 6278 | 37 | 0.589360% |
| B | 6278 | 30 | 0.477859% |
| C | 6278 | 34 | 0.541574% |
| D | 6278 | 150 | 2.389296% |
Noise dominated data is calculated using 1-second bins in cleaned event files. If a bin has >2000 counts, and if more than 50% of those come from <1% of pixels, then it is considered to be noise-dominated and hence unusable.
| Quadrant | # 1 sec bins | Bins with >0 counts | Bins with >2000 counts | High rate bins dominated by noise | Noise dominated (total time) | Noise dominated (detector-on time) | Marked lightcurve |
|---|---|---|---|---|---|---|---|
| A | 7518 | 6279 | 5 | 5 | 0.07% | 0.08% | 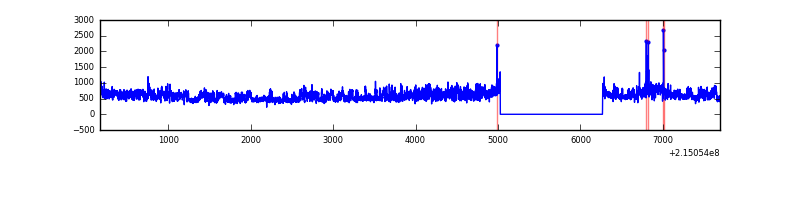 |
| B | 7518 | 6279 | 0 | 0 | 0.00% | 0.00% | 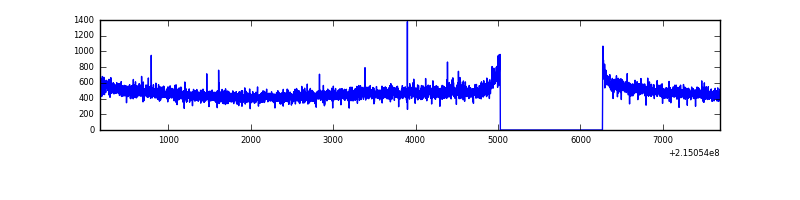 |
| C | 7518 | 6279 | 0 | 0 | 0.00% | 0.00% | 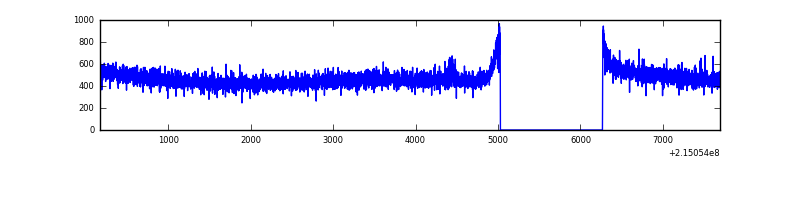 |
| D | 7518 | 6279 | 151 | 151 | 2.01% | 2.40% | 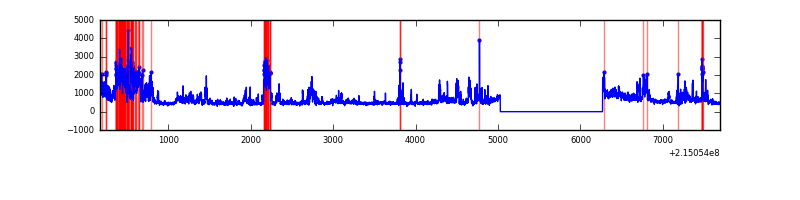 |
Top three noisy pixels from each quadrant. If the there are fewer than three noisy pixels in the level2.evt file, extra rows are filled as -1
| Pixel properties | Quadrant properties | ||||||
|---|---|---|---|---|---|---|---|
| Quadrant | DetID | PixID | Counts | Sigma | Mean | Median | Sigma |
| A | 15 | 236 | 690066 | 4544.85 | 748 | 732 | 151.7 |
| A | 15 | 79 | 207047 | 1360.26 | 748 | 732 | 151.7 |
| A | 15 | 223 | 16083 | 101.21 | 748 | 732 | 151.7 |
| B | 12 | 111 | 13349 | 88.26 | 765 | 747 | 142.8 |
| B | 11 | 111 | 10410 | 67.68 | 765 | 747 | 142.8 |
| B | 15 | 204 | 7952 | 50.46 | 765 | 747 | 142.8 |
| C | 14 | 67 | 6959 | 35.96 | 749 | 751 | 172.6 |
| C | 13 | 61 | 6058 | 30.74 | 749 | 751 | 172.6 |
| C | 1 | 16 | 2833 | 12.06 | 749 | 751 | 172.6 |
| D | 8 | 230 | 1624866 | 9187.02 | 732 | 710 | 176.8 |
| D | 11 | 241 | 61651 | 344.71 | 732 | 710 | 176.8 |
| D | 12 | 233 | 34673 | 192.11 | 732 | 710 | 176.8 |
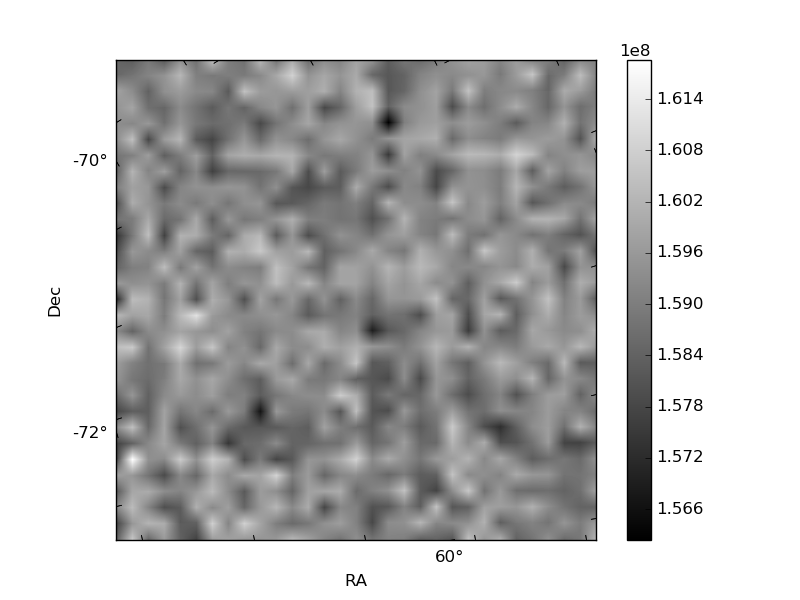
Histogram calculated using DETX and DETY for each event in the final _common_clean file
| Quadrant A | 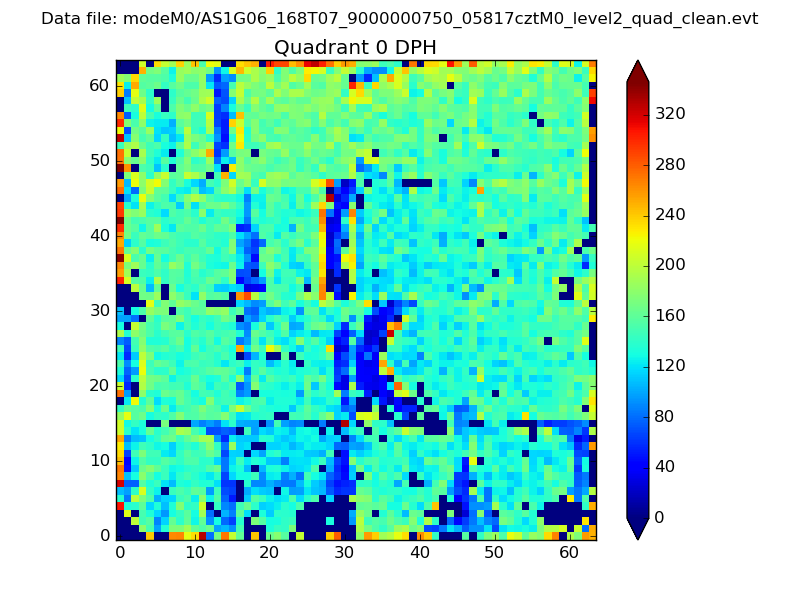 |
 |
Quadrant B |
|---|---|---|---|
| Quadrant D | 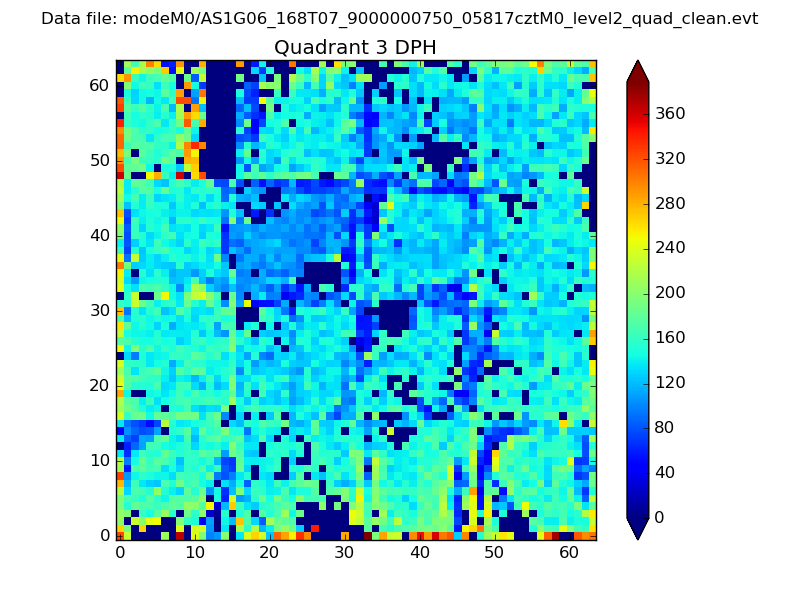 |
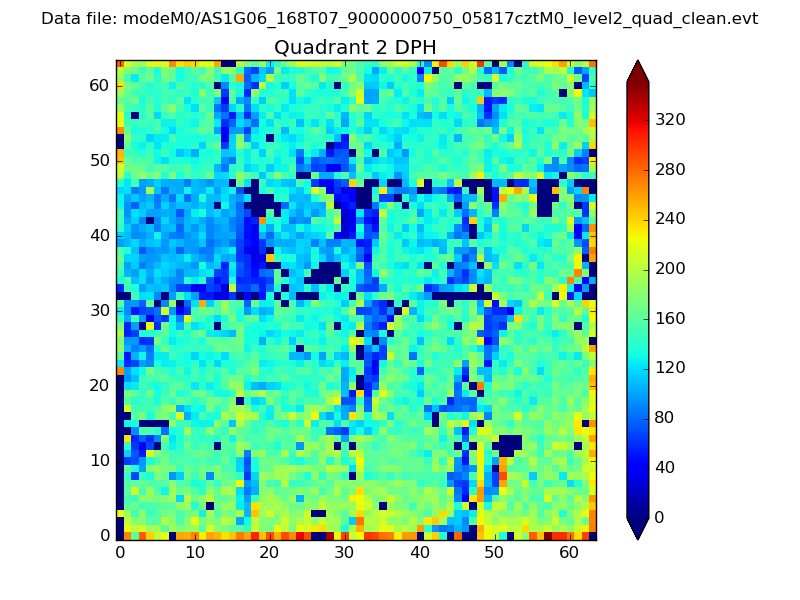 |
Quadrant C |
| Plot type | Count rate plots | Images |
|---|---|---|
| Comparison with Poisson distribution Blue bars denote a histogram of data divided into 1 sec bins. Red curve is a Poisson curve with rate = median count rate of data. |
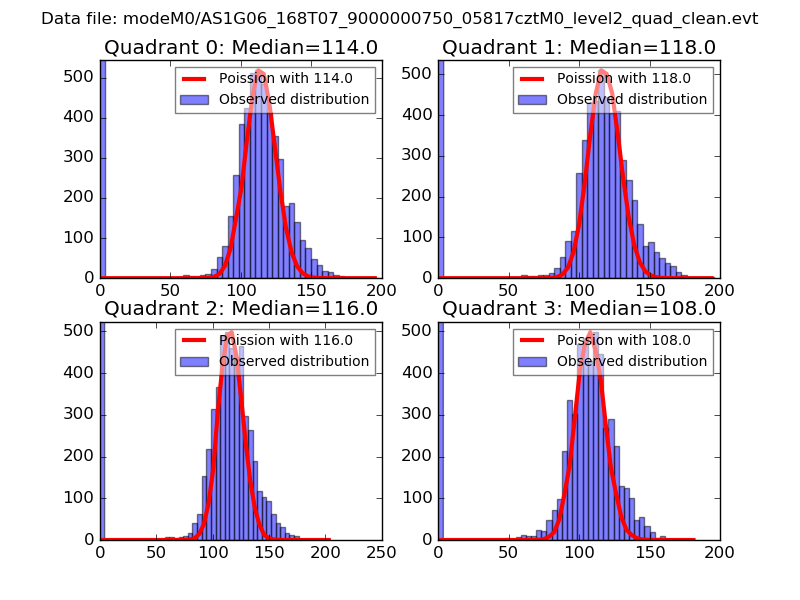 |
 |
| Quadrant-wise count rates Data is divided into 100 sec bins |
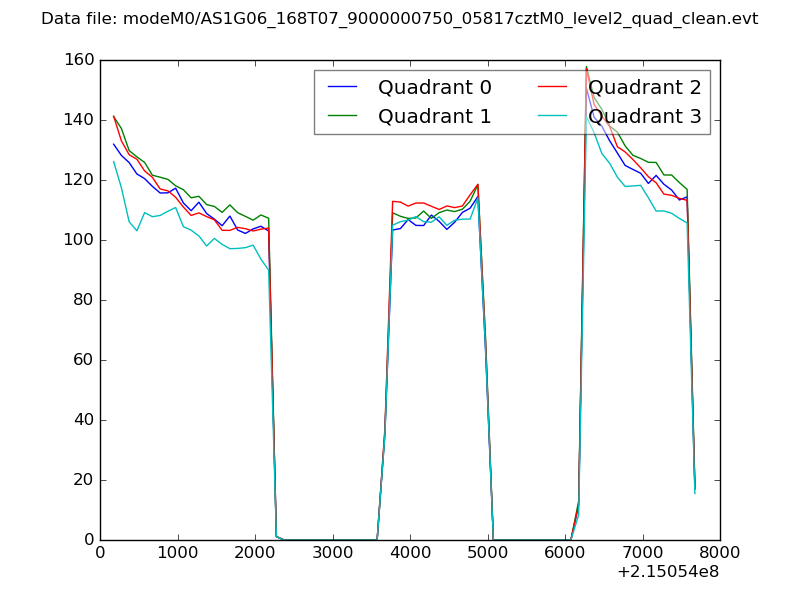 |
|
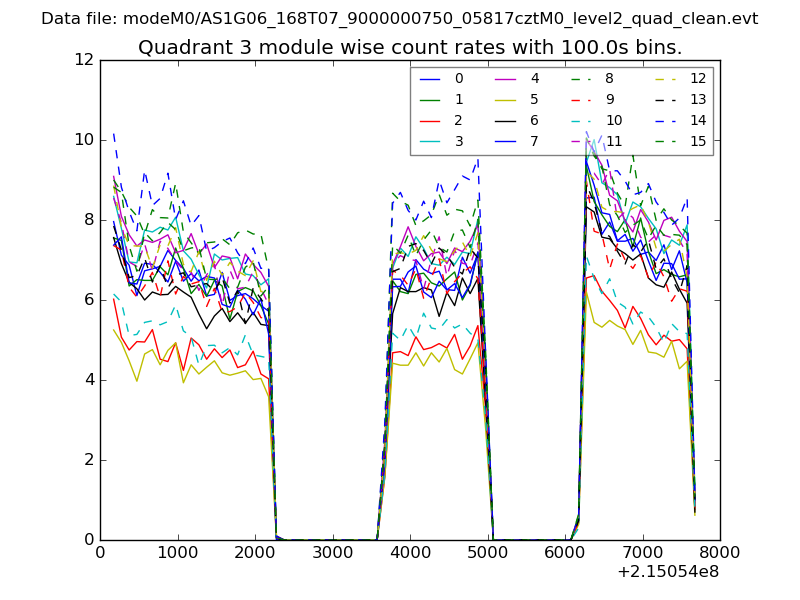
| Module-wise count rates for Quadrant A Data is divided into 100 sec bins |
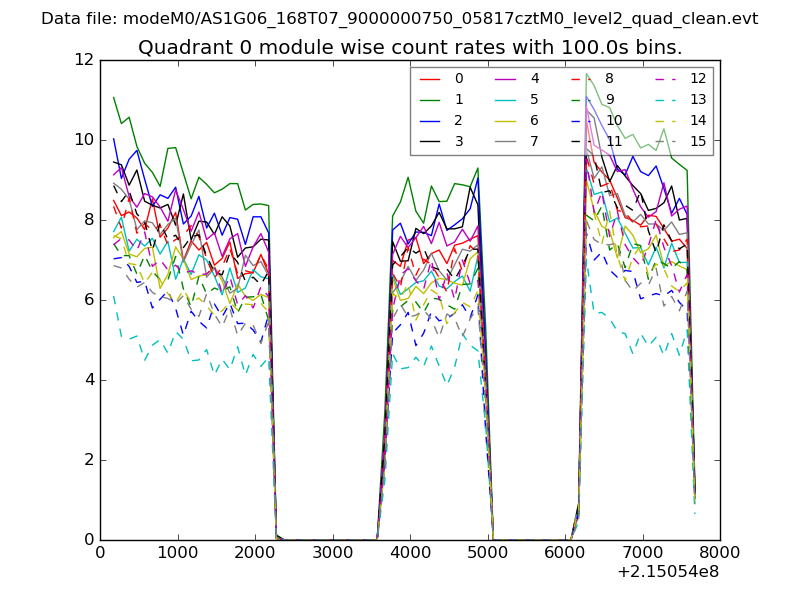 |
 |
| Module-wise count rates for Quadrant B Data is divided into 100 sec bins |
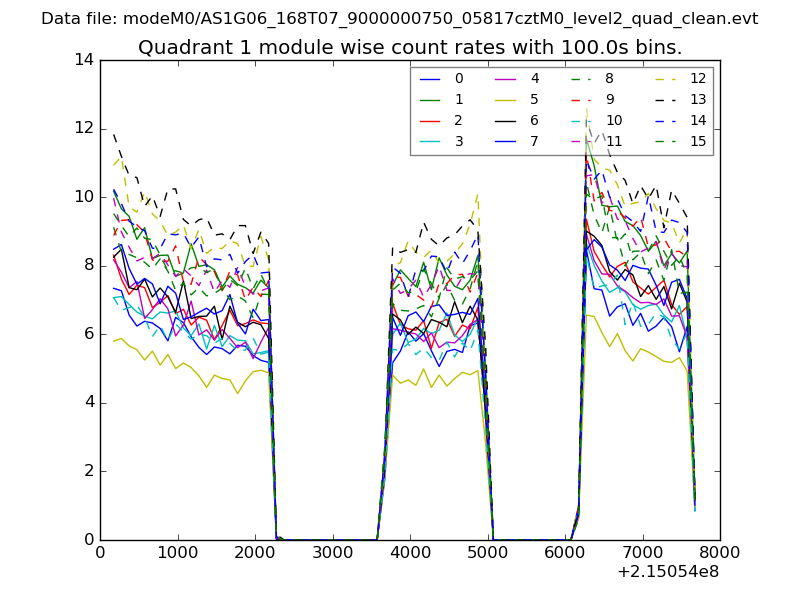 |
 |
| Module-wise count rates for Quadrant C Data is divided into 100 sec bins |
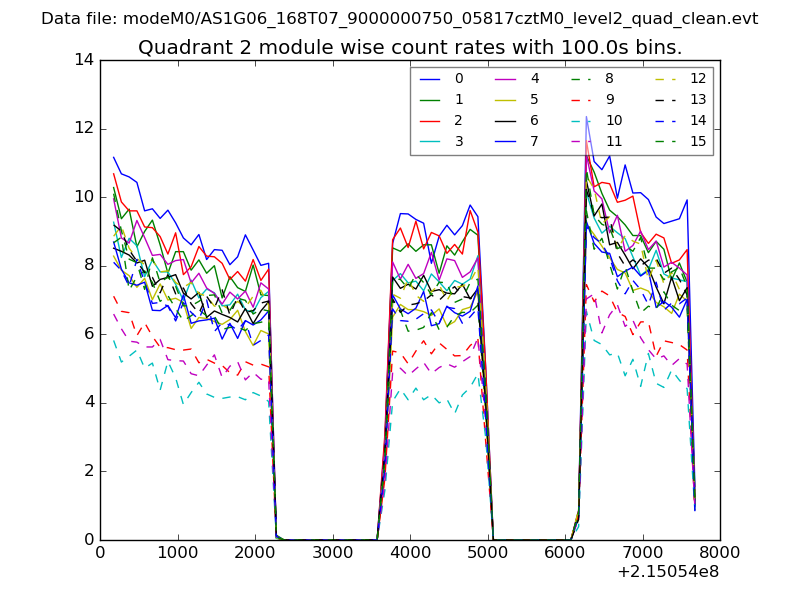 |
 |
| Module-wise count rates for Quadrant D Data is divided into 100 sec bins |
 |
 |
| Parameter | Plot |
|---|---|
| CZT HV Monitor | 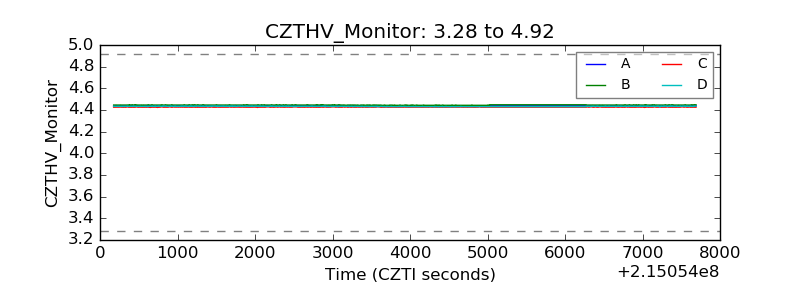 |
| D_VDD | 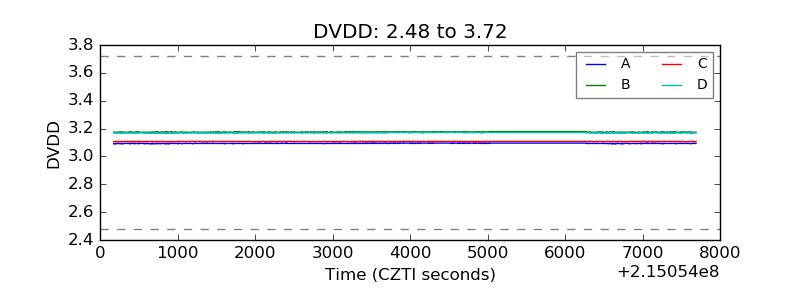 |
| Temperature 1 | 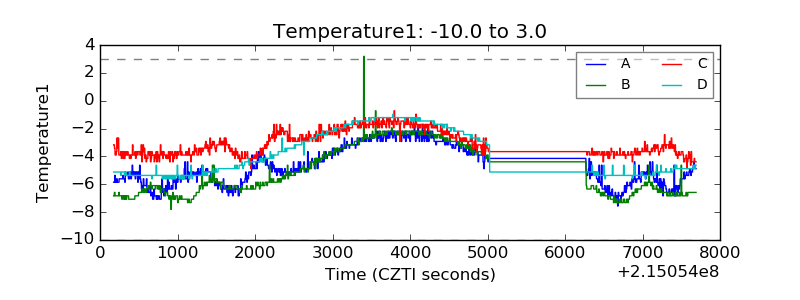 |
| Veto HV Monitor | 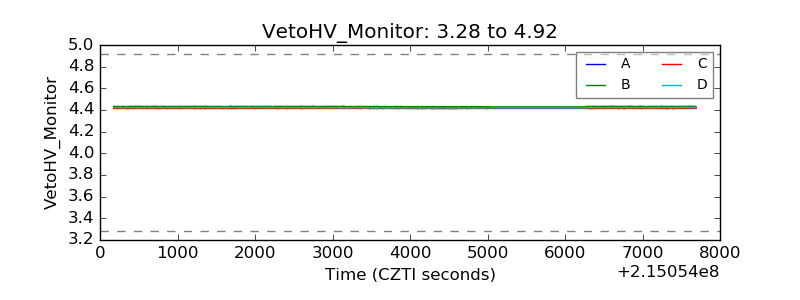 |
| Veto LLD | 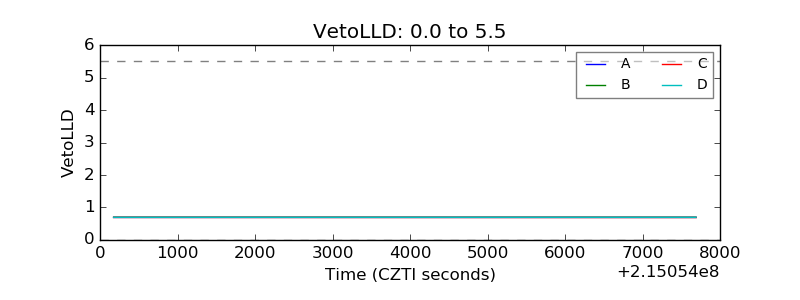 |
| Alpha Counter | 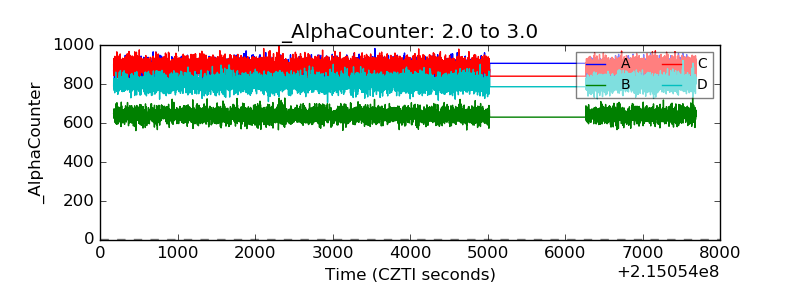 |
| _CPM_Rate | 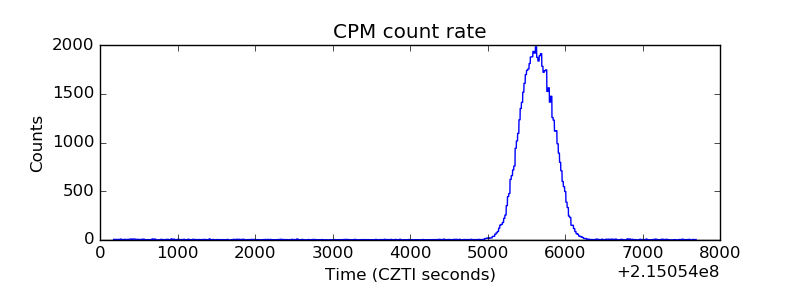 |
| CZT Counter | 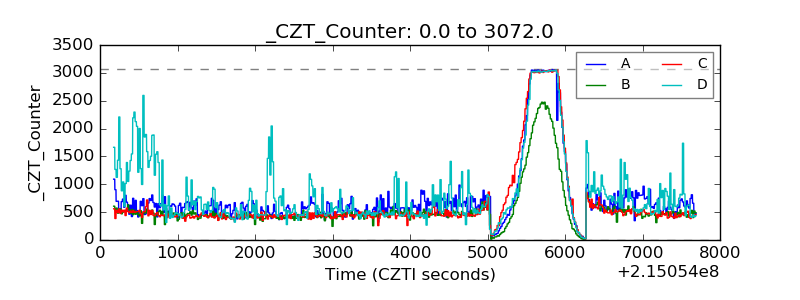 |
| +2.5 Volts monitor | 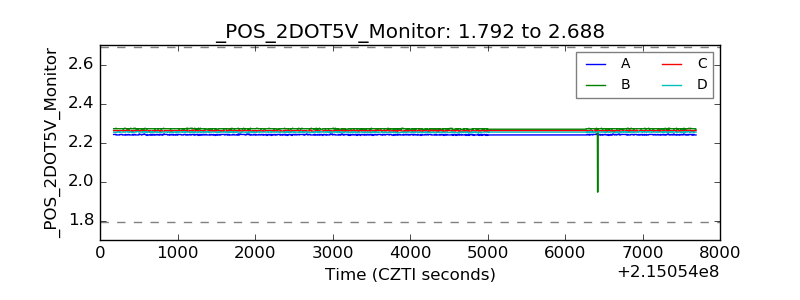 |
| +5 Volts monitor |  |
| _ROLL_ROT | 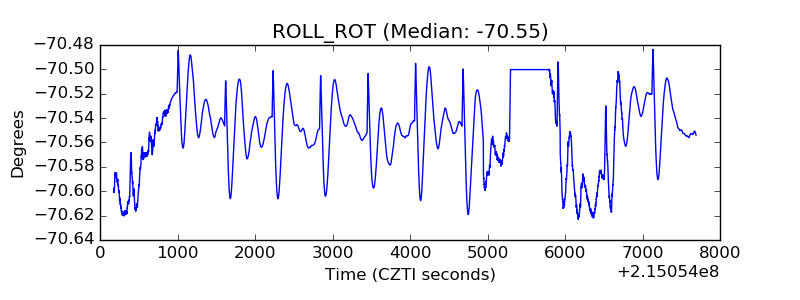 |
| _Roll_DEC | 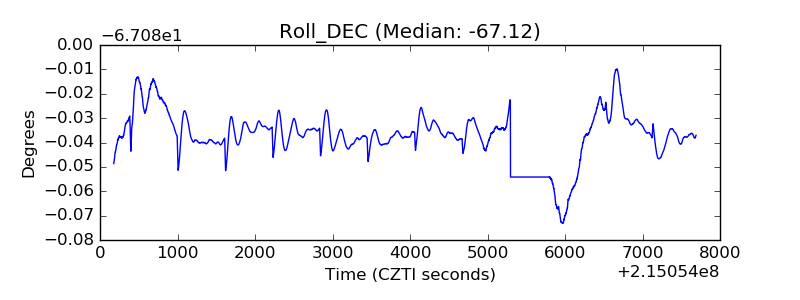 |
| _Roll_RA |  |
| Veto Counter | 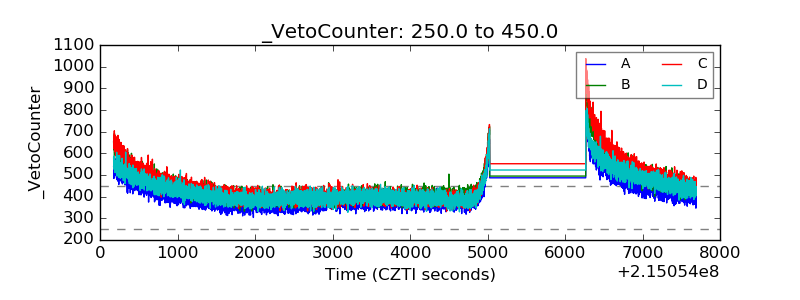 |