| Param | Original file | Final file |
|---|---|---|
| Filename | modeM0/AS1G06_168T07_9000000750_05818cztM0_level2.evt | modeM0/AS1G06_168T07_9000000750_05818cztM0_level2_quad_clean.evt |
| Size (bytes) | 463,101,120 | 90,558,720 |
| Size | 441.6 MB | 86.4 MB |
| Events in quadrant A | 3,627,125 | 576,639 |
| Events in quadrant B | 3,049,604 | 595,352 |
| Events in quadrant C | 3,000,223 | 586,184 |
| Events in quadrant D | 3,921,710 | 546,001 |
| Mode M9 | |||
|---|---|---|---|
| Quadrant | BADHDUFLAG | Total packets | Discarded packets |
| A | 0 | 18 | 0 |
| B | 0 | 18 | 0 |
| C | 0 | 18 | 0 |
| D | 0 | 19 | 0 |
| Mode SS | |||
|---|---|---|---|
| Quadrant | BADHDUFLAG | Total packets | Discarded packets |
| A | 0 | 126 | 0 |
| B | 0 | 126 | 0 |
| C | 0 | 126 | 0 |
| D | 0 | 126 | 0 |
| Mode M0 | |||
|---|---|---|---|
| Quadrant | BADHDUFLAG | Total packets | Discarded packets |
| A | 0 | 14914 | 3 |
| B | 0 | 12983 | 2 |
| C | 0 | 12919 | 2 |
| D | 0 | 15621 | 2 |
| Quadrant | Total seconds | Saturated seconds | Saturation percentage |
|---|---|---|---|
| A | 6285 | 50 | 0.795545% |
| B | 6285 | 14 | 0.222753% |
| C | 6285 | 19 | 0.302307% |
| D | 6285 | 185 | 2.943516% |
Noise dominated data is calculated using 1-second bins in cleaned event files. If a bin has >2000 counts, and if more than 50% of those come from <1% of pixels, then it is considered to be noise-dominated and hence unusable.
| Quadrant | # 1 sec bins | Bins with >0 counts | Bins with >2000 counts | High rate bins dominated by noise | Noise dominated (total time) | Noise dominated (detector-on time) | Marked lightcurve |
|---|---|---|---|---|---|---|---|
| A | 7620 | 6286 | 25 | 25 | 0.33% | 0.40% | 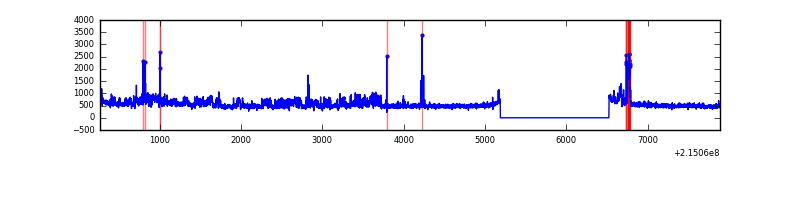 |
| B | 7620 | 6286 | 0 | 0 | 0.00% | 0.00% | 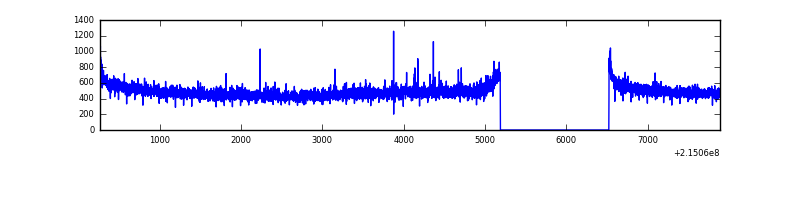 |
| C | 7620 | 6286 | 0 | 0 | 0.00% | 0.00% | 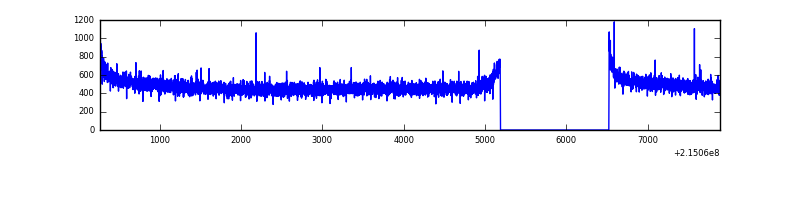 |
| D | 7620 | 6286 | 124 | 124 | 1.63% | 1.97% | 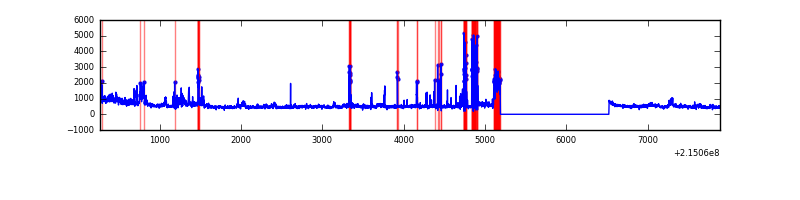 |
Top three noisy pixels from each quadrant. If the there are fewer than three noisy pixels in the level2.evt file, extra rows are filled as -1
| Pixel properties | Quadrant properties | ||||||
|---|---|---|---|---|---|---|---|
| Quadrant | DetID | PixID | Counts | Sigma | Mean | Median | Sigma |
| A | 15 | 236 | 347977 | 2257.83 | 764 | 748 | 153.8 |
| A | 15 | 79 | 275237 | 1784.84 | 764 | 748 | 153.8 |
| A | 15 | 223 | 47883 | 306.49 | 764 | 748 | 153.8 |
| B | 11 | 51 | 14536 | 95.6 | 779 | 762 | 144.1 |
| B | 12 | 111 | 13122 | 85.79 | 779 | 762 | 144.1 |
| B | 11 | 111 | 10215 | 65.61 | 779 | 762 | 144.1 |
| C | 13 | 61 | 6245 | 31.11 | 766 | 771 | 175.9 |
| C | 1 | 16 | 4261 | 19.84 | 766 | 771 | 175.9 |
| C | 12 | 4 | 3287 | 14.3 | 766 | 771 | 175.9 |
| D | 8 | 230 | 804200 | 4479.96 | 744 | 724 | 179.3 |
| D | 11 | 241 | 257036 | 1429.12 | 744 | 724 | 179.3 |
| D | 8 | 195 | 28166 | 153.01 | 744 | 724 | 179.3 |
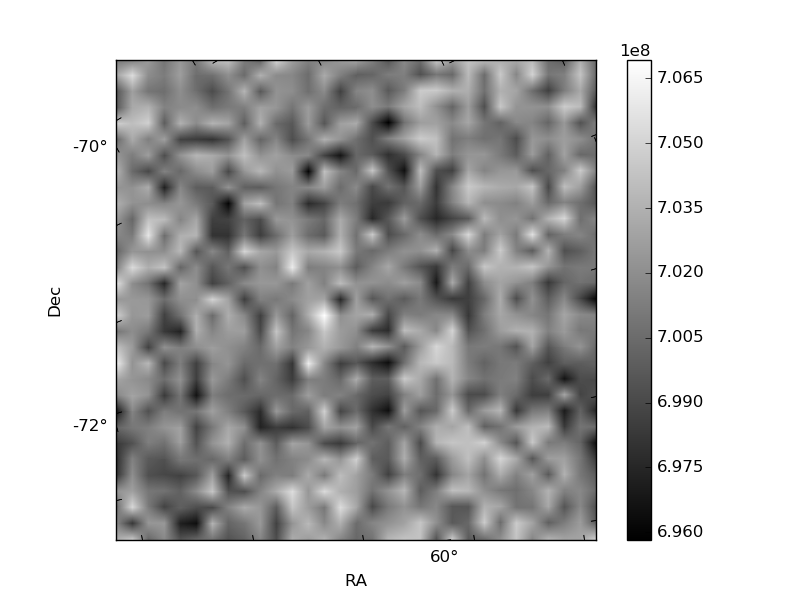
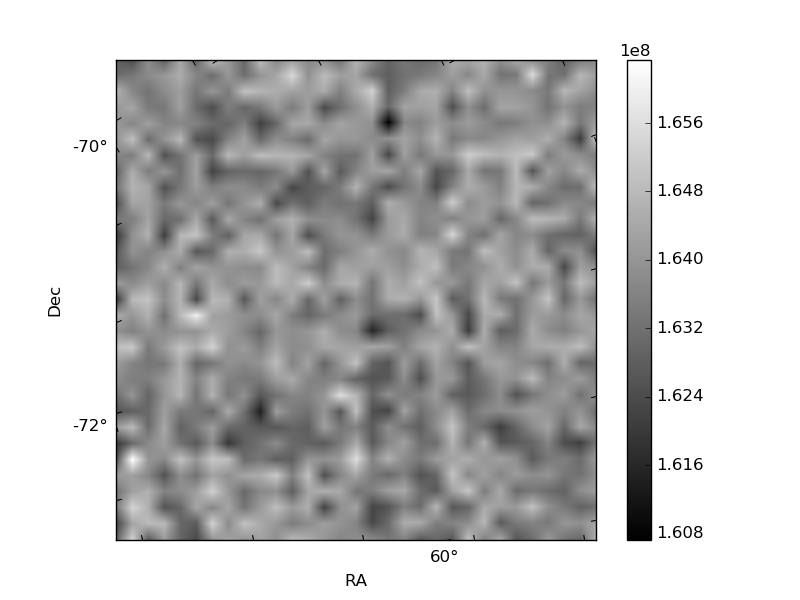
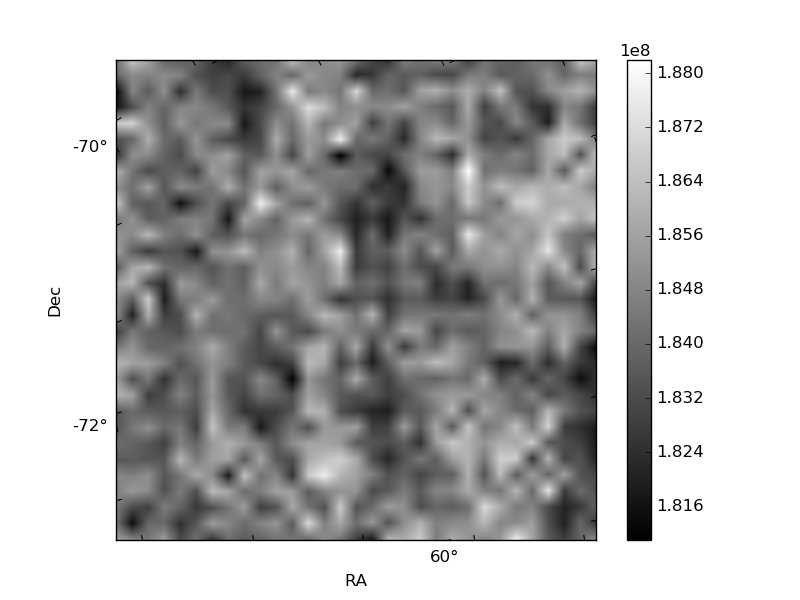
Histogram calculated using DETX and DETY for each event in the final _common_clean file
| Quadrant A | 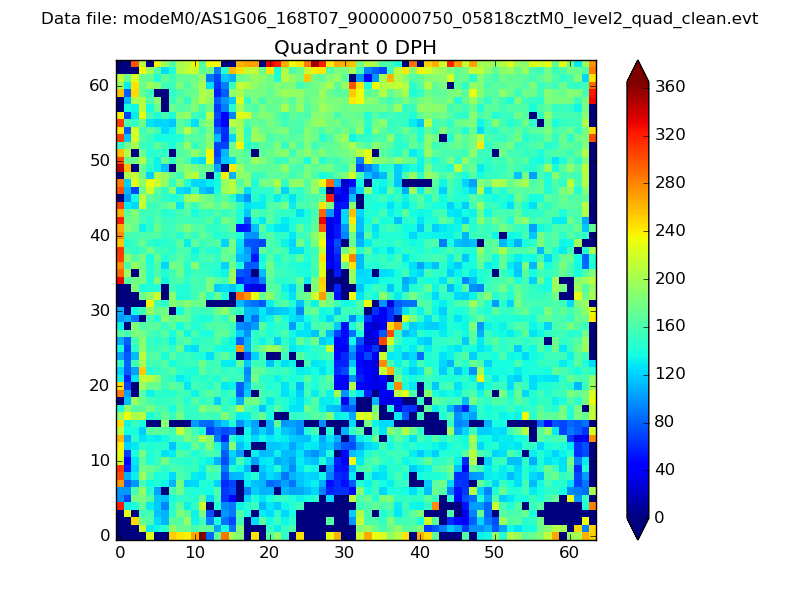 |
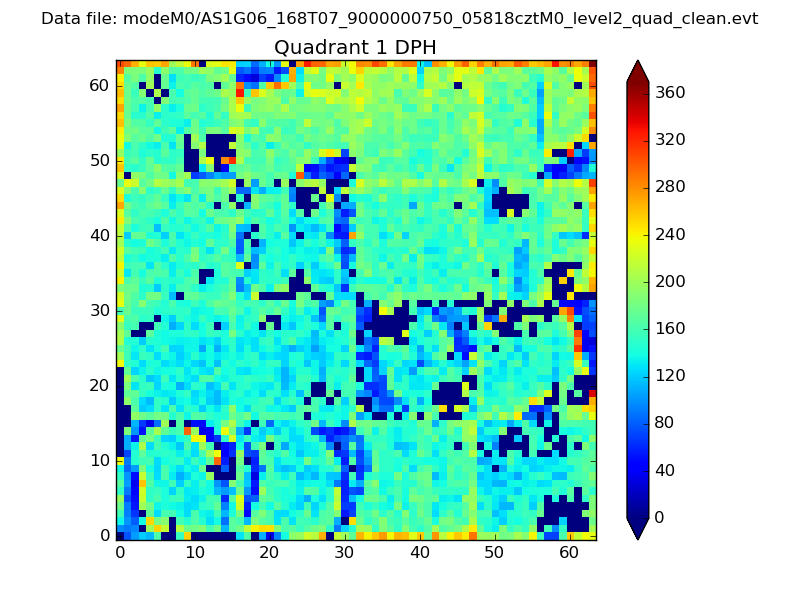 |
Quadrant B |
|---|---|---|---|
| Quadrant D | 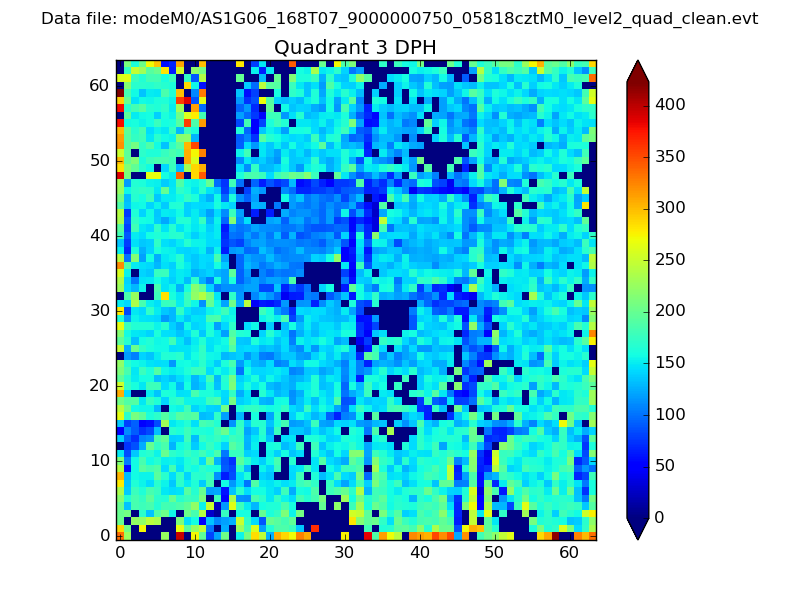 |
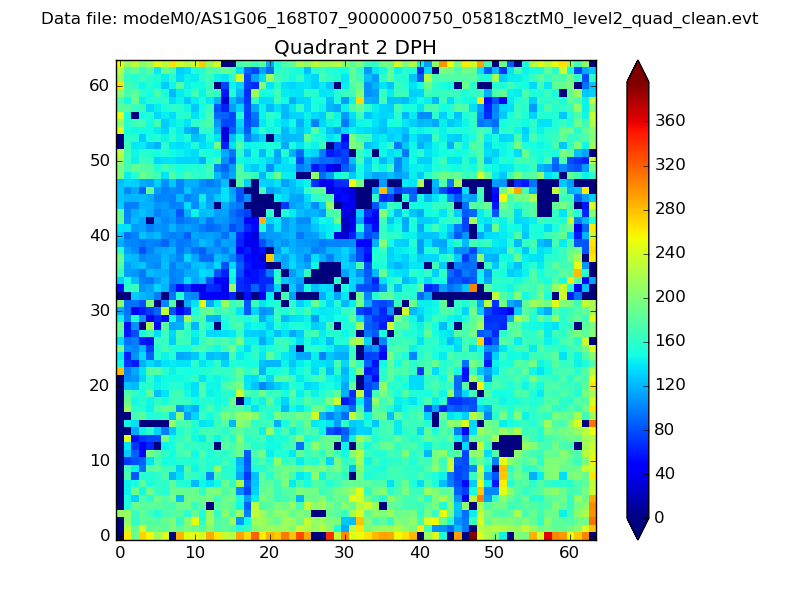 |
Quadrant C |
| Plot type | Count rate plots | Images |
|---|---|---|
| Comparison with Poisson distribution Blue bars denote a histogram of data divided into 1 sec bins. Red curve is a Poisson curve with rate = median count rate of data. |
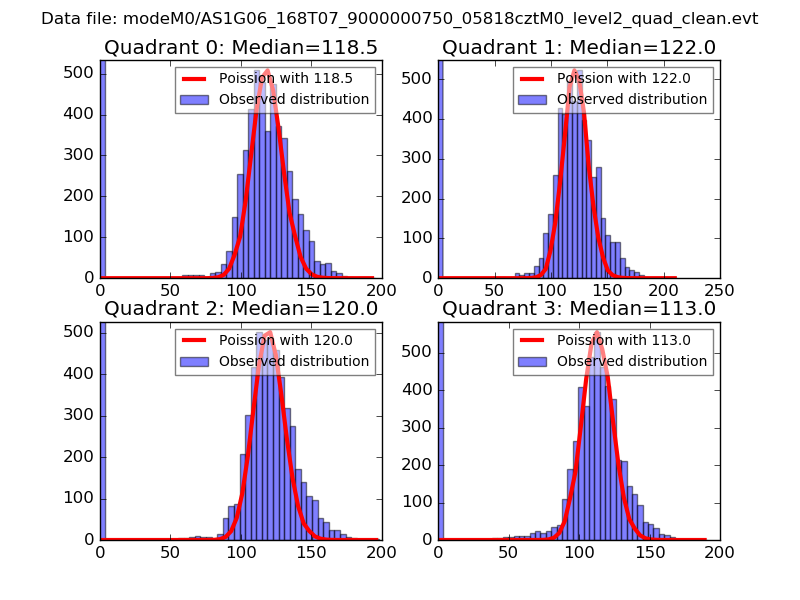 |
 |
| Quadrant-wise count rates Data is divided into 100 sec bins |
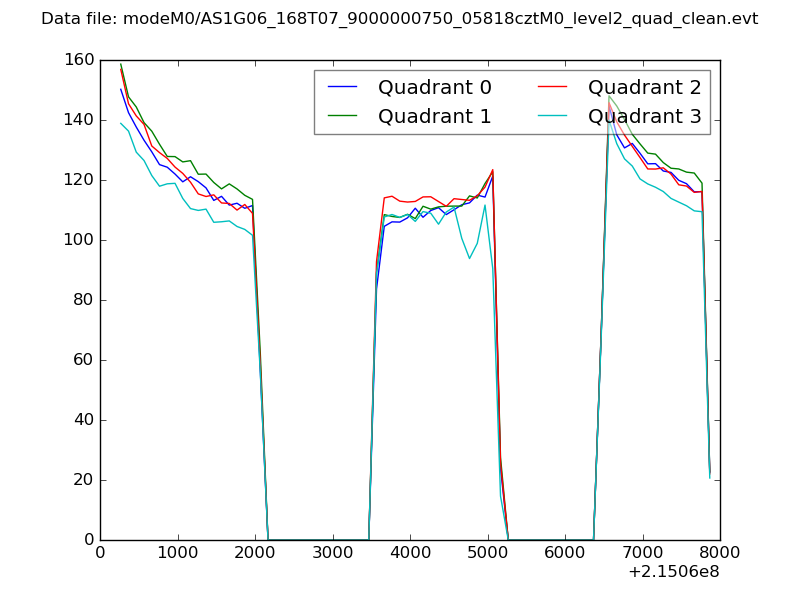 |
|
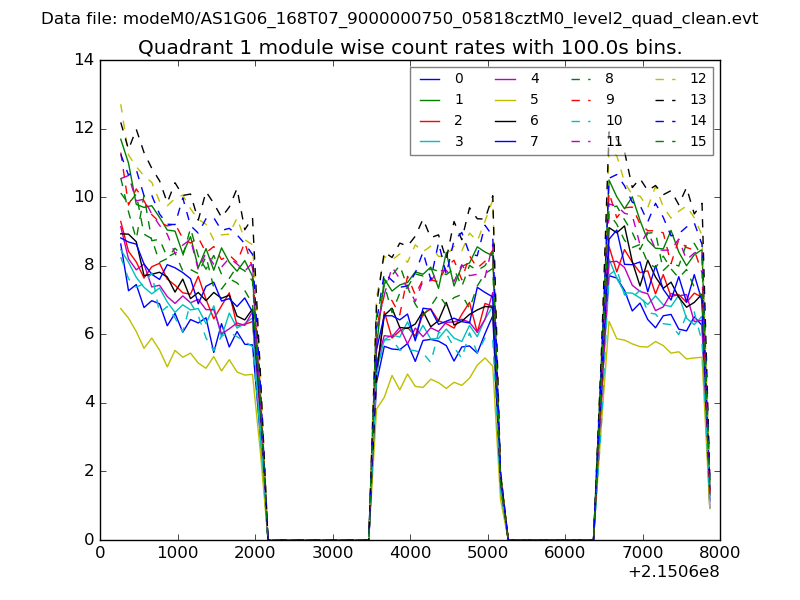
| Module-wise count rates for Quadrant A Data is divided into 100 sec bins |
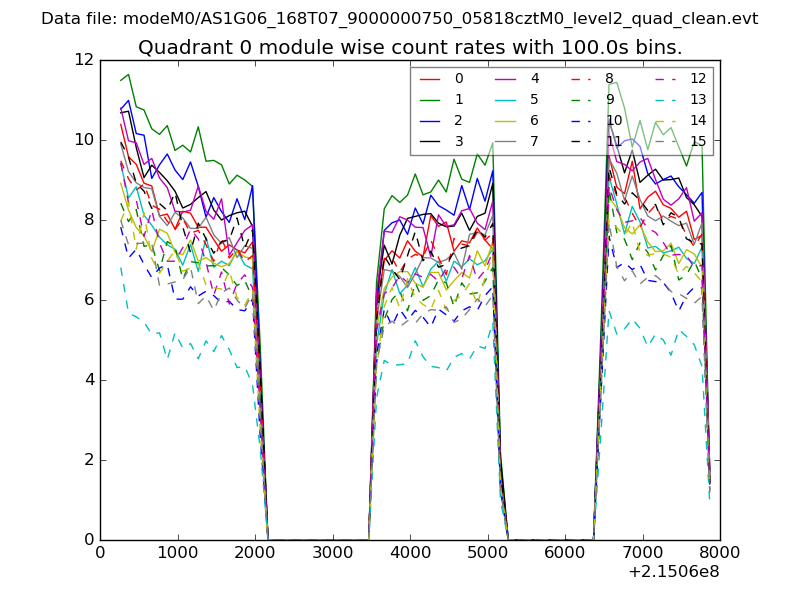 |
 |
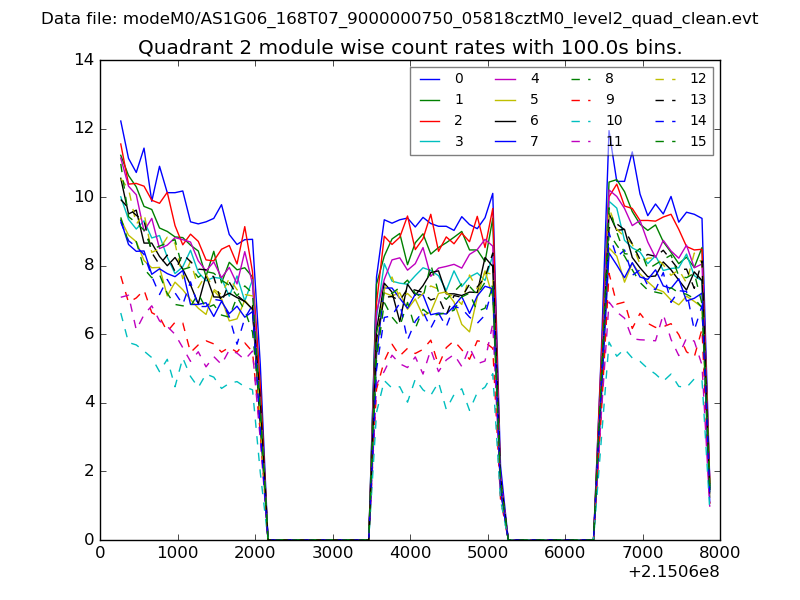
| Module-wise count rates for Quadrant B Data is divided into 100 sec bins |
 |
 |
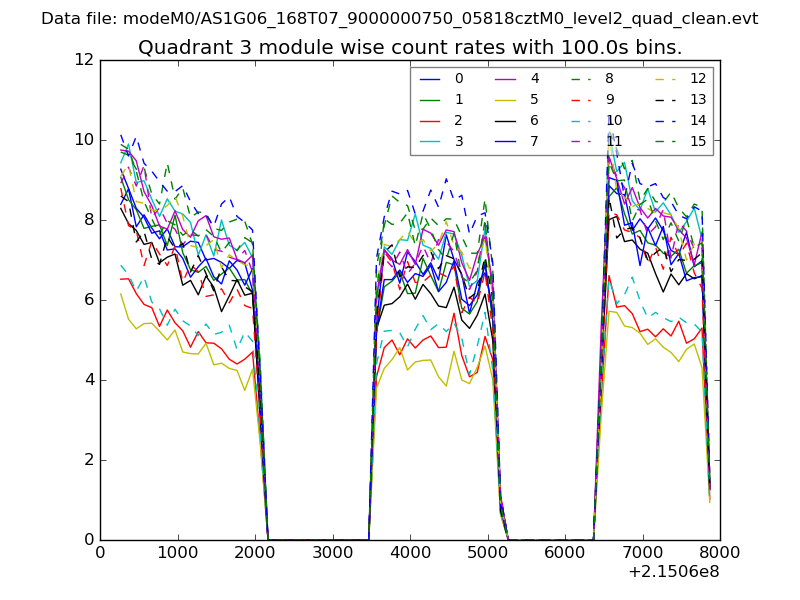
| Module-wise count rates for Quadrant C Data is divided into 100 sec bins |
 |
 |
| Module-wise count rates for Quadrant D Data is divided into 100 sec bins |
 |
 |
| Parameter | Plot |
|---|---|
| CZT HV Monitor | 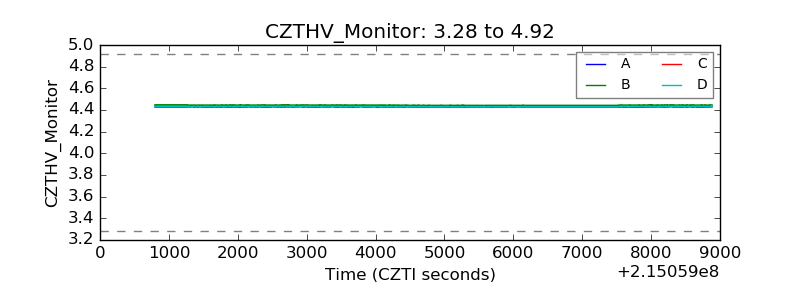 |
| D_VDD | 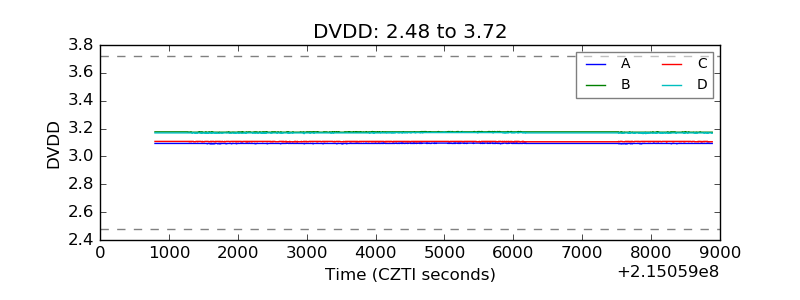 |
| Temperature 1 | 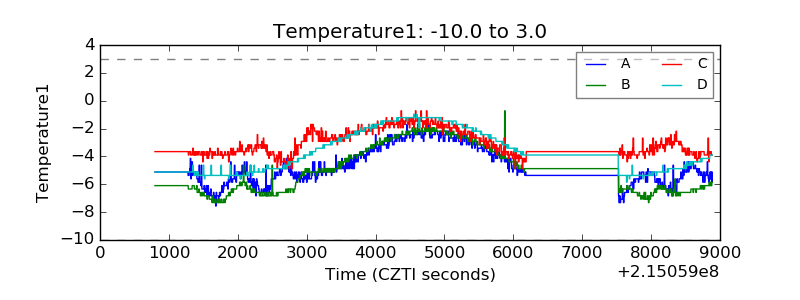 |
| Veto HV Monitor | 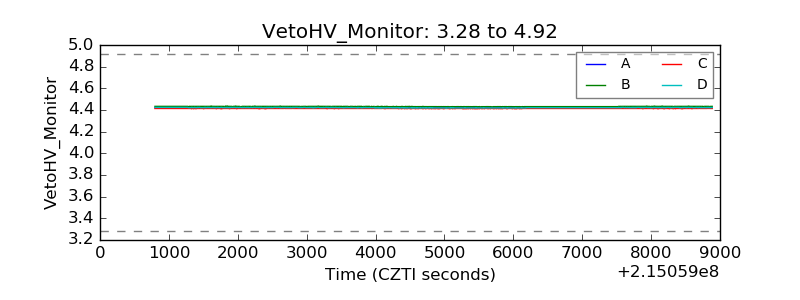 |
| Veto LLD | 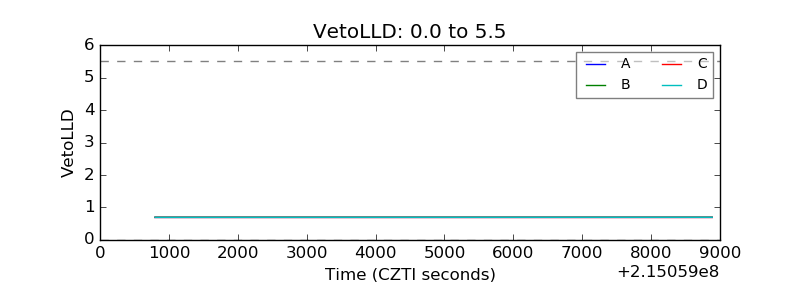 |
| Alpha Counter | 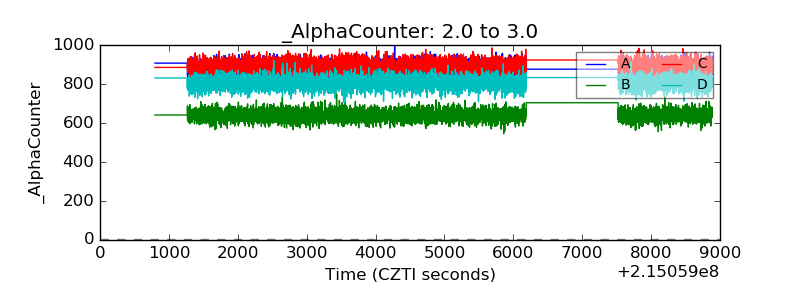 |
| _CPM_Rate | 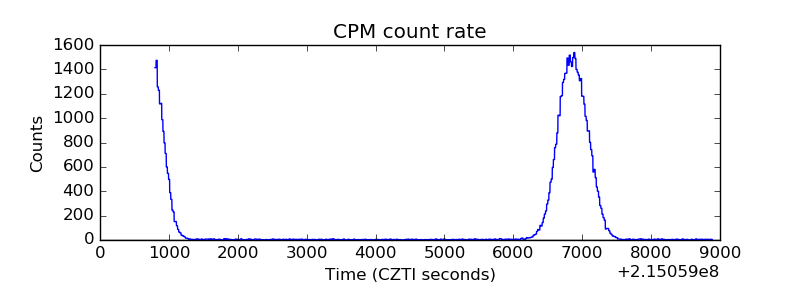 |
| CZT Counter | 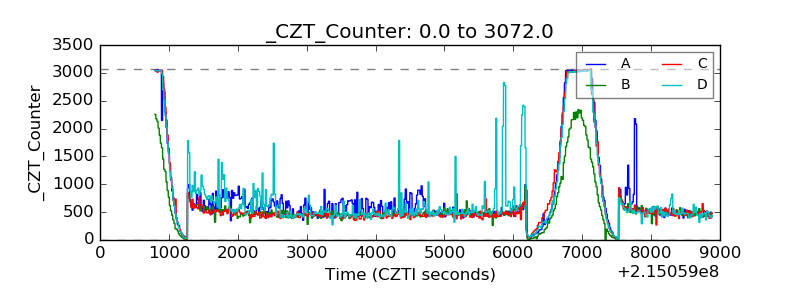 |
| +2.5 Volts monitor | 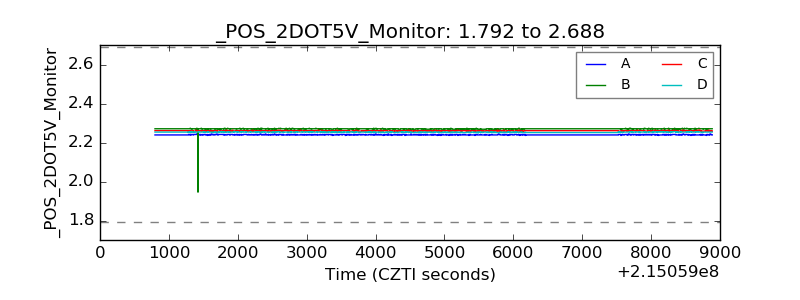 |
| +5 Volts monitor | 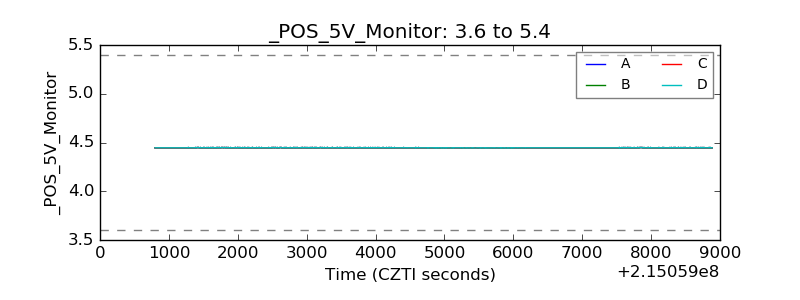 |
| _ROLL_ROT | 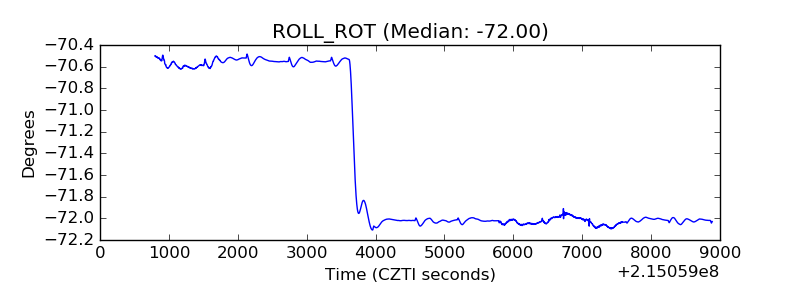 |
| _Roll_DEC | 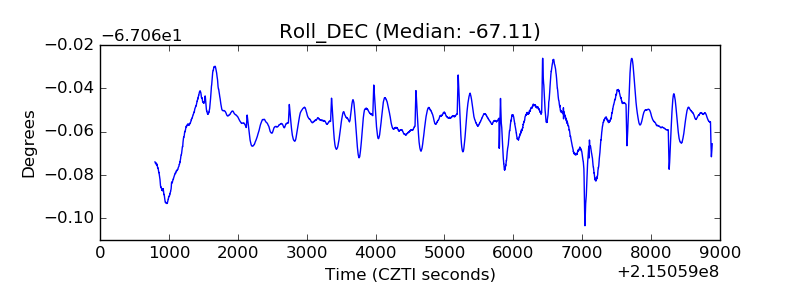 |
| _Roll_RA | 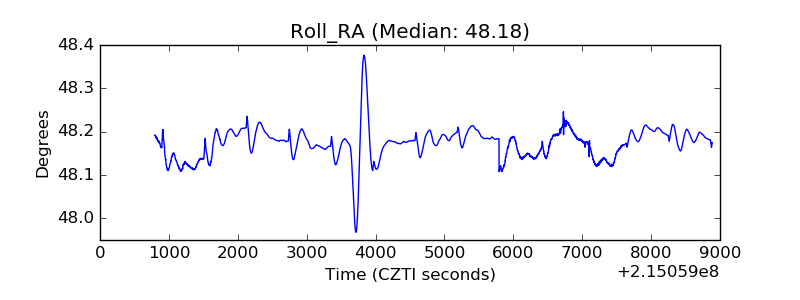 |
| Veto Counter | 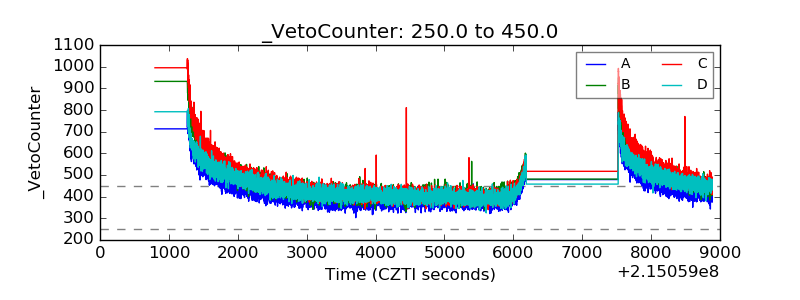 |