| Param | Original file | Final file |
|---|---|---|
| Filename | modeM0/AS1G06_168T07_9000000750_05819cztM0_level2.evt | modeM0/AS1G06_168T07_9000000750_05819cztM0_level2_quad_clean.evt |
| Size (bytes) | 399,133,440 | 73,307,520 |
| Size | 380.6 MB | 69.9 MB |
| Events in quadrant A | 2,985,592 | 452,805 |
| Events in quadrant B | 2,776,344 | 463,839 |
| Events in quadrant C | 2,728,892 | 460,509 |
| Events in quadrant D | 3,205,339 | 440,228 |
| Mode M9 | |||
|---|---|---|---|
| Quadrant | BADHDUFLAG | Total packets | Discarded packets |
| A | 0 | 13 | 0 |
| B | 0 | 13 | 0 |
| C | 0 | 13 | 0 |
| D | 0 | 13 | 0 |
| Mode SS | |||
|---|---|---|---|
| Quadrant | BADHDUFLAG | Total packets | Discarded packets |
| A | 0 | 116 | 0 |
| B | 0 | 116 | 0 |
| C | 0 | 116 | 0 |
| D | 0 | 116 | 0 |
| Mode M0 | |||
|---|---|---|---|
| Quadrant | BADHDUFLAG | Total packets | Discarded packets |
| A | 0 | 12526 | 2 |
| B | 0 | 11792 | 1 |
| C | 0 | 11811 | 3 |
| D | 0 | 13250 | 1 |
| Quadrant | Total seconds | Saturated seconds | Saturation percentage |
|---|---|---|---|
| A | 5760 | 19 | 0.329861% |
| B | 5760 | 31 | 0.538194% |
| C | 5759 | 36 | 0.625109% |
| D | 5760 | 180 | 3.125000% |
Noise dominated data is calculated using 1-second bins in cleaned event files. If a bin has >2000 counts, and if more than 50% of those come from <1% of pixels, then it is considered to be noise-dominated and hence unusable.
| Quadrant | # 1 sec bins | Bins with >0 counts | Bins with >2000 counts | High rate bins dominated by noise | Noise dominated (total time) | Noise dominated (detector-on time) | Marked lightcurve |
|---|---|---|---|---|---|---|---|
| A | 7060 | 5762 | 0 | 0 | 0.00% | 0.00% | 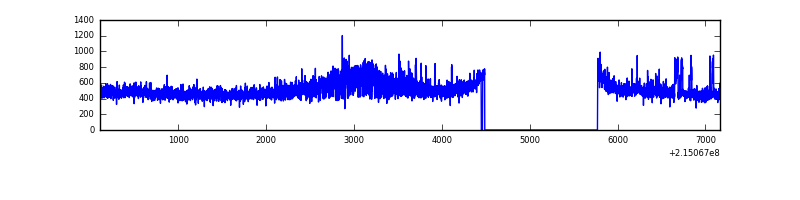 |
| B | 7060 | 5762 | 1 | 1 | 0.01% | 0.02% | 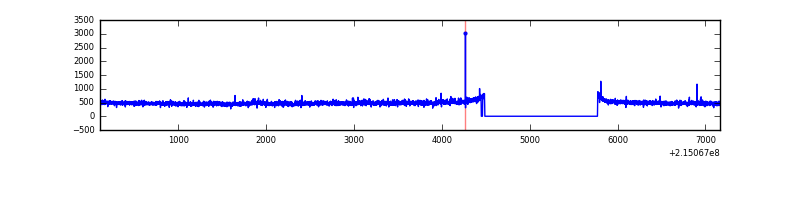 |
| C | 7060 | 5762 | 0 | 0 | 0.00% | 0.00% | 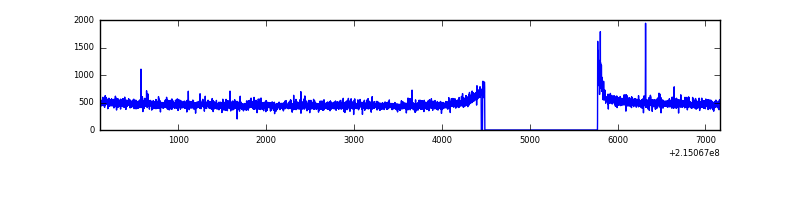 |
| D | 7060 | 5762 | 144 | 144 | 2.04% | 2.50% | 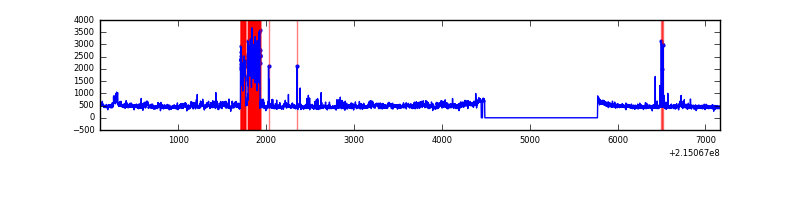 |
Top three noisy pixels from each quadrant. If the there are fewer than three noisy pixels in the level2.evt file, extra rows are filled as -1
| Pixel properties | Quadrant properties | ||||||
|---|---|---|---|---|---|---|---|
| Quadrant | DetID | PixID | Counts | Sigma | Mean | Median | Sigma |
| A | 15 | 236 | 315239 | 2269.97 | 686 | 672 | 138.6 |
| A | 15 | 79 | 20758 | 144.94 | 686 | 672 | 138.6 |
| A | 12 | 194 | 6738 | 43.77 | 686 | 672 | 138.6 |
| B | 15 | 204 | 49379 | 371.71 | 697 | 681 | 131.0 |
| B | 12 | 111 | 11919 | 85.78 | 697 | 681 | 131.0 |
| B | 11 | 111 | 9497 | 67.29 | 697 | 681 | 131.0 |
| C | 9 | 16 | 48468 | 305.12 | 683 | 686 | 156.6 |
| C | 8 | 79 | 6978 | 40.18 | 683 | 686 | 156.6 |
| C | 13 | 61 | 5482 | 30.63 | 683 | 686 | 156.6 |
| D | 8 | 230 | 404871 | 2482.04 | 670 | 649 | 162.9 |
| D | 11 | 241 | 193594 | 1184.74 | 670 | 649 | 162.9 |
| D | 8 | 195 | 32387 | 194.88 | 670 | 649 | 162.9 |
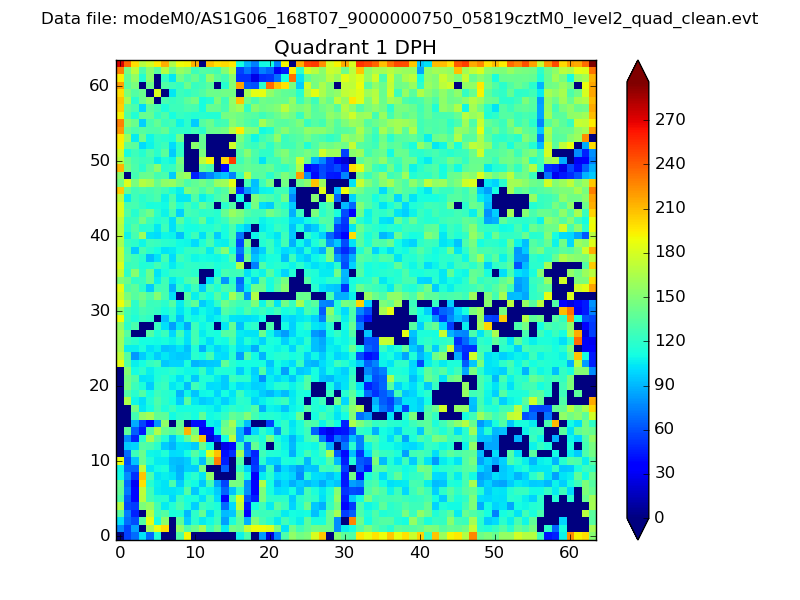
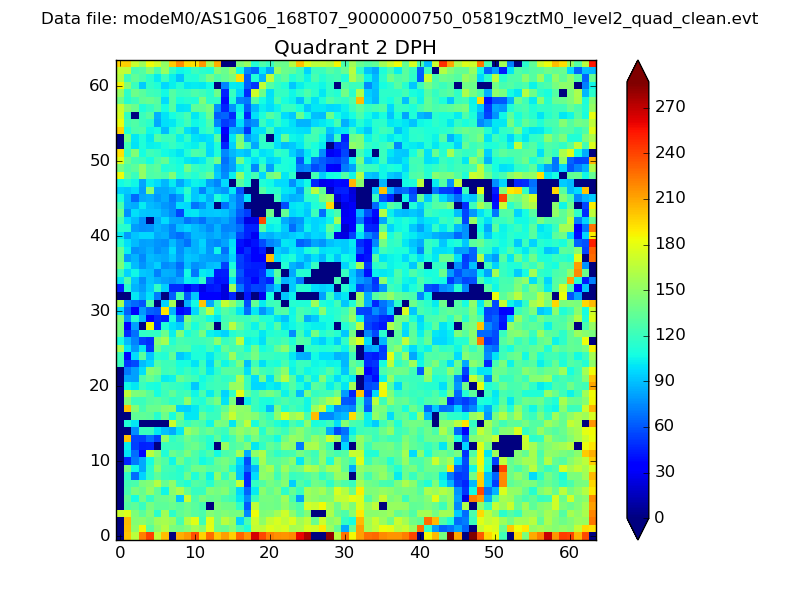
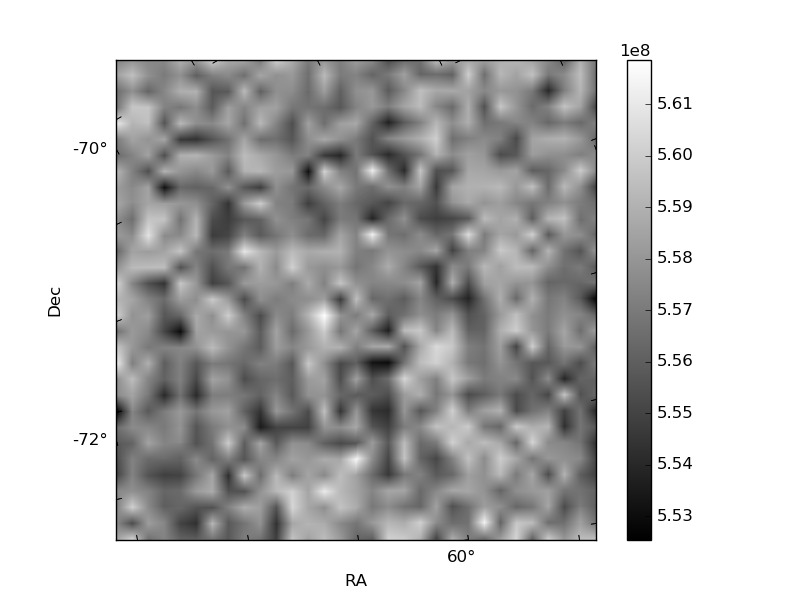
Histogram calculated using DETX and DETY for each event in the final _common_clean file
| Quadrant A |  |
 |
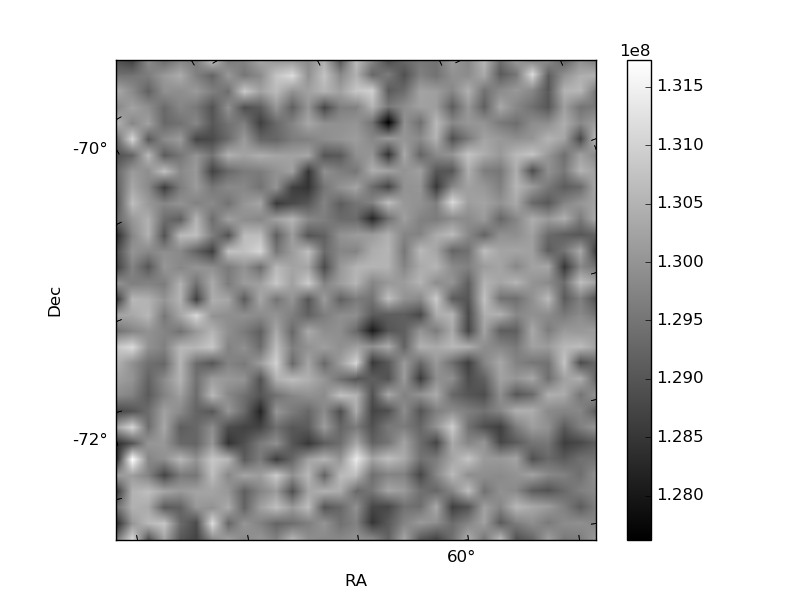
Quadrant B |
|---|---|---|---|
| Quadrant D | 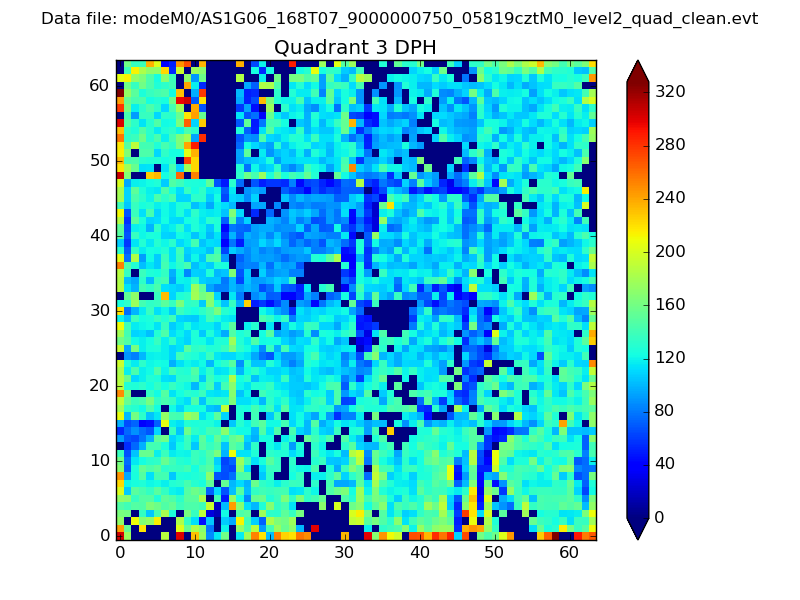 |
 |
Quadrant C |
| Plot type | Count rate plots | Images |
|---|---|---|
| Comparison with Poisson distribution Blue bars denote a histogram of data divided into 1 sec bins. Red curve is a Poisson curve with rate = median count rate of data. |
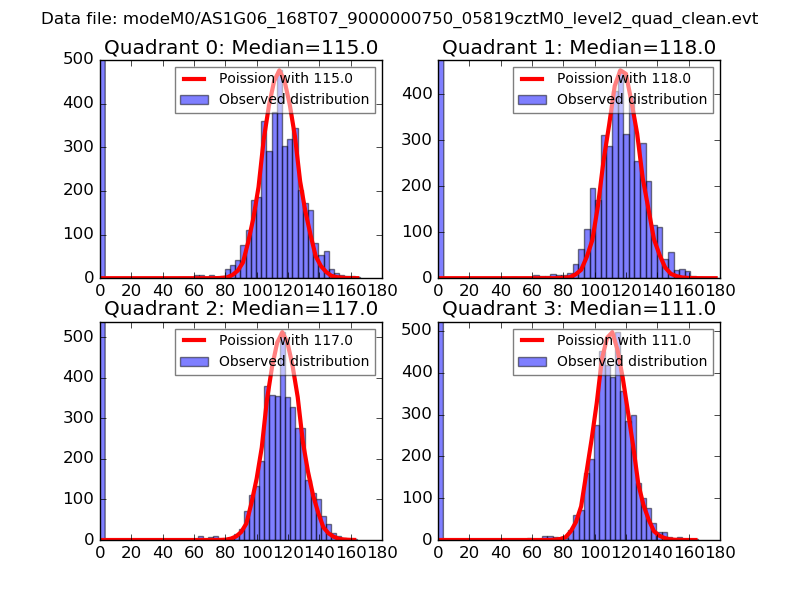 |
 |
| Quadrant-wise count rates Data is divided into 100 sec bins |
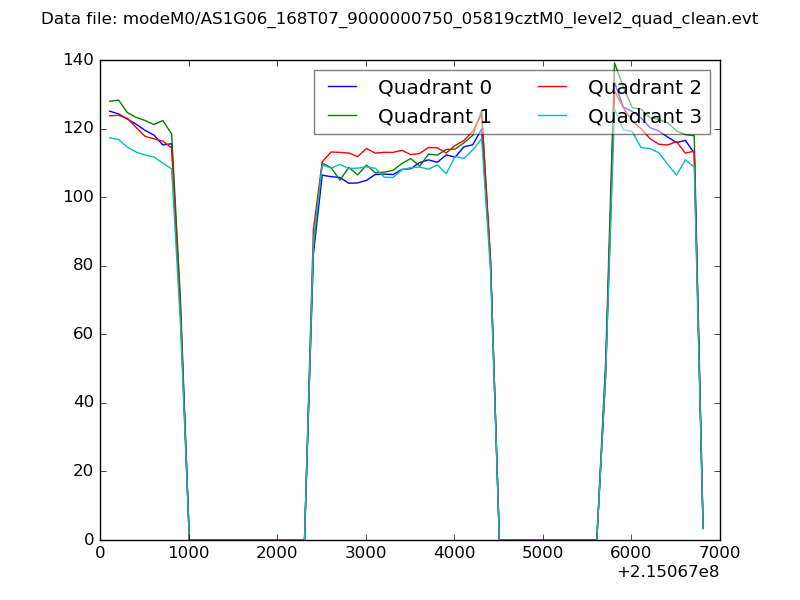 |
|
| Module-wise count rates for Quadrant A Data is divided into 100 sec bins |
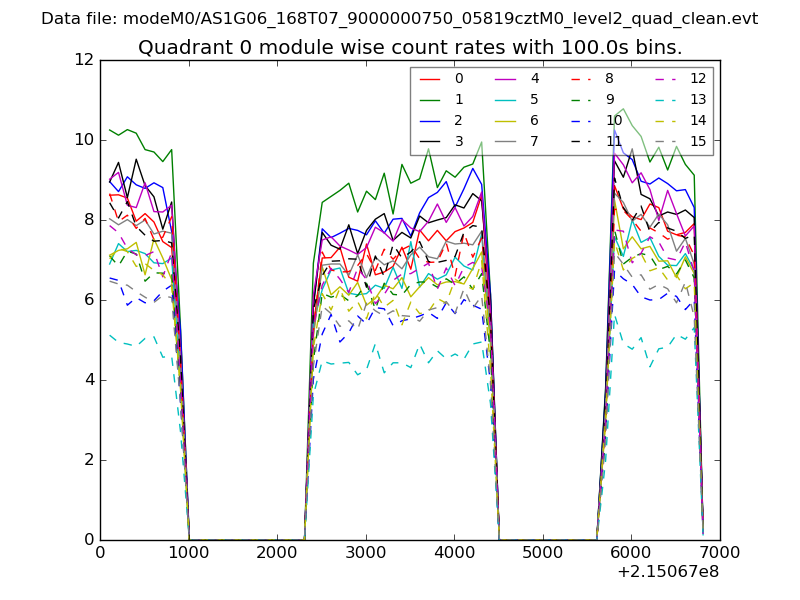 |
 |
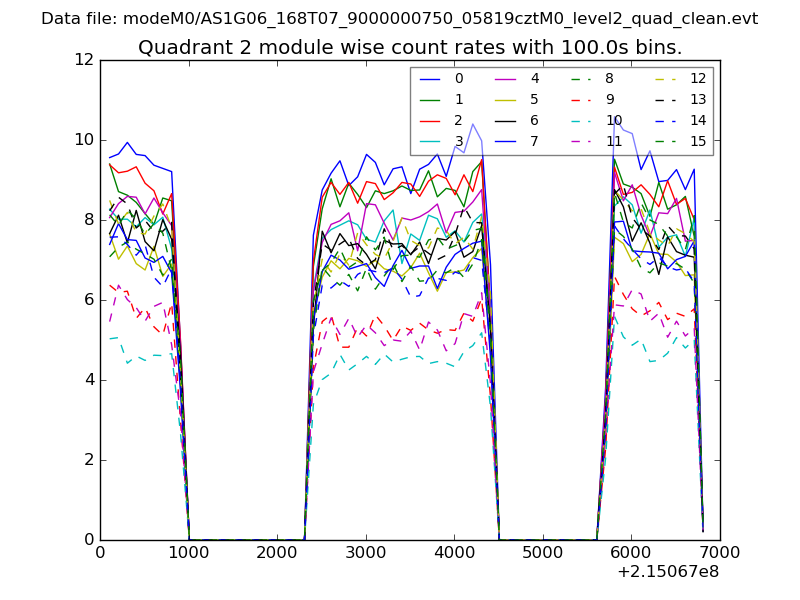
| Module-wise count rates for Quadrant B Data is divided into 100 sec bins |
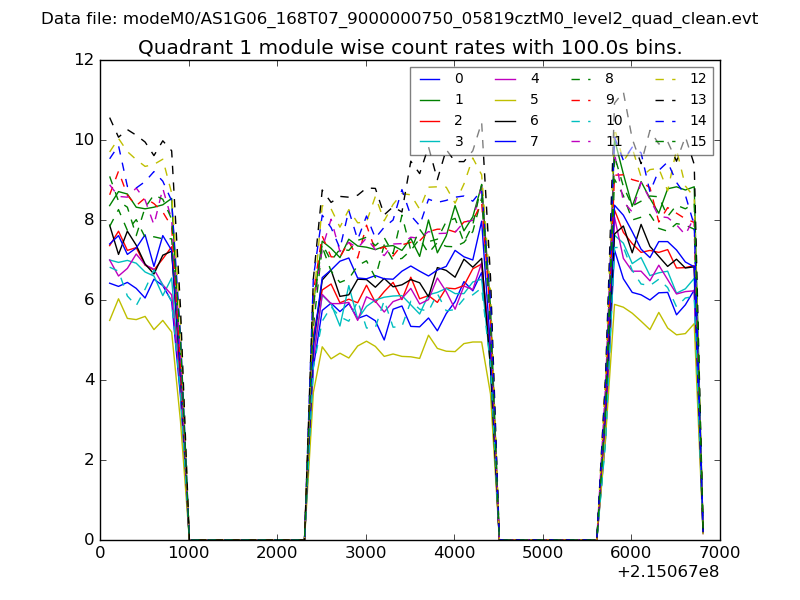 |
 |
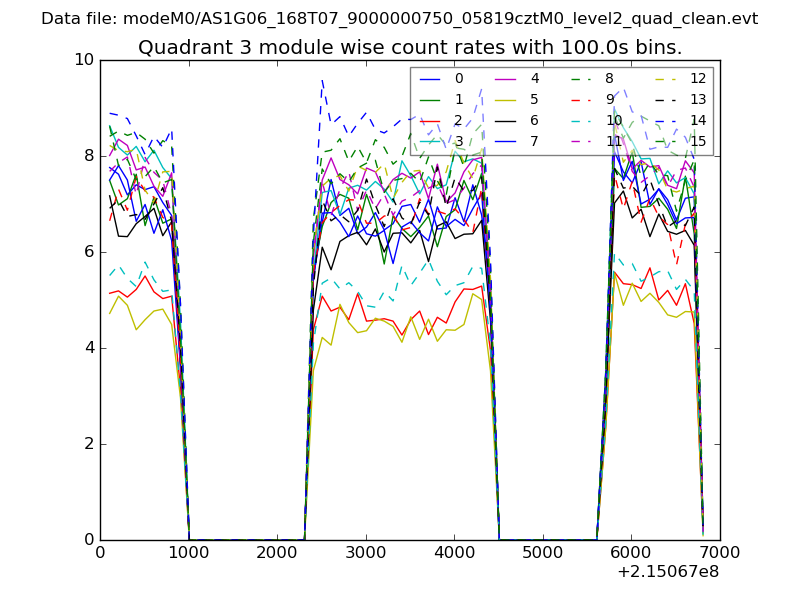
| Module-wise count rates for Quadrant C Data is divided into 100 sec bins |
 |
 |
| Module-wise count rates for Quadrant D Data is divided into 100 sec bins |
 |
 |
| Parameter | Plot |
|---|---|
| CZT HV Monitor | 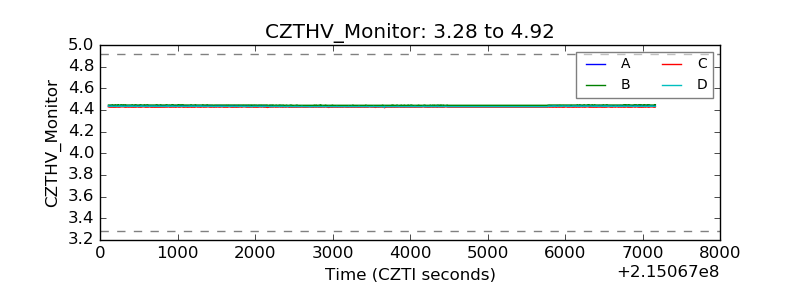 |
| D_VDD | 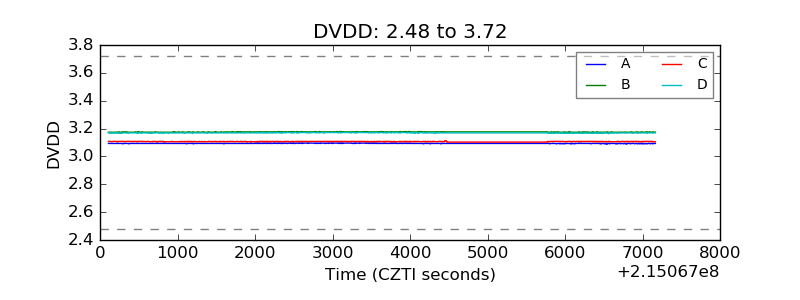 |
| Temperature 1 | 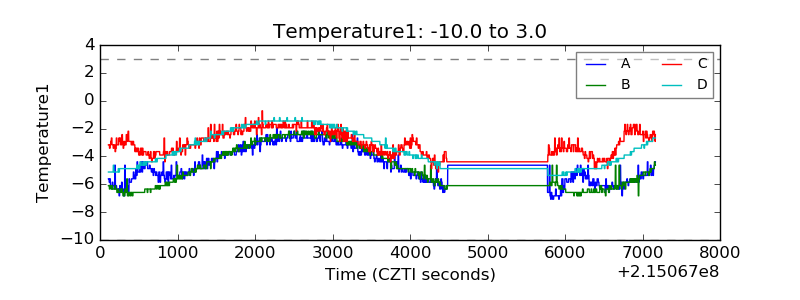 |
| Veto HV Monitor | 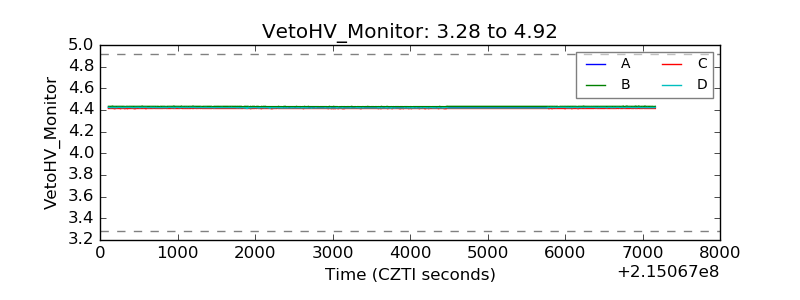 |
| Veto LLD | 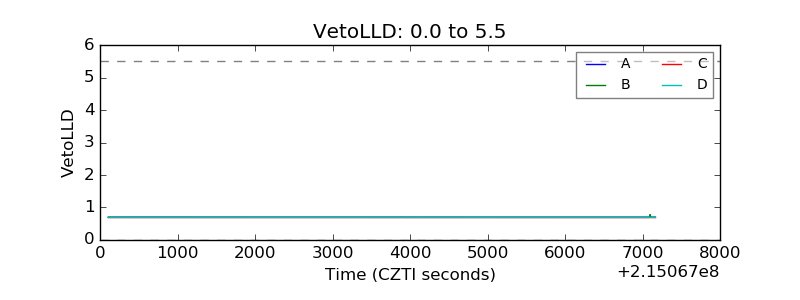 |
| Alpha Counter | 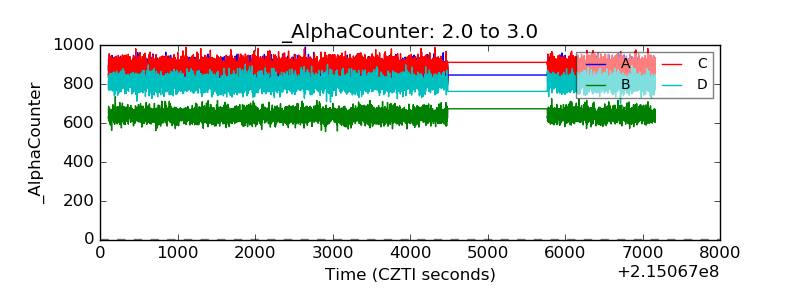 |
| _CPM_Rate | 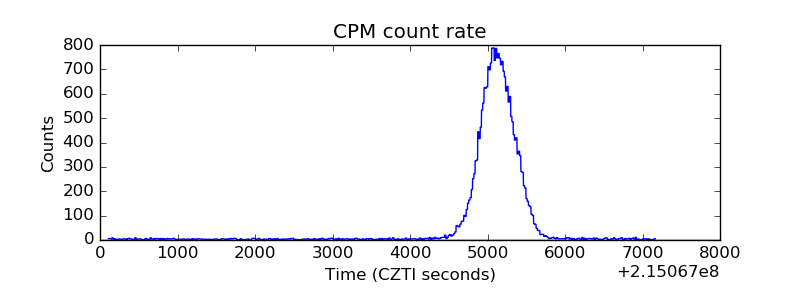 |
| CZT Counter | 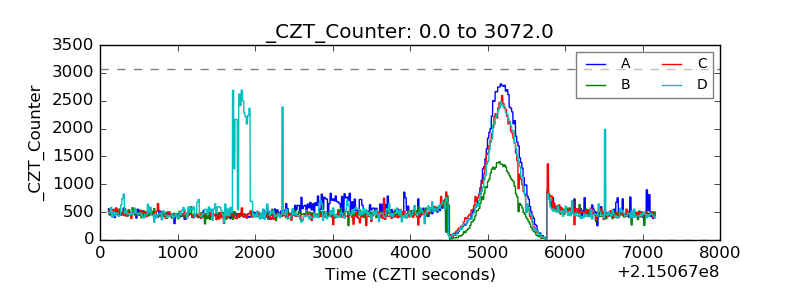 |
| +2.5 Volts monitor | 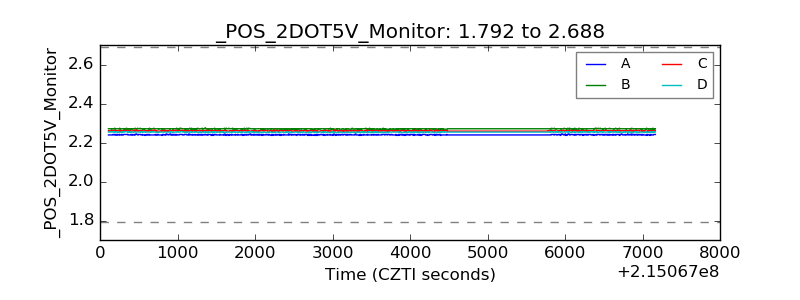 |
| +5 Volts monitor |  |
| _ROLL_ROT | 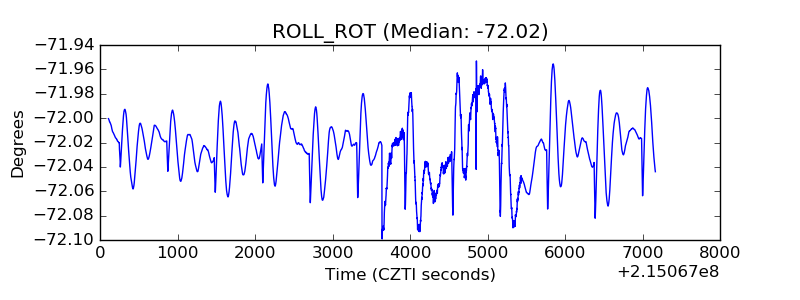 |
| _Roll_DEC | 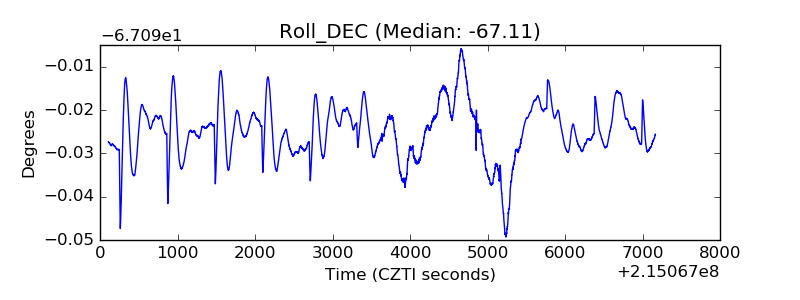 |
| _Roll_RA |  |
| Veto Counter | 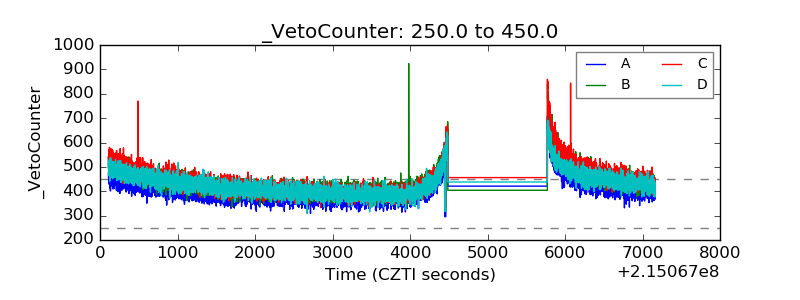 |