| Param | Original file | Final file |
|---|---|---|
| Filename | modeM0/AS1G06_168T07_9000000750_05820cztM0_level2.evt | modeM0/AS1G06_168T07_9000000750_05820cztM0_level2_quad_clean.evt |
| Size (bytes) | 386,971,200 | 69,459,840 |
| Size | 369.0 MB | 66.2 MB |
| Events in quadrant A | 3,201,843 | 421,018 |
| Events in quadrant B | 2,743,243 | 429,937 |
| Events in quadrant C | 2,669,008 | 428,863 |
| Events in quadrant D | 2,705,245 | 412,943 |
| Mode M9 | |||
|---|---|---|---|
| Quadrant | BADHDUFLAG | Total packets | Discarded packets |
| A | 0 | 12 | 0 |
| B | 0 | 12 | 0 |
| C | 0 | 12 | 0 |
| D | 0 | 12 | 0 |
| Mode SS | |||
|---|---|---|---|
| Quadrant | BADHDUFLAG | Total packets | Discarded packets |
| A | 0 | 122 | 4 |
| B | 0 | 122 | 4 |
| C | 0 | 122 | 2 |
| D | 0 | 122 | 4 |
| Mode M0 | |||
|---|---|---|---|
| Quadrant | BADHDUFLAG | Total packets | Discarded packets |
| A | 0 | 13831 | 514 |
| B | 0 | 12414 | 461 |
| C | 0 | 12375 | 439 |
| D | 0 | 12679 | 442 |
| Quadrant | Total seconds | Saturated seconds | Saturation percentage |
|---|---|---|---|
| A | 5870 | 69 | 1.175468% |
| B | 5871 | 44 | 0.749446% |
| C | 5879 | 37 | 0.629359% |
| D | 5882 | 53 | 0.901054% |
Noise dominated data is calculated using 1-second bins in cleaned event files. If a bin has >2000 counts, and if more than 50% of those come from <1% of pixels, then it is considered to be noise-dominated and hence unusable.
| Quadrant | # 1 sec bins | Bins with >0 counts | Bins with >2000 counts | High rate bins dominated by noise | Noise dominated (total time) | Noise dominated (detector-on time) | Marked lightcurve |
|---|---|---|---|---|---|---|---|
| A | 7232 | 5971 | 17 | 17 | 0.24% | 0.28% | 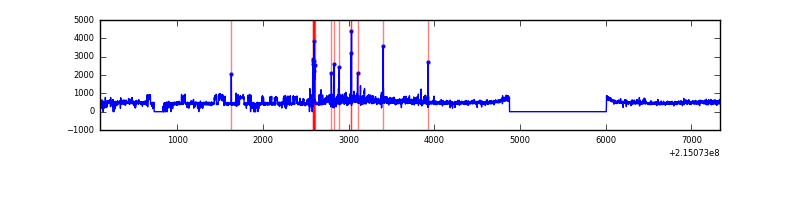 |
| B | 7232 | 5982 | 0 | 0 | 0.00% | 0.00% | 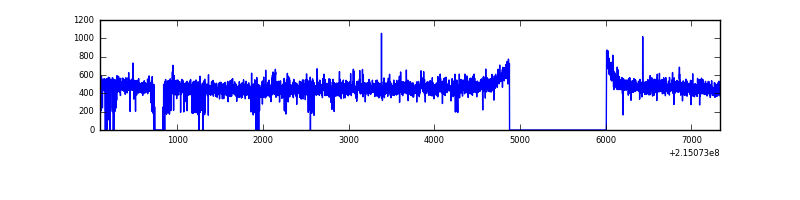 |
| C | 7232 | 5969 | 0 | 0 | 0.00% | 0.00% | 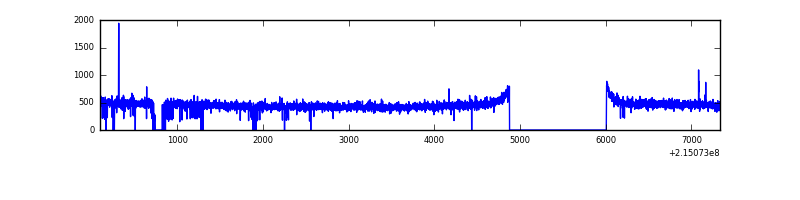 |
| D | 7232 | 5979 | 14 | 14 | 0.19% | 0.23% | 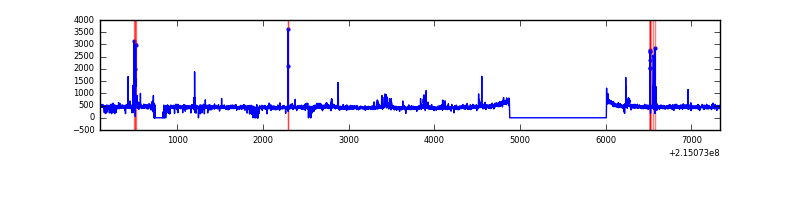 |
Top three noisy pixels from each quadrant. If the there are fewer than three noisy pixels in the level2.evt file, extra rows are filled as -1
| Pixel properties | Quadrant properties | ||||||
|---|---|---|---|---|---|---|---|
| Quadrant | DetID | PixID | Counts | Sigma | Mean | Median | Sigma |
| A | 15 | 236 | 454898 | 3288.92 | 684 | 669 | 138.1 |
| A | 15 | 223 | 97395 | 700.36 | 684 | 669 | 138.1 |
| A | 15 | 174 | 10373 | 70.26 | 684 | 669 | 138.1 |
| B | 15 | 204 | 31653 | 237.67 | 694 | 678 | 130.3 |
| B | 4 | 81 | 12772 | 92.8 | 694 | 678 | 130.3 |
| B | 12 | 111 | 12220 | 88.56 | 694 | 678 | 130.3 |
| C | 9 | 16 | 10064 | 59.99 | 679 | 681 | 156.4 |
| C | 8 | 79 | 6985 | 40.31 | 679 | 681 | 156.4 |
| C | 13 | 61 | 5426 | 30.34 | 679 | 681 | 156.4 |
| D | 11 | 241 | 45465 | 268.3 | 678 | 658 | 167.0 |
| D | 2 | 206 | 42129 | 248.32 | 678 | 658 | 167.0 |
| D | 8 | 195 | 15618 | 89.58 | 678 | 658 | 167.0 |
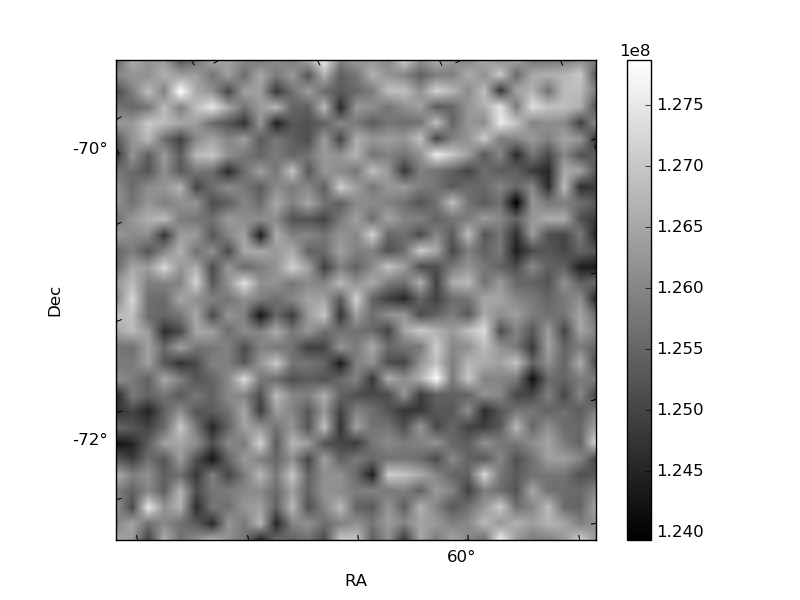
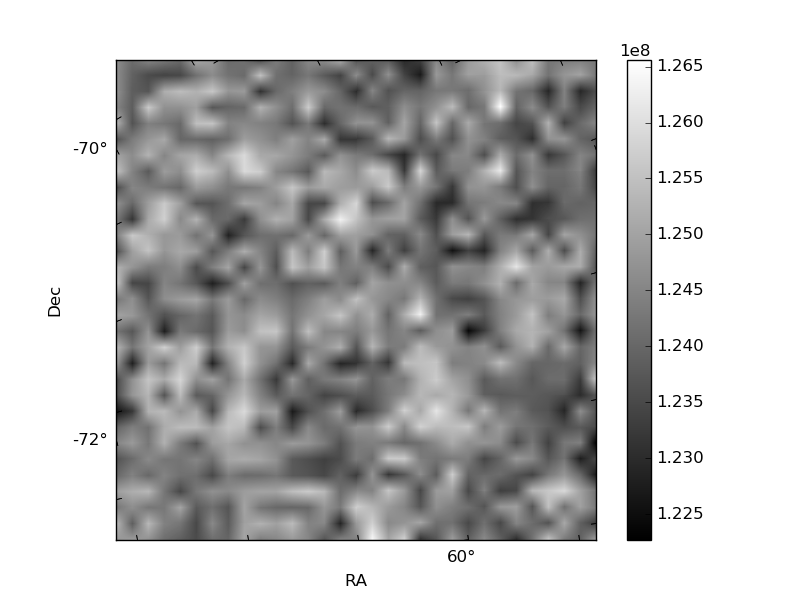
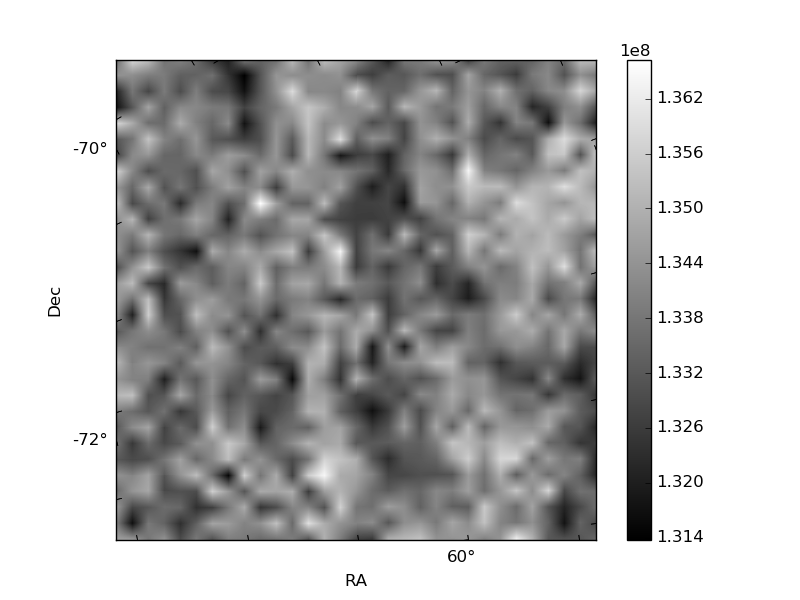
Histogram calculated using DETX and DETY for each event in the final _common_clean file
| Quadrant A | 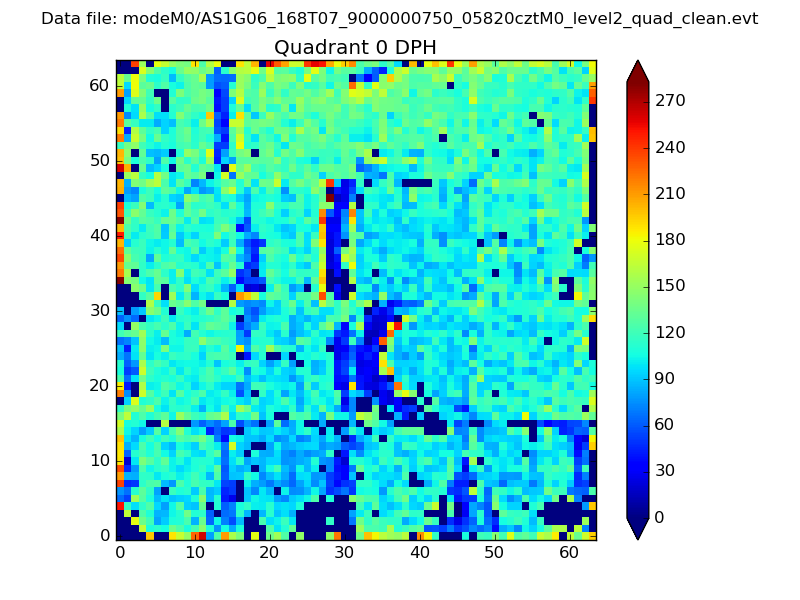 |
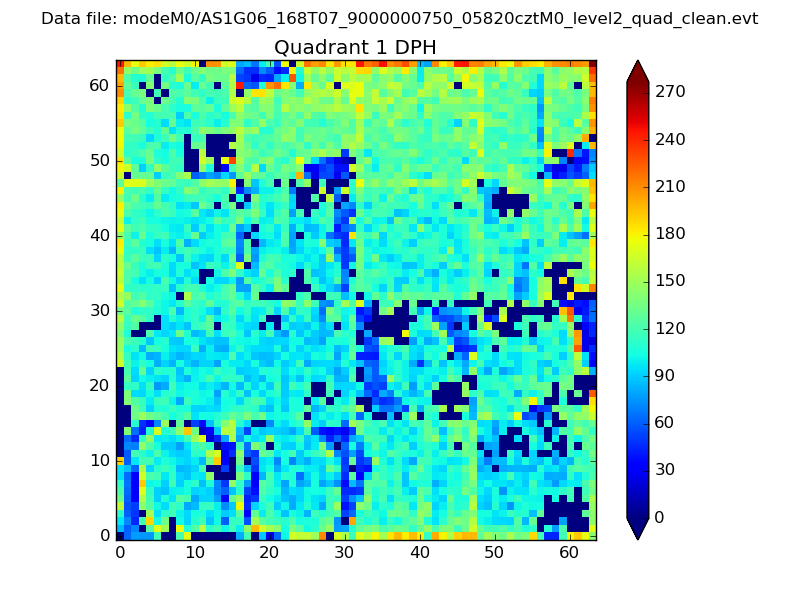 |
Quadrant B |
|---|---|---|---|
| Quadrant D | 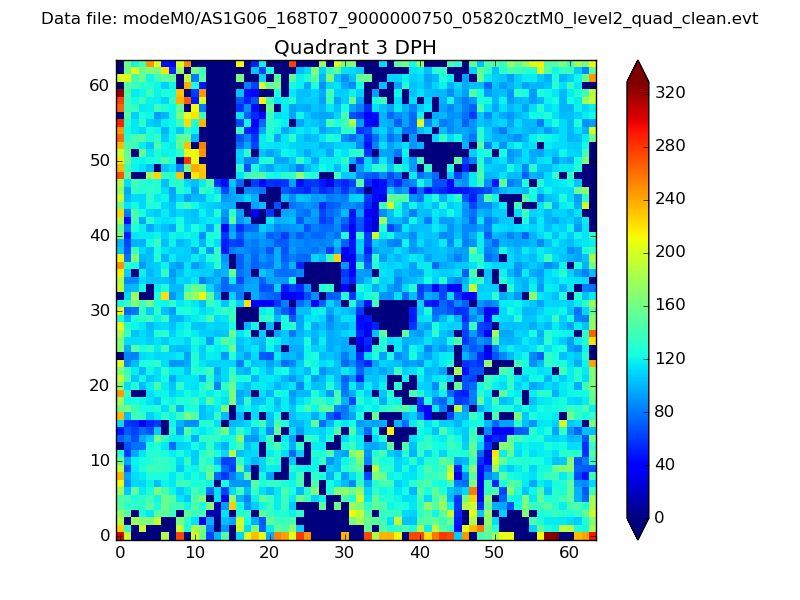 |
 |
Quadrant C |
| Plot type | Count rate plots | Images |
|---|---|---|
| Comparison with Poisson distribution Blue bars denote a histogram of data divided into 1 sec bins. Red curve is a Poisson curve with rate = median count rate of data. |
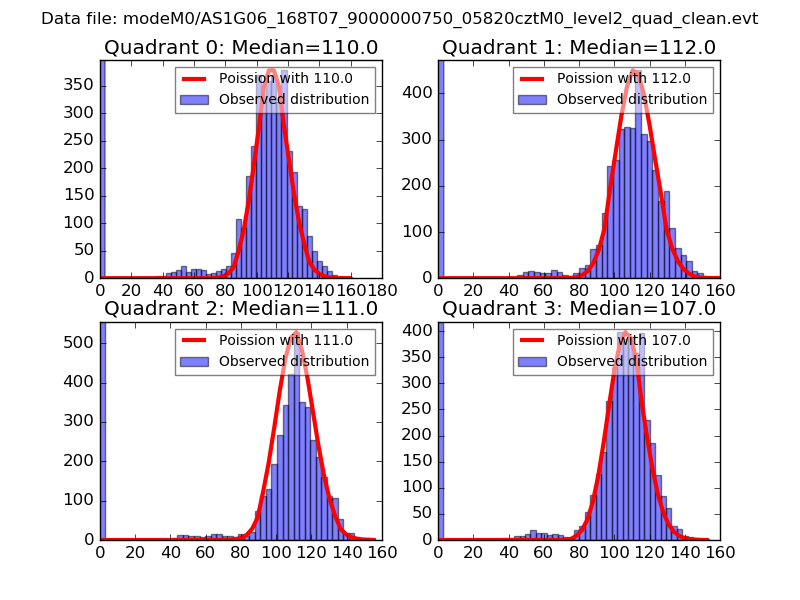 |
 |
| Quadrant-wise count rates Data is divided into 100 sec bins |
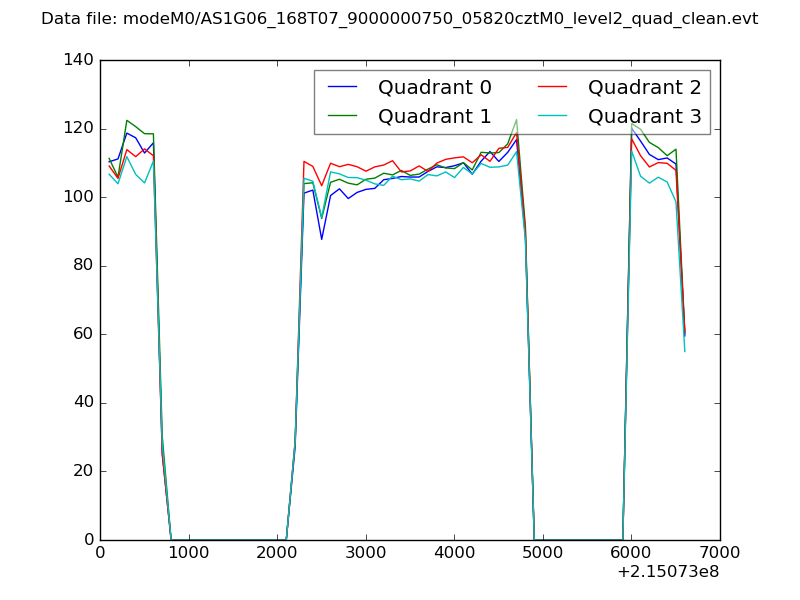 |
|
| Module-wise count rates for Quadrant A Data is divided into 100 sec bins |
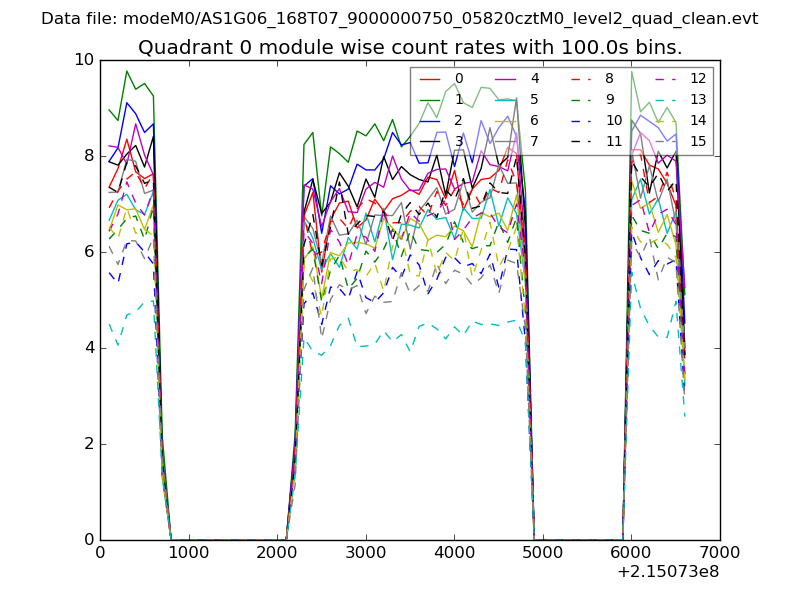 |
 |
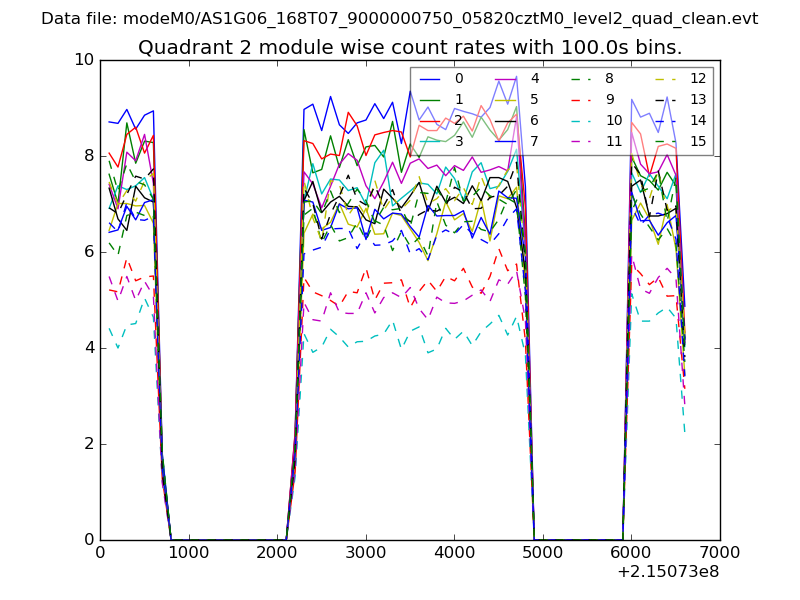
| Module-wise count rates for Quadrant B Data is divided into 100 sec bins |
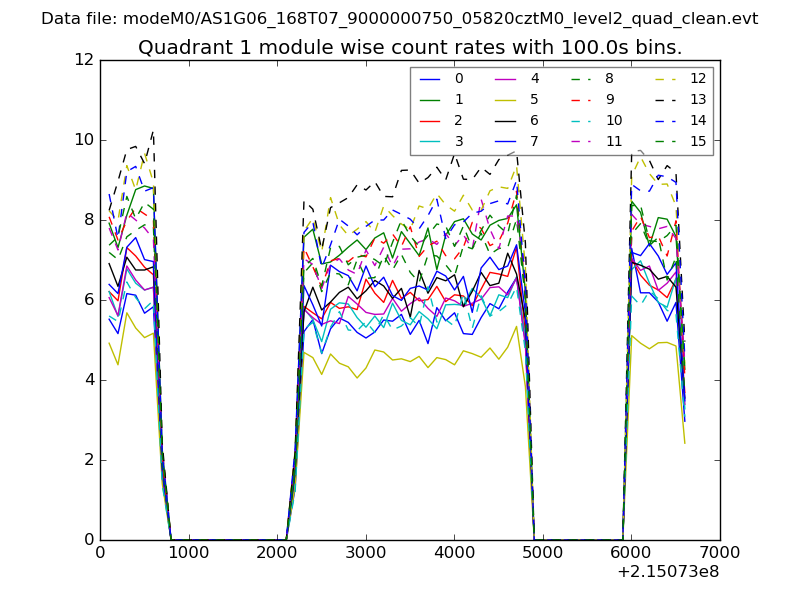 |
 |
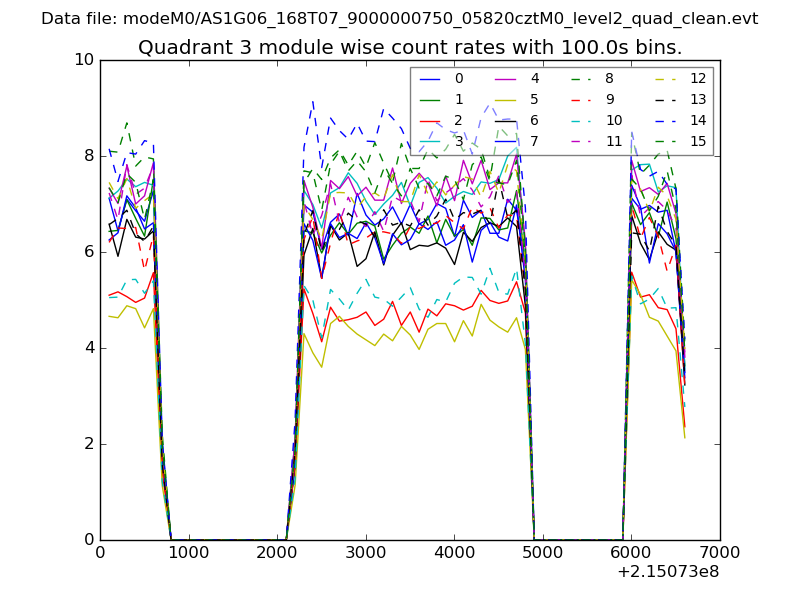
| Module-wise count rates for Quadrant C Data is divided into 100 sec bins |
 |
 |
| Module-wise count rates for Quadrant D Data is divided into 100 sec bins |
 |
 |
| Parameter | Plot |
|---|---|
| CZT HV Monitor | 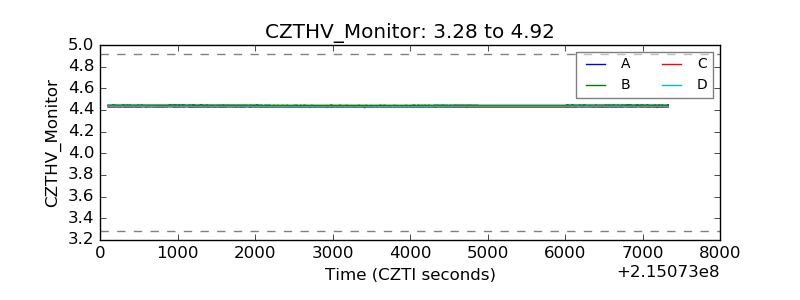 |
| D_VDD | 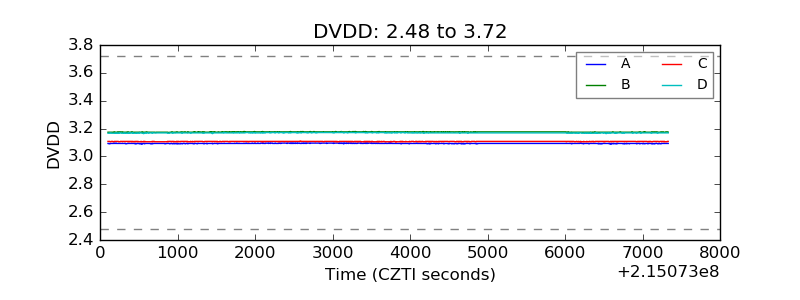 |
| Temperature 1 | 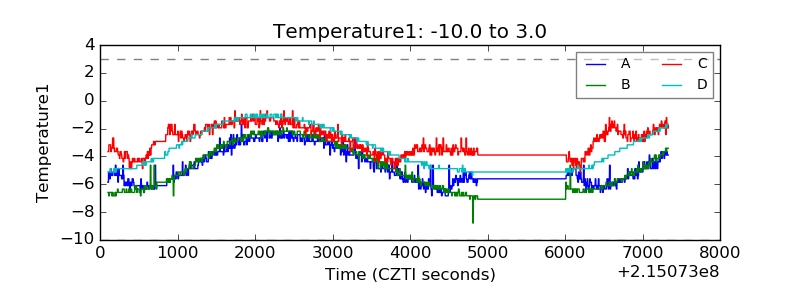 |
| Veto HV Monitor |  |
| Veto LLD | 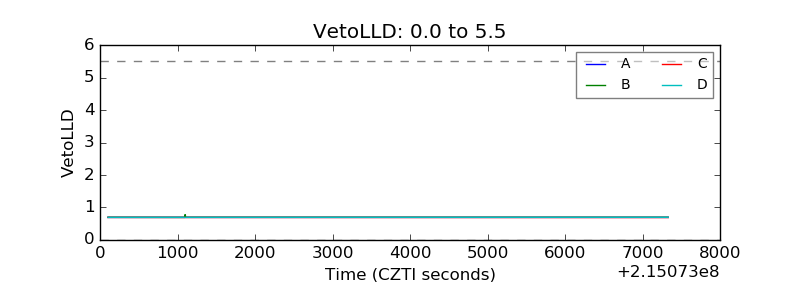 |
| Alpha Counter | 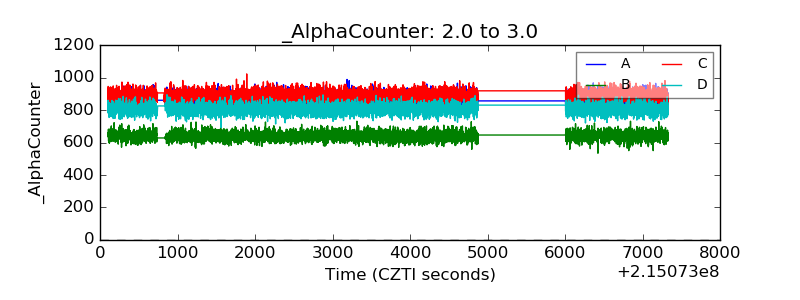 |
| _CPM_Rate | 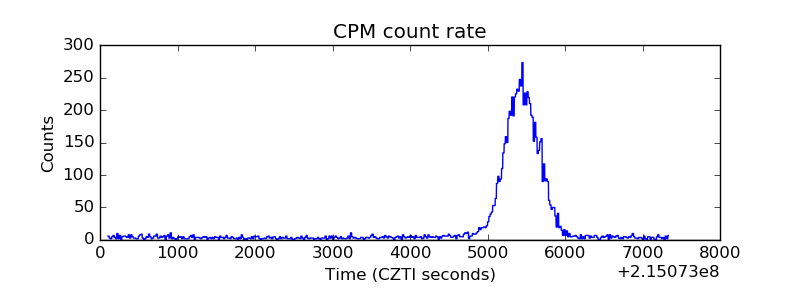 |
| CZT Counter |  |
| +2.5 Volts monitor |  |
| +5 Volts monitor |  |
| _ROLL_ROT | 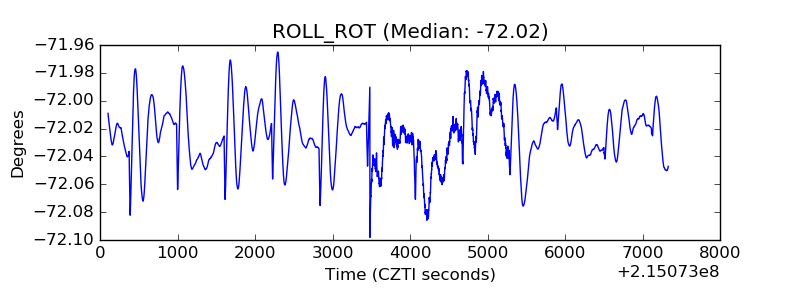 |
| _Roll_DEC | 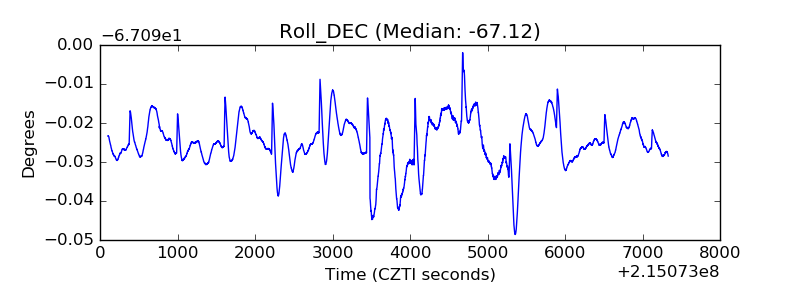 |
| _Roll_RA |  |
| Veto Counter | 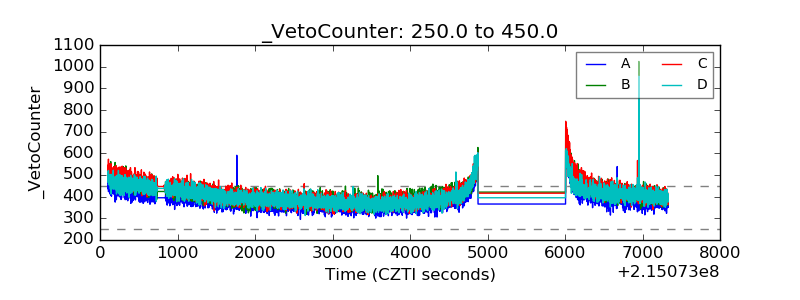 |