| Param | Original file | Final file |
|---|---|---|
| Filename | modeM0/AS1G06_168T07_9000000750_05821cztM0_level2.evt | modeM0/AS1G06_168T07_9000000750_05821cztM0_level2_quad_clean.evt |
| Size (bytes) | 549,938,880 | 98,599,680 |
| Size | 524.5 MB | 94.0 MB |
| Events in quadrant A | 4,727,776 | 594,013 |
| Events in quadrant B | 3,858,862 | 602,856 |
| Events in quadrant C | 3,694,938 | 610,870 |
| Events in quadrant D | 3,797,057 | 588,616 |
| Mode M9 | |||
|---|---|---|---|
| Quadrant | BADHDUFLAG | Total packets | Discarded packets |
| A | 0 | 12 | 0 |
| B | 0 | 12 | 0 |
| C | 0 | 12 | 0 |
| D | 0 | 12 | 0 |
| Mode SS | |||
|---|---|---|---|
| Quadrant | BADHDUFLAG | Total packets | Discarded packets |
| A | 0 | 172 | 0 |
| B | 0 | 172 | 0 |
| C | 0 | 172 | 0 |
| D | 0 | 172 | 0 |
| Mode M0 | |||
|---|---|---|---|
| Quadrant | BADHDUFLAG | Total packets | Discarded packets |
| A | 0 | 19749 | 1 |
| B | 0 | 17234 | 1 |
| C | 0 | 17149 | 1 |
| D | 0 | 17570 | 1 |
| Quadrant | Total seconds | Saturated seconds | Saturation percentage |
|---|---|---|---|
| A | 8488 | 71 | 0.836475% |
| B | 8488 | 51 | 0.600848% |
| C | 8488 | 39 | 0.459472% |
| D | 8488 | 51 | 0.600848% |
Noise dominated data is calculated using 1-second bins in cleaned event files. If a bin has >2000 counts, and if more than 50% of those come from <1% of pixels, then it is considered to be noise-dominated and hence unusable.
| Quadrant | # 1 sec bins | Bins with >0 counts | Bins with >2000 counts | High rate bins dominated by noise | Noise dominated (total time) | Noise dominated (detector-on time) | Marked lightcurve |
|---|---|---|---|---|---|---|---|
| A | 9618 | 8489 | 17 | 17 | 0.18% | 0.20% | 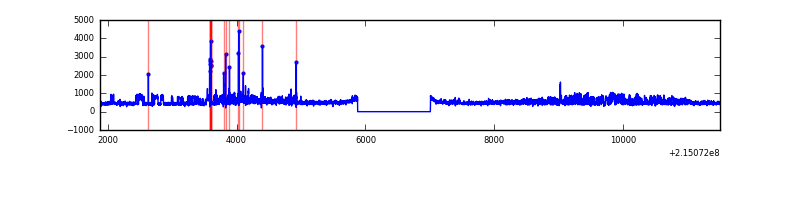 |
| B | 9618 | 8489 | 1 | 1 | 0.01% | 0.01% | 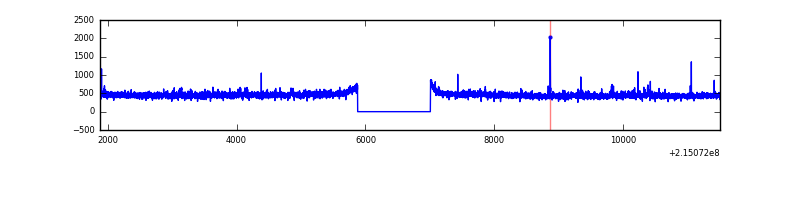 |
| C | 9618 | 8489 | 0 | 0 | 0.00% | 0.00% | 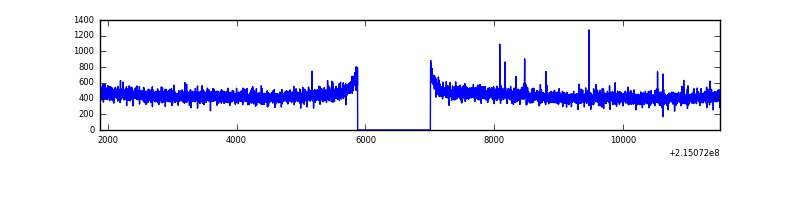 |
| D | 9618 | 8489 | 16 | 16 | 0.17% | 0.19% | 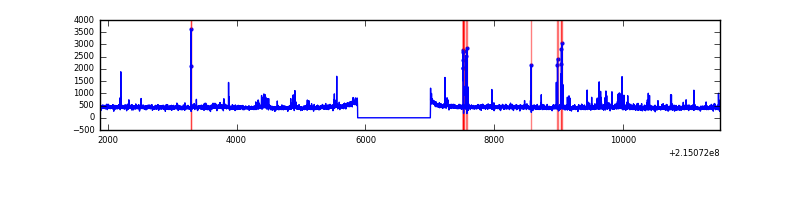 |
Top three noisy pixels from each quadrant. If the there are fewer than three noisy pixels in the level2.evt file, extra rows are filled as -1
| Pixel properties | Quadrant properties | ||||||
|---|---|---|---|---|---|---|---|
| Quadrant | DetID | PixID | Counts | Sigma | Mean | Median | Sigma |
| A | 15 | 236 | 917192 | 4712.32 | 959 | 936 | 194.4 |
| A | 15 | 223 | 103051 | 525.18 | 959 | 936 | 194.4 |
| A | 15 | 174 | 10835 | 50.91 | 959 | 936 | 194.4 |
| B | 15 | 204 | 66227 | 355.63 | 971 | 947 | 183.6 |
| B | 12 | 111 | 16899 | 86.9 | 971 | 947 | 183.6 |
| B | 4 | 81 | 16678 | 85.7 | 971 | 947 | 183.6 |
| C | 9 | 16 | 13989 | 60.59 | 941 | 945 | 215.3 |
| C | 13 | 61 | 7534 | 30.6 | 941 | 945 | 215.3 |
| C | 8 | 222 | 3114 | 10.07 | 941 | 945 | 215.3 |
| D | 1 | 239 | 48841 | 208.46 | 942 | 916 | 229.9 |
| D | 2 | 206 | 46889 | 199.97 | 942 | 916 | 229.9 |
| D | 11 | 241 | 46075 | 196.43 | 942 | 916 | 229.9 |
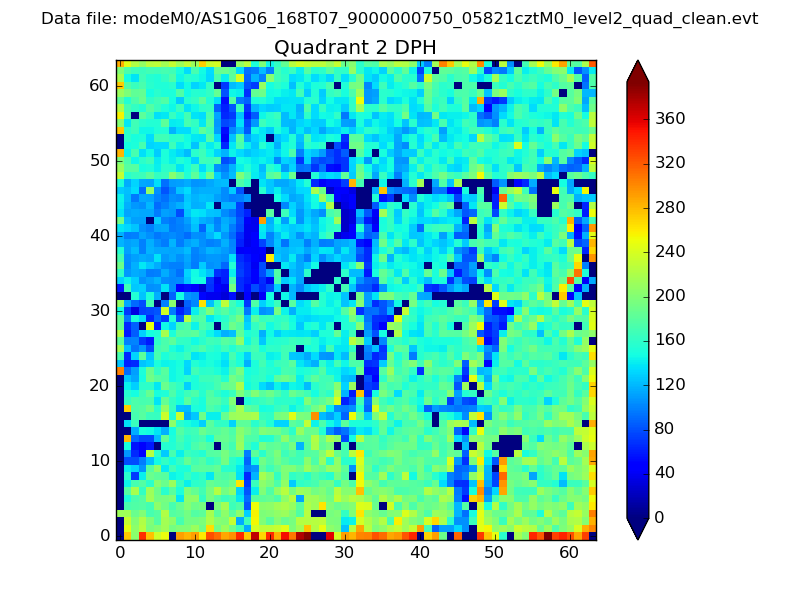
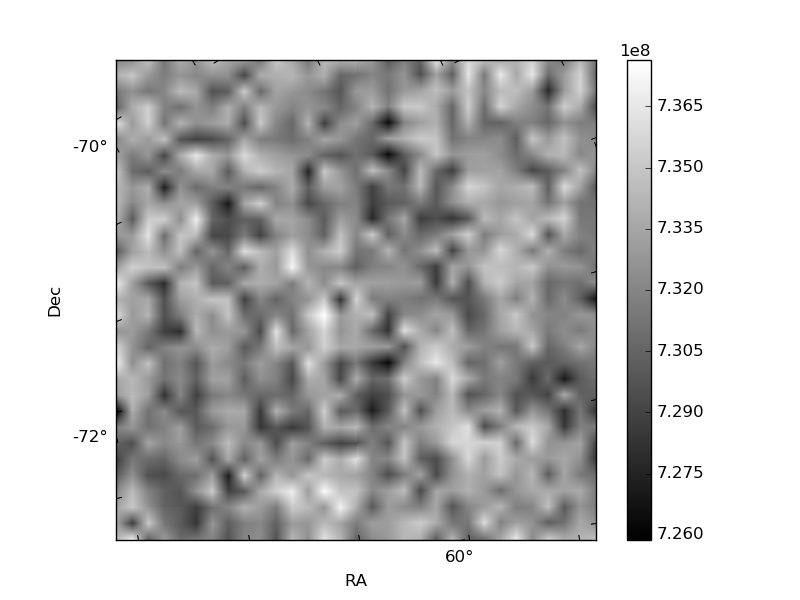
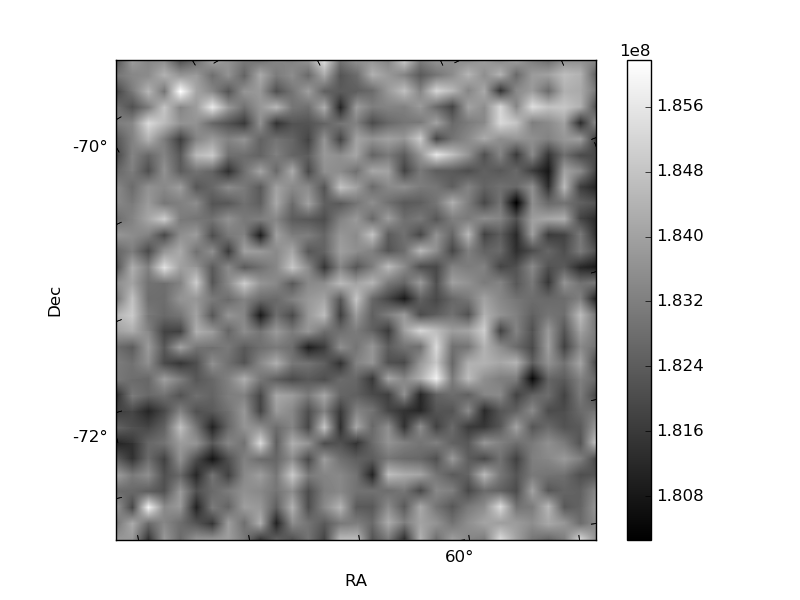
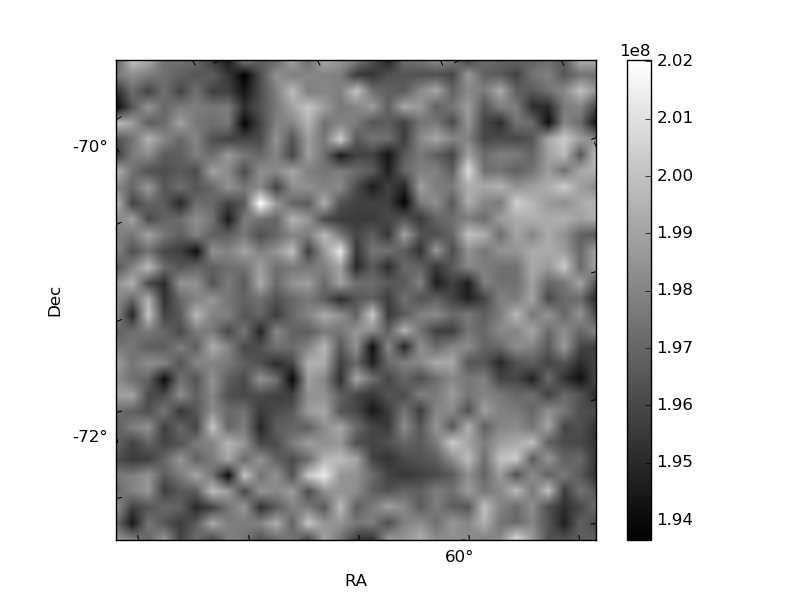
Histogram calculated using DETX and DETY for each event in the final _common_clean file
| Quadrant A | 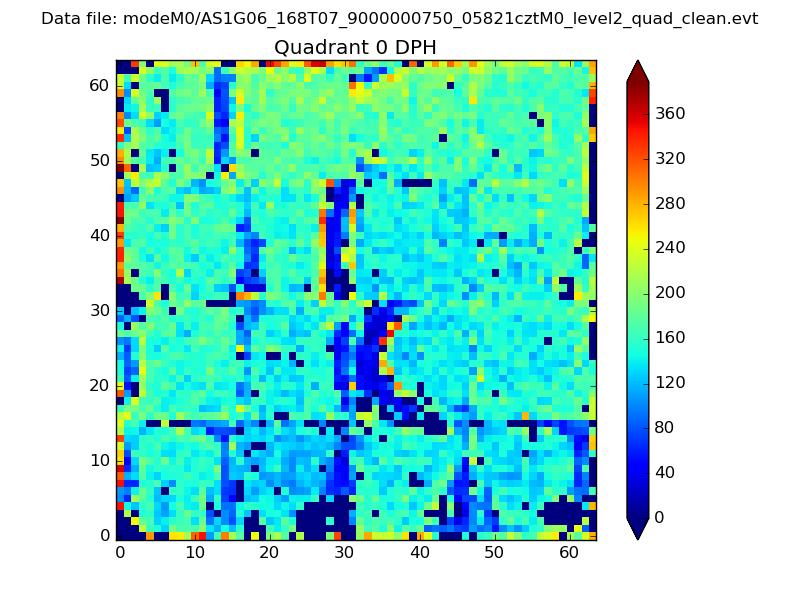 |
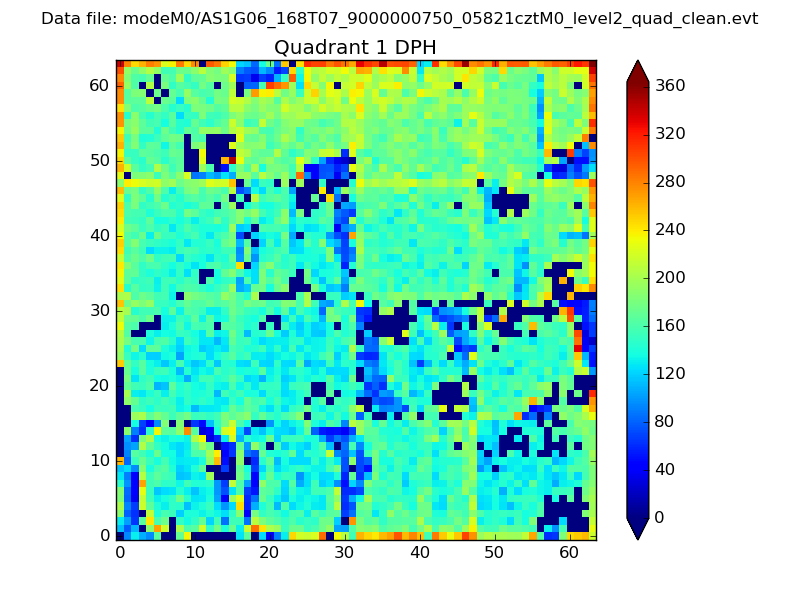 |
Quadrant B |
|---|---|---|---|
| Quadrant D | 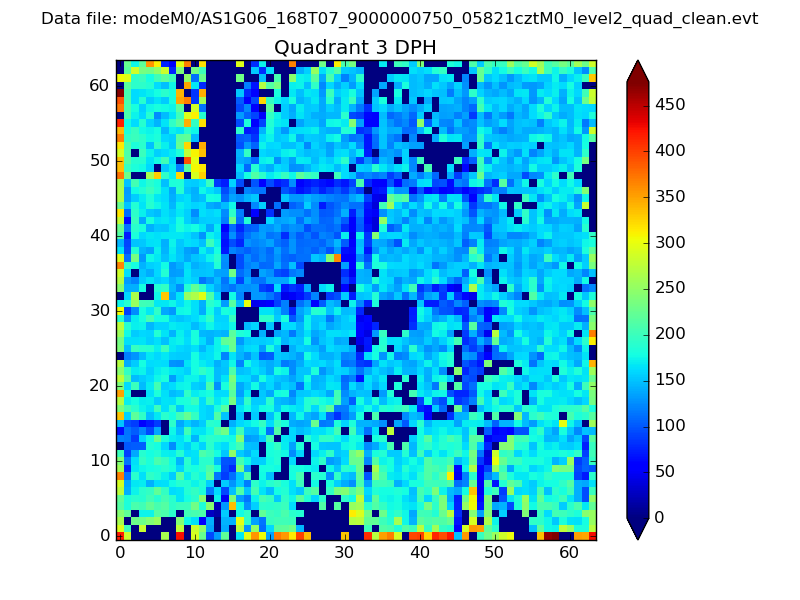 |
 |
Quadrant C |
| Plot type | Count rate plots | Images |
|---|---|---|
| Comparison with Poisson distribution Blue bars denote a histogram of data divided into 1 sec bins. Red curve is a Poisson curve with rate = median count rate of data. |
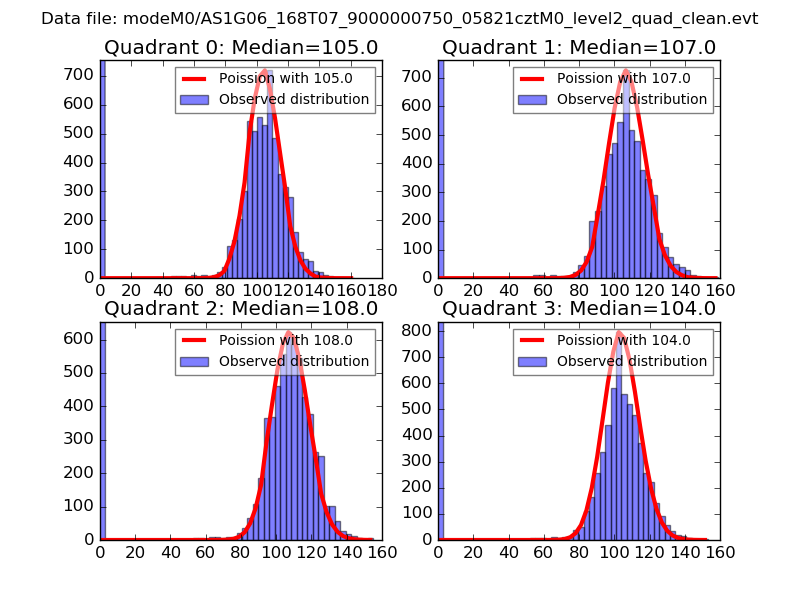 |
 |
| Quadrant-wise count rates Data is divided into 100 sec bins |
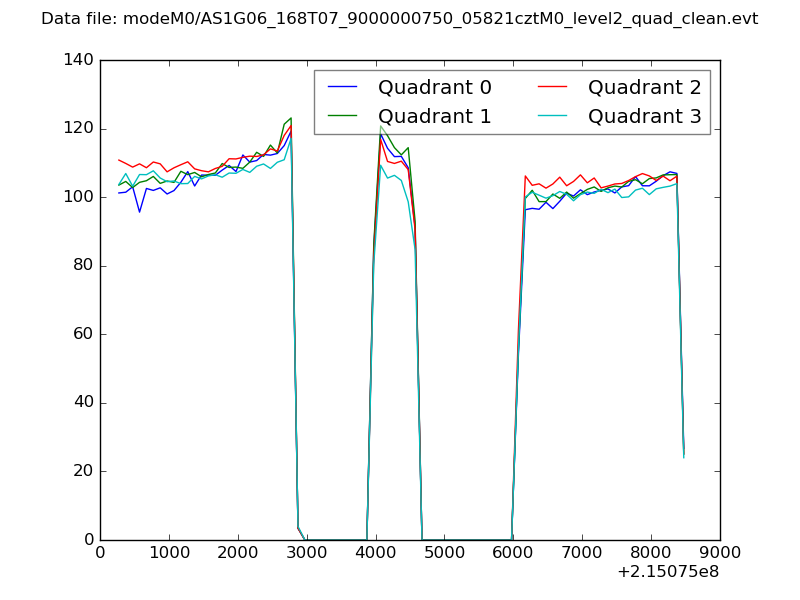 |
|
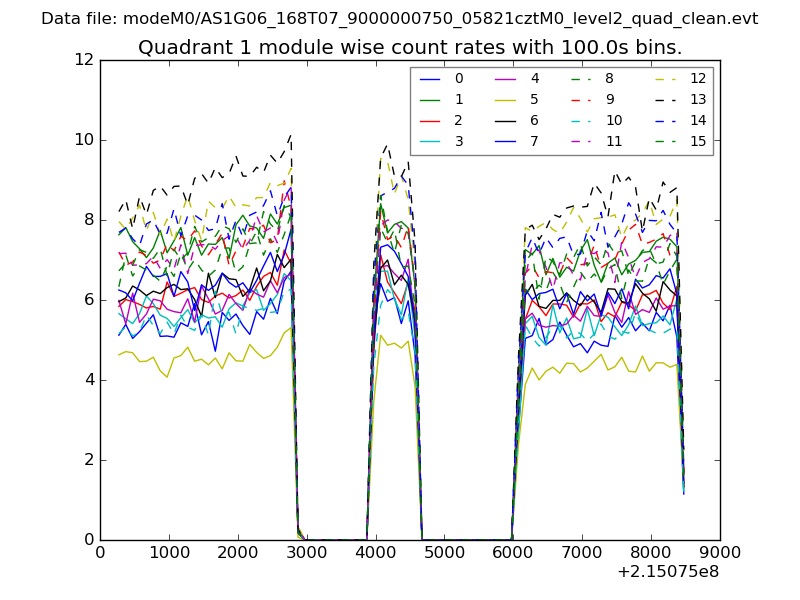
| Module-wise count rates for Quadrant A Data is divided into 100 sec bins |
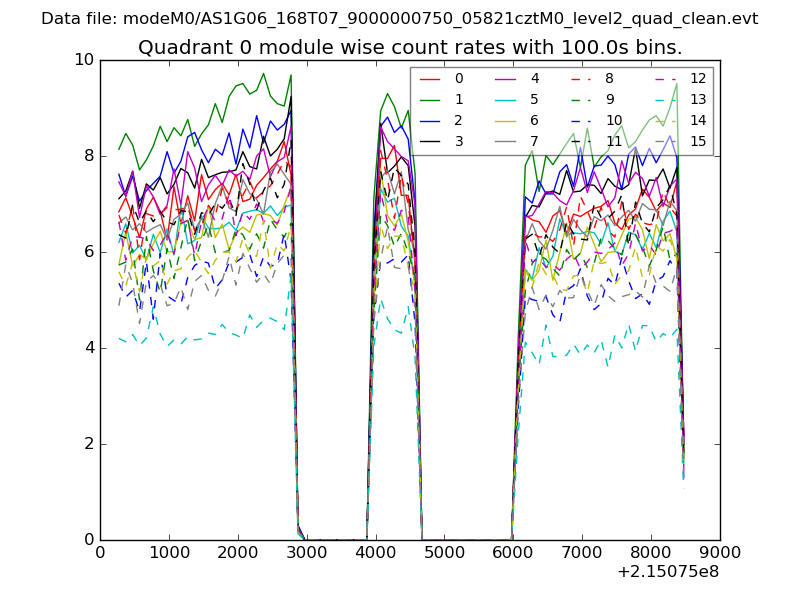 |
 |
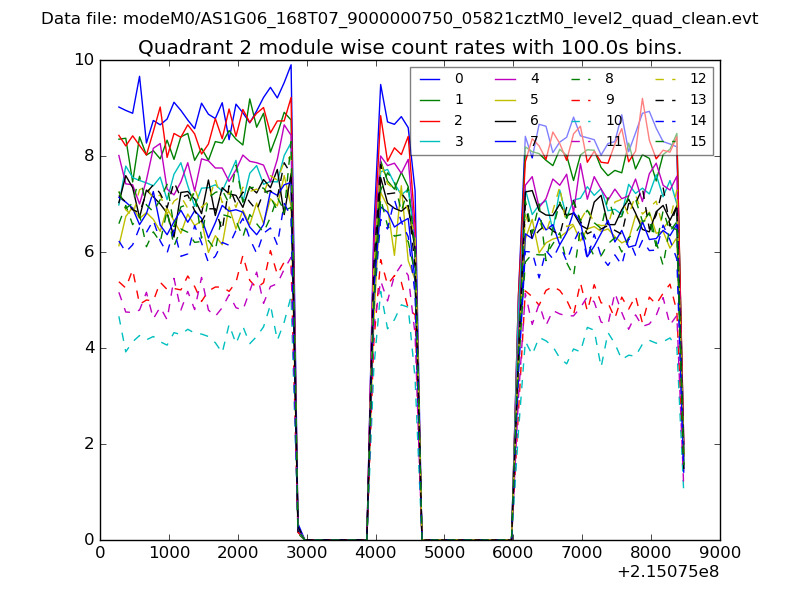
| Module-wise count rates for Quadrant B Data is divided into 100 sec bins |
 |
 |
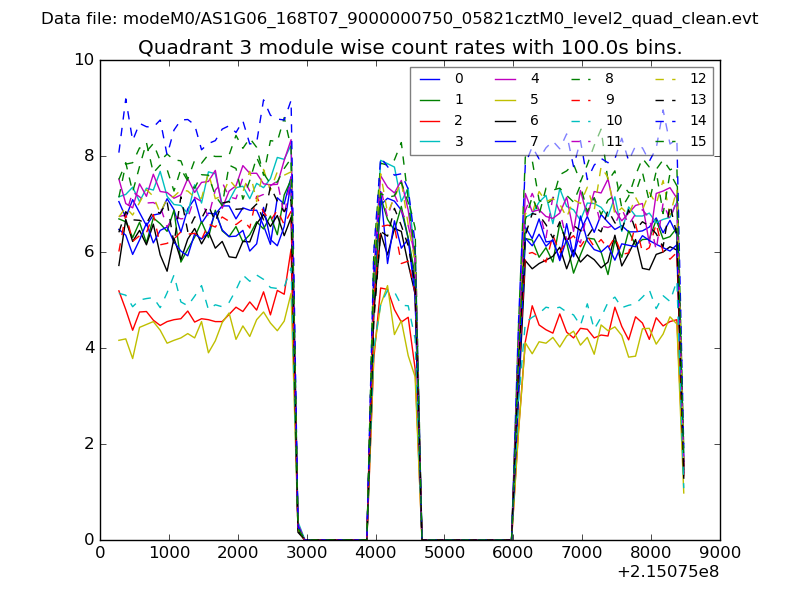
| Module-wise count rates for Quadrant C Data is divided into 100 sec bins |
 |
 |
| Module-wise count rates for Quadrant D Data is divided into 100 sec bins |
 |
 |
| Parameter | Plot |
|---|---|
| CZT HV Monitor | 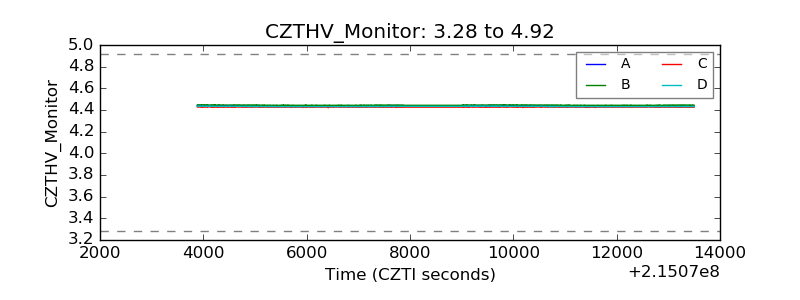 |
| D_VDD | 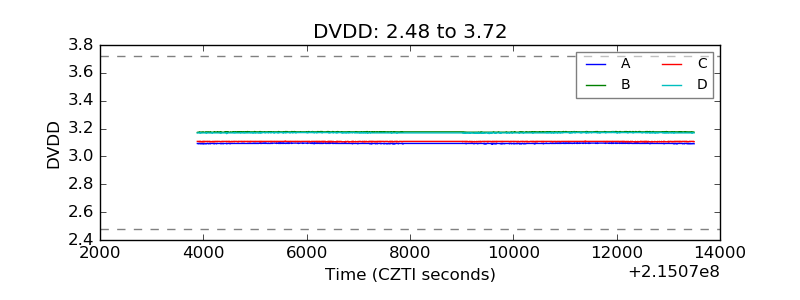 |
| Temperature 1 | 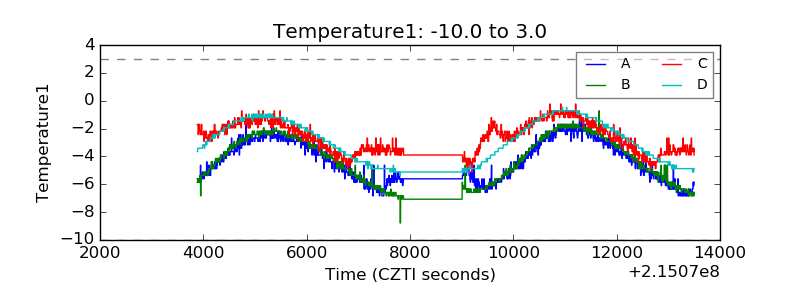 |
| Veto HV Monitor | 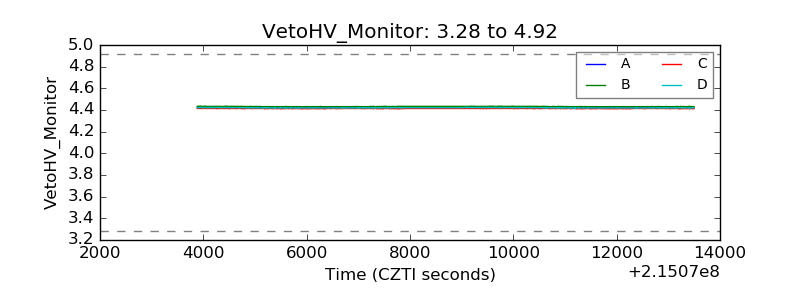 |
| Veto LLD | 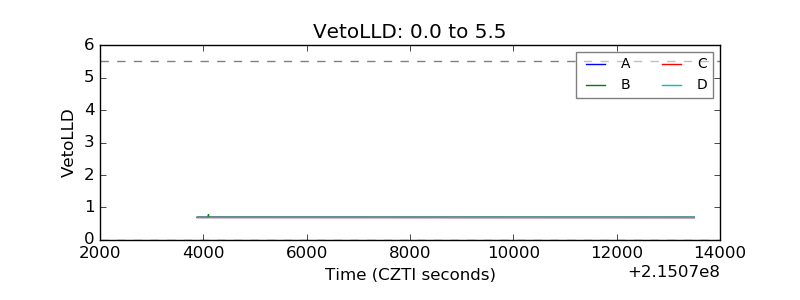 |
| Alpha Counter | 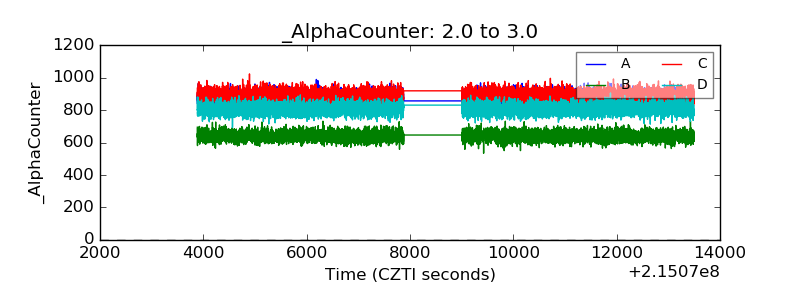 |
| _CPM_Rate | 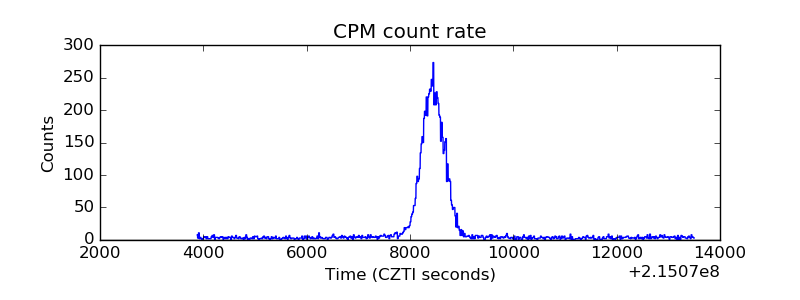 |
| CZT Counter | 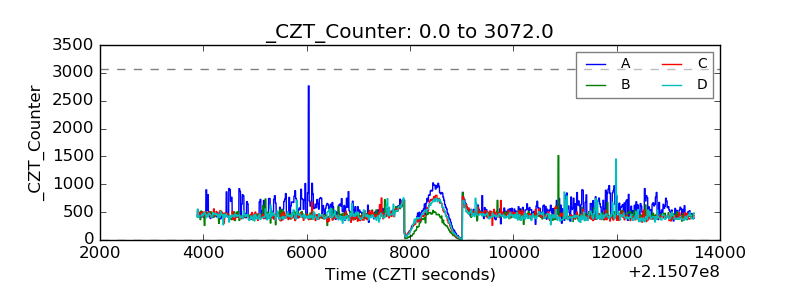 |
| +2.5 Volts monitor |  |
| +5 Volts monitor |  |
| _ROLL_ROT | 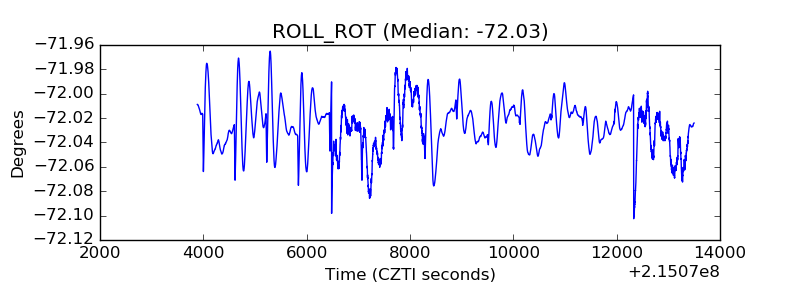 |
| _Roll_DEC | 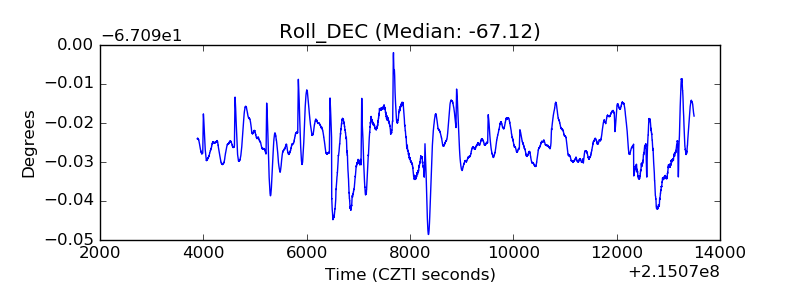 |
| _Roll_RA | 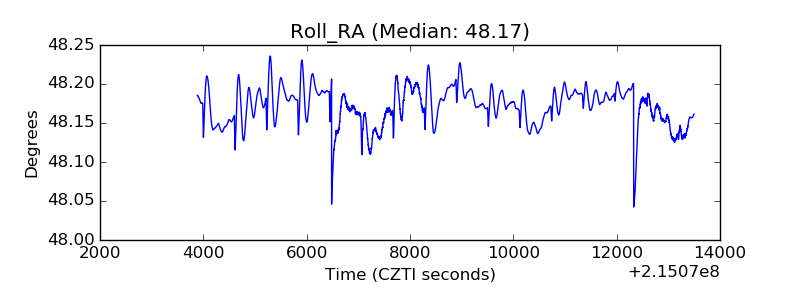 |
| Veto Counter | 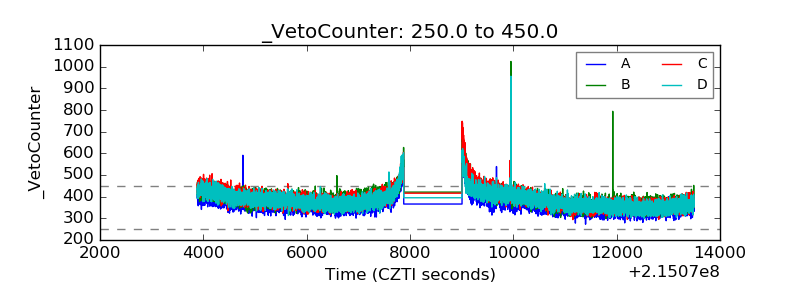 |