| Param | Original file | Final file |
|---|---|---|
| Filename | modeM0/AS1A02_197T05_9000000756cztM0_level2.fits | modeM0/AS1A02_197T05_9000000756cztM0_level2_quad_clean.evt |
| Size (bytes) | 139,400,640 | 143,651,520 |
| Size | 132.9 MB | 137.0 MB |
| Events in quadrant A | 826,574 | 848,434 |
| Events in quadrant B | 802,144 | 854,519 |
| Events in quadrant C | 811,466 | 816,967 |
| Events in quadrant D | 699,372 | 748,315 |
| Mode M0 | |||
|---|---|---|---|
| Quadrant | BADHDUFLAG | Total packets | Discarded packets |
| A | 0 | 33084 | 0 |
| B | 0 | 33052 | 0 |
| C | 0 | 32396 | 0 |
| D | 0 | 33885 | 0 |
| Mode M9 | |||
|---|---|---|---|
| Quadrant | BADHDUFLAG | Total packets | Discarded packets |
| A | 0 | 11 | 0 |
| B | 0 | 11 | 0 |
| C | 0 | 11 | 0 |
| D | 0 | 11 | 0 |
| Mode SS | |||
|---|---|---|---|
| Quadrant | BADHDUFLAG | Total packets | Discarded packets |
| A | 0 | 316 | 0 |
| B | 0 | 320 | 0 |
| C | 0 | 321 | 0 |
| D | 0 | 310 | 0 |
| Quadrant | Total seconds | Saturated seconds | Saturation percentage |
|---|---|---|---|
| A | 15696 | 243 | 1.548165% |
| B | 15713 | 199 | 1.266467% |
| C | 15673 | 151 | 0.963440% |
| D | 15665 | 215 | 1.372486% |
Noise dominated data is calculated using 1-second bins in cleaned event files. If a bin has >2000 counts, and if more than 50% of those come from <1% of pixels, then it is considered to be noise-dominated and hence unusable.
| Quadrant | # 1 sec bins | Bins with >0 counts | Bins with >2000 counts | High rate bins dominated by noise | Noise dominated (total time) | Noise dominated (detector-on time) | Marked lightcurve |
|---|---|---|---|---|---|---|---|
| A | 17107 | 16003 | 0 | 0 | 0.00% | 0.00% |  |
| B | 17107 | 15983 | 0 | 0 | 0.00% | 0.00% | 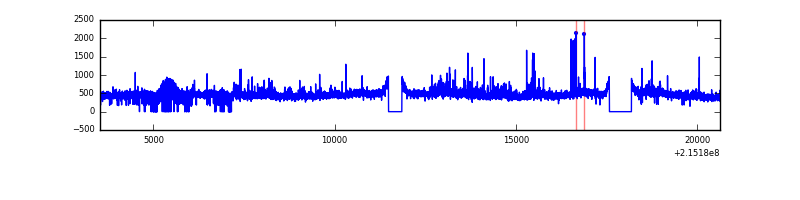 |
| C | 17107 | 15989 | 0 | 0 | 0.00% | 0.00% |  |
| D | 17107 | 15968 | 0 | 0 | 0.00% | 0.00% |  |
Top three noisy pixels from each quadrant. If the there are fewer than three noisy pixels in the level2.evt file, extra rows are filled as -1
| Pixel properties | Quadrant properties | ||||||
|---|---|---|---|---|---|---|---|
| Quadrant | DetID | PixID | Counts | Sigma | Mean | Median | Sigma |
| A | 0 | 29 | 841 | 11.36 | 214 | 199 | 56.5 |
| A | 14 | 188 | 822 | 11.03 | 214 | 199 | 56.5 |
| A | 14 | 204 | 724 | 9.29 | 214 | 199 | 56.5 |
| B | 2 | 9 | 673 | 10.45 | 211 | 200 | 45.3 |
| B | 14 | 254 | 557 | 7.89 | 211 | 200 | 45.3 |
| B | 3 | 17 | 535 | 7.4 | 211 | 200 | 45.3 |
| C | 12 | 241 | 611 | 6.98 | 214 | 198 | 59.2 |
| C | 1 | 80 | 589 | 6.61 | 214 | 198 | 59.2 |
| C | 1 | 81 | 562 | 6.15 | 214 | 198 | 59.2 |
| D | 11 | 82 | 528 | 6.18 | 199 | 180 | 56.3 |
| D | 7 | 5 | 524 | 6.11 | 199 | 180 | 56.3 |
| D | 3 | 14 | 519 | 6.02 | 199 | 180 | 56.3 |
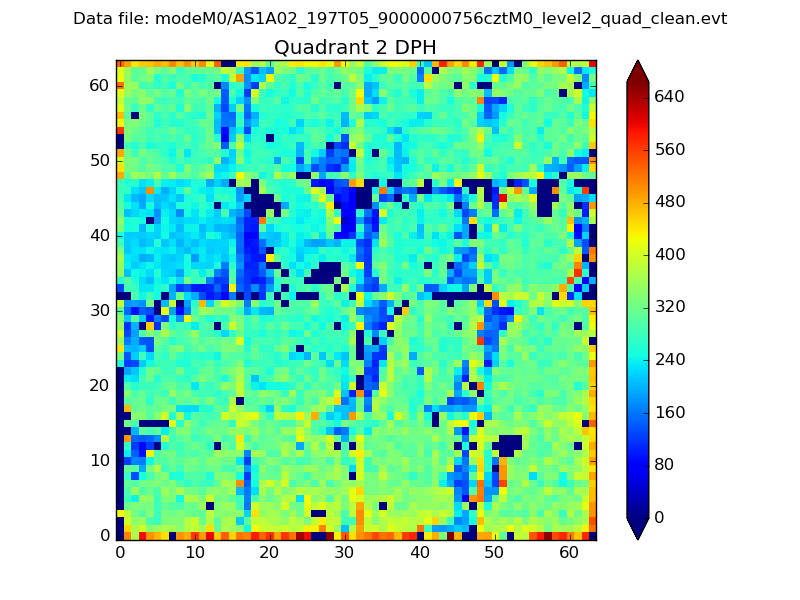
Histogram calculated using DETX and DETY for each event in the final _common_clean file
| Quadrant A | 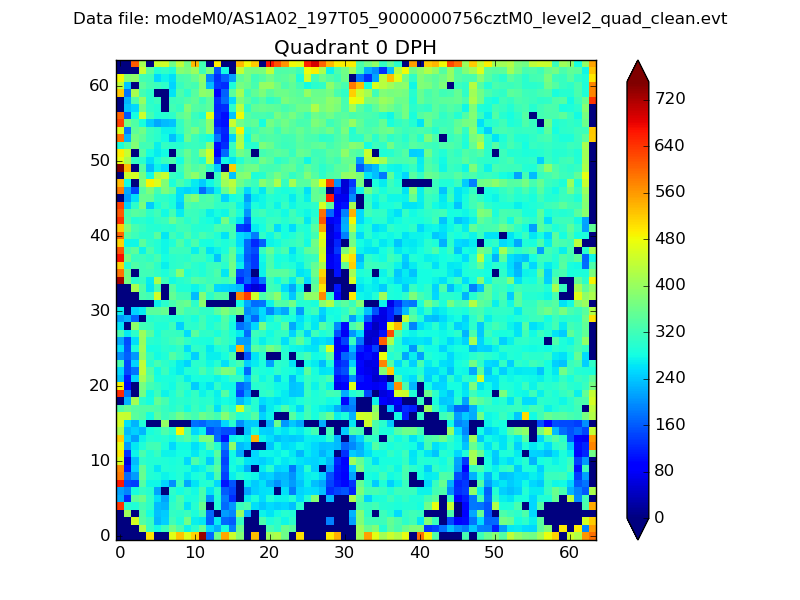 |
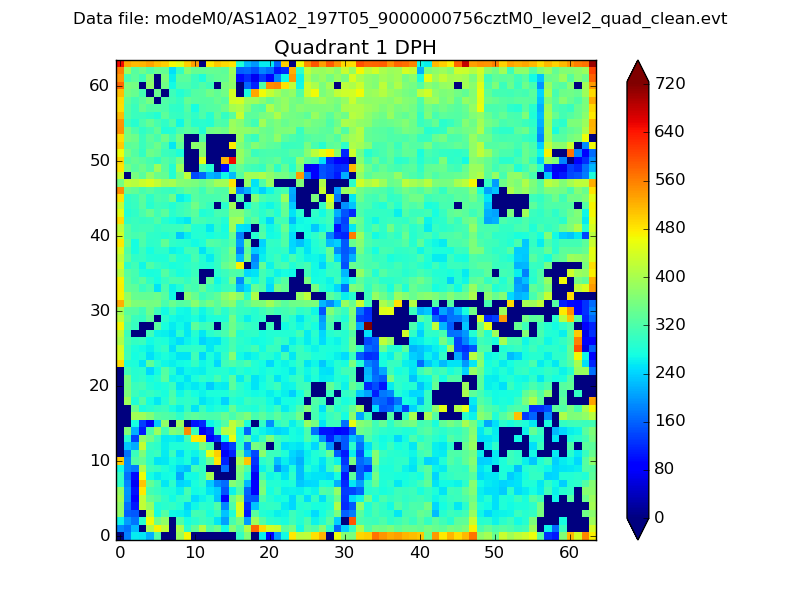 |
Quadrant B |
|---|---|---|---|
| Quadrant D | 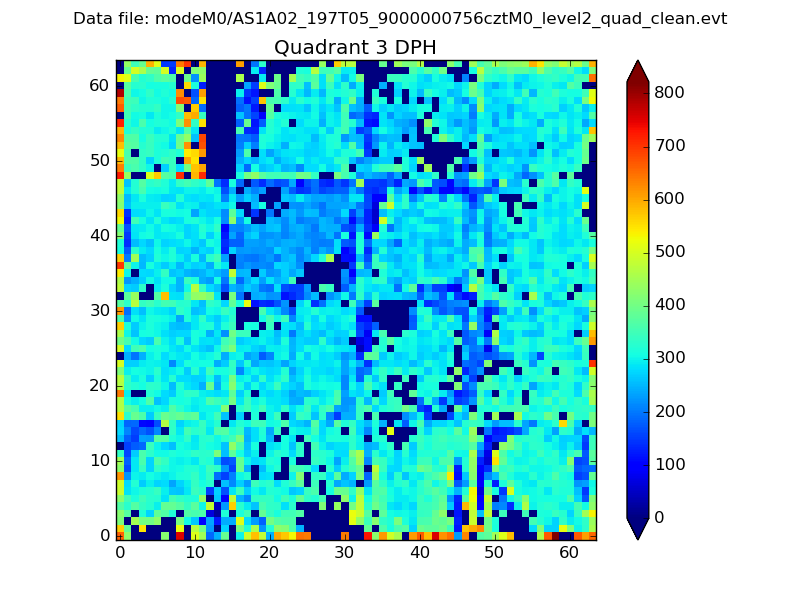 |
 |
Quadrant C |
| Plot type | Count rate plots | Images |
|---|---|---|
| Comparison with Poisson distribution Blue bars denote a histogram of data divided into 1 sec bins. Red curve is a Poisson curve with rate = median count rate of data. |
 |
 |
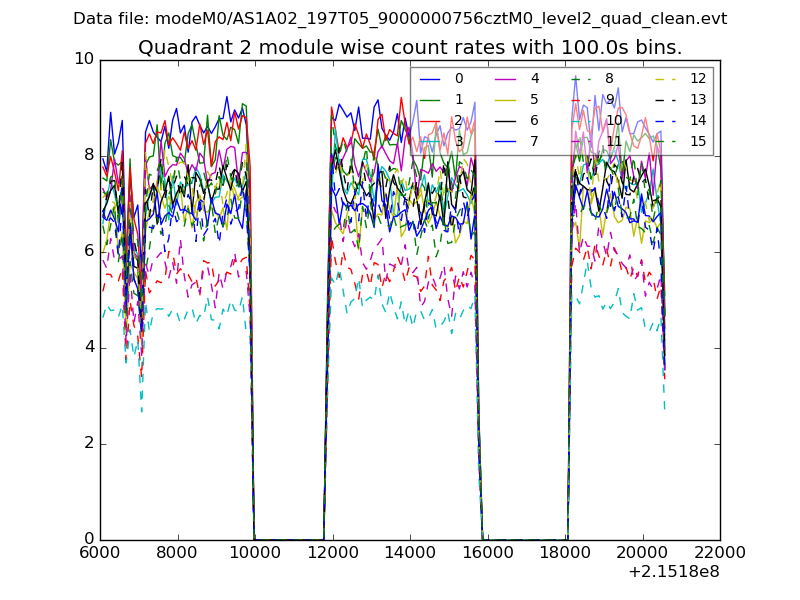
| Quadrant-wise count rates Data is divided into 100 sec bins |
 |
|
| Module-wise count rates for Quadrant A Data is divided into 100 sec bins |
 |
 |
| Module-wise count rates for Quadrant B Data is divided into 100 sec bins |
 |
 |
| Module-wise count rates for Quadrant C Data is divided into 100 sec bins |
 |
 |
| Module-wise count rates for Quadrant D Data is divided into 100 sec bins |
 |
 |
| Parameter | Plot |
|---|---|
| CZT HV Monitor |  |
| D_VDD |  |
| Temperature 1 |  |
| Veto HV Monitor |  |
| Veto LLD |  |
| Alpha Counter |  |
| _CPM_Rate |  |
| CZT Counter |  |
| +2.5 Volts monitor |  |
| +5 Volts monitor | 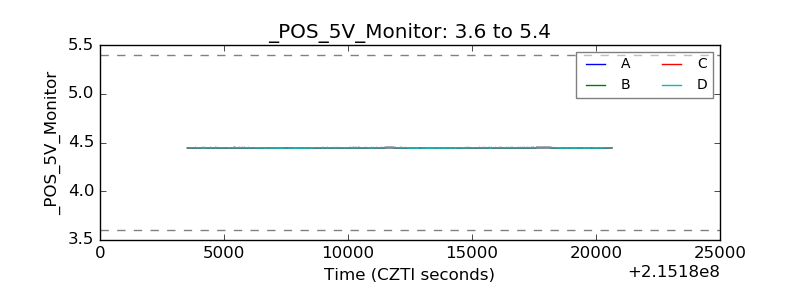 |
| _ROLL_ROT |  |
| _Roll_DEC | 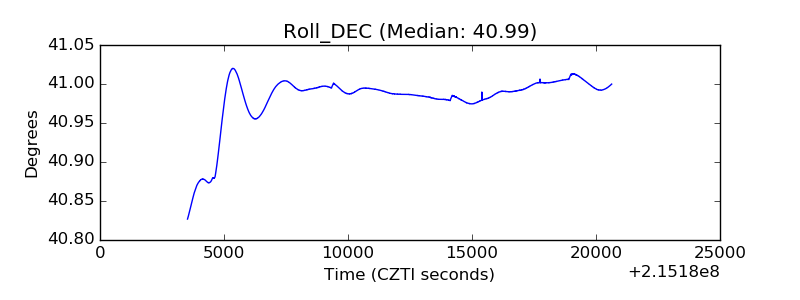 |
| _Roll_RA |  |
| Veto Counter |  |