| Param | Original file | Final file |
|---|---|---|
| Filename | modeM0/AS1G06_039T01_9000000758cztM0_level2.fits | modeM0/AS1G06_039T01_9000000758cztM0_level2_quad_clean.evt |
| Size (bytes) | 654,756,480 | 947,816,640 |
| Size | 624.4 MB | 903.9 MB |
| Events in quadrant A | 3,912,318 | 6,247,759 |
| Events in quadrant B | 3,813,986 | 6,233,951 |
| Events in quadrant C | 3,853,904 | 5,950,440 |
| Events in quadrant D | 3,227,908 | 5,257,276 |
| Mode M0 | |||
|---|---|---|---|
| Quadrant | BADHDUFLAG | Total packets | Discarded packets |
| A | 0 | 149831 | 0 |
| B | 0 | 151602 | 0 |
| C | 0 | 151408 | 0 |
| D | 0 | 180269 | 0 |
| Mode SS | |||
|---|---|---|---|
| Quadrant | BADHDUFLAG | Total packets | Discarded packets |
| A | 0 | 1496 | 0 |
| B | 0 | 1496 | 0 |
| C | 0 | 1494 | 0 |
| D | 0 | 1500 | 0 |
| Mode M9 | |||
|---|---|---|---|
| Quadrant | BADHDUFLAG | Total packets | Discarded packets |
| A | 0 | 103 | 0 |
| B | 0 | 103 | 0 |
| C | 0 | 103 | 0 |
| D | 0 | 103 | 0 |
| Quadrant | Total seconds | Saturated seconds | Saturation percentage |
|---|---|---|---|
| A | 73232 | 725 | 0.990004% |
| B | 73215 | 817 | 1.115892% |
| C | 73195 | 623 | 0.851151% |
| D | 73024 | 2658 | 3.639899% |
Noise dominated data is calculated using 1-second bins in cleaned event files. If a bin has >2000 counts, and if more than 50% of those come from <1% of pixels, then it is considered to be noise-dominated and hence unusable.
| Quadrant | # 1 sec bins | Bins with >0 counts | Bins with >2000 counts | High rate bins dominated by noise | Noise dominated (total time) | Noise dominated (detector-on time) | Marked lightcurve |
|---|---|---|---|---|---|---|---|
| A | 84171 | 73643 | 0 | 0 | 0.00% | 0.00% |  |
| B | 84171 | 73651 | 0 | 0 | 0.00% | 0.00% |  |
| C | 84171 | 73639 | 0 | 0 | 0.00% | 0.00% |  |
| D | 84171 | 73424 | 0 | 0 | 0.00% | 0.00% |  |
Top three noisy pixels from each quadrant. If the there are fewer than three noisy pixels in the level2.evt file, extra rows are filled as -1
| Pixel properties | Quadrant properties | ||||||
|---|---|---|---|---|---|---|---|
| Quadrant | DetID | PixID | Counts | Sigma | Mean | Median | Sigma |
| A | 0 | 29 | 3859 | 11.06 | 1020 | 953 | 262.6 |
| A | 7 | 110 | 3340 | 9.09 | 1020 | 953 | 262.6 |
| A | 0 | 30 | 3048 | 7.98 | 1020 | 953 | 262.6 |
| B | 2 | 9 | 3337 | 11.74 | 1006 | 959 | 202.5 |
| B | 14 | 254 | 2734 | 8.76 | 1006 | 959 | 202.5 |
| B | 12 | 226 | 2641 | 8.3 | 1006 | 959 | 202.5 |
| C | 1 | 80 | 2877 | 7.24 | 1016 | 943 | 267.0 |
| C | 12 | 241 | 2849 | 7.14 | 1016 | 943 | 267.0 |
| C | 1 | 81 | 2756 | 6.79 | 1016 | 943 | 267.0 |
| D | 3 | 14 | 2464 | 6.54 | 919 | 832 | 249.3 |
| D | 11 | 82 | 2453 | 6.5 | 919 | 832 | 249.3 |
| D | 7 | 5 | 2339 | 6.04 | 919 | 832 | 249.3 |
Histogram calculated using DETX and DETY for each event in the final _common_clean file
| Quadrant A | 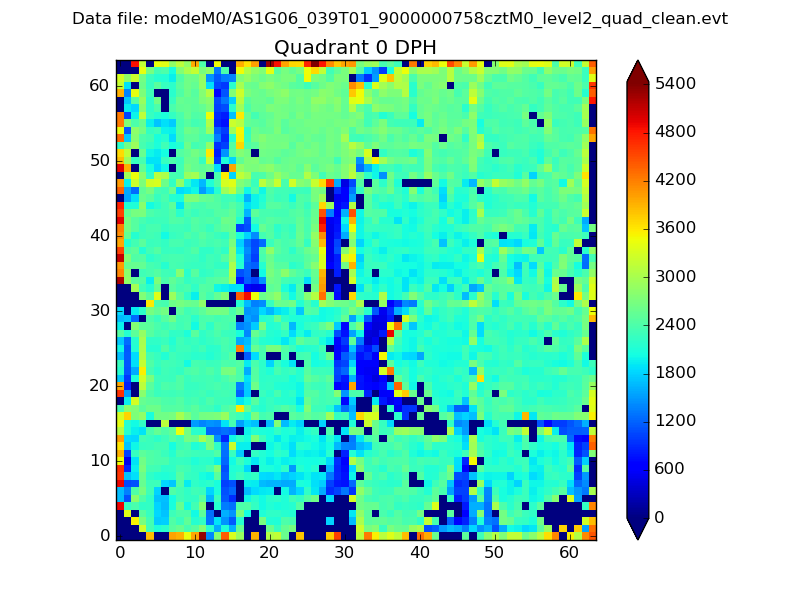 |
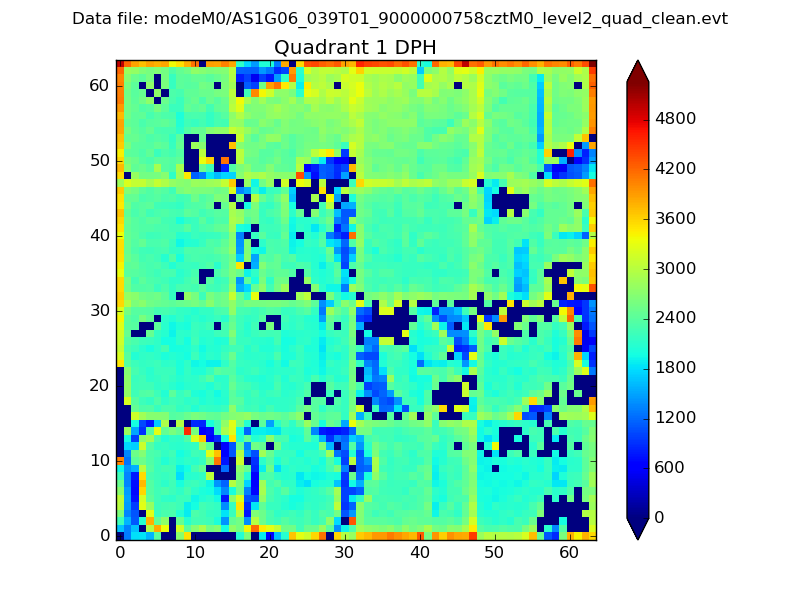 |
Quadrant B |
|---|---|---|---|
| Quadrant D | 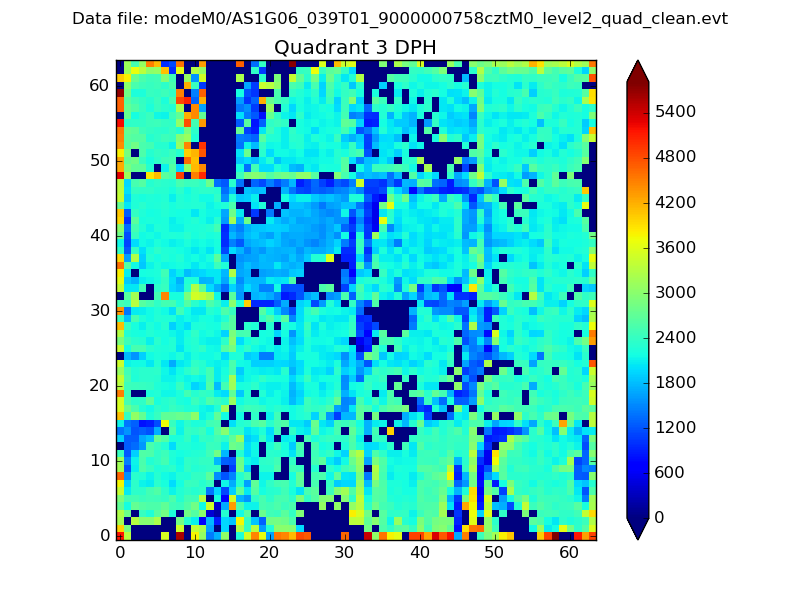 |
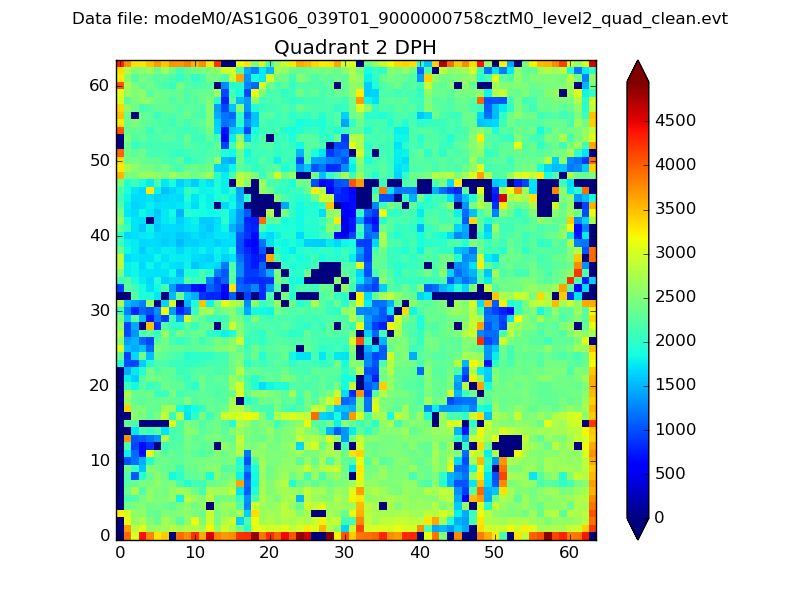 |
Quadrant C |
| Plot type | Count rate plots | Images |
|---|---|---|
| Comparison with Poisson distribution Blue bars denote a histogram of data divided into 1 sec bins. Red curve is a Poisson curve with rate = median count rate of data. |
 |
 |
| Quadrant-wise count rates Data is divided into 100 sec bins |
 |
|
| Module-wise count rates for Quadrant A Data is divided into 100 sec bins |
 |
 |
| Module-wise count rates for Quadrant B Data is divided into 100 sec bins |
 |
 |
| Module-wise count rates for Quadrant C Data is divided into 100 sec bins |
 |
 |
| Module-wise count rates for Quadrant D Data is divided into 100 sec bins |
 |
 |
| Parameter | Plot |
|---|---|
| CZT HV Monitor |  |
| D_VDD |  |
| Temperature 1 |  |
| Veto HV Monitor |  |
| Veto LLD |  |
| Alpha Counter |  |
| _CPM_Rate |  |
| CZT Counter |  |
| +2.5 Volts monitor |  |
| +5 Volts monitor |  |
| _ROLL_ROT |  |
| _Roll_DEC |  |
| _Roll_RA |  |
| Veto Counter |  |