| Param | Original file | Final file |
|---|---|---|
| Filename | modeM0/AS1G06_039T01_9000000758_05844cztM0_level2.evt | modeM0/AS1G06_039T01_9000000758_05844cztM0_level2_quad_clean.evt |
| Size (bytes) | 415,016,640 | 106,130,880 |
| Size | 395.8 MB | 101.2 MB |
| Events in quadrant A | 2,865,650 | 699,728 |
| Events in quadrant B | 3,100,639 | 695,117 |
| Events in quadrant C | 2,842,169 | 698,552 |
| Events in quadrant D | 3,317,167 | 666,693 |
| Mode M0 | |||
|---|---|---|---|
| Quadrant | BADHDUFLAG | Total packets | Discarded packets |
| A | 0 | 13318 | 3 |
| B | 0 | 13839 | 2 |
| C | 0 | 13273 | 2 |
| D | 0 | 14547 | 2 |
| Mode SS | |||
|---|---|---|---|
| Quadrant | BADHDUFLAG | Total packets | Discarded packets |
| A | 0 | 136 | 0 |
| B | 0 | 136 | 0 |
| C | 0 | 136 | 0 |
| D | 0 | 136 | 0 |
| Mode M9 | |||
|---|---|---|---|
| Quadrant | BADHDUFLAG | Total packets | Discarded packets |
| A | 0 | 20 | 0 |
| B | 0 | 20 | 0 |
| C | 0 | 20 | 0 |
| D | 0 | 20 | 0 |
| Quadrant | Total seconds | Saturated seconds | Saturation percentage |
|---|---|---|---|
| A | 6507 | 12 | 0.184417% |
| B | 6507 | 28 | 0.430306% |
| C | 6507 | 15 | 0.230521% |
| D | 6507 | 64 | 0.983556% |
Noise dominated data is calculated using 1-second bins in cleaned event files. If a bin has >2000 counts, and if more than 50% of those come from <1% of pixels, then it is considered to be noise-dominated and hence unusable.
| Quadrant | # 1 sec bins | Bins with >0 counts | Bins with >2000 counts | High rate bins dominated by noise | Noise dominated (total time) | Noise dominated (detector-on time) | Marked lightcurve |
|---|---|---|---|---|---|---|---|
| A | 8537 | 6509 | 0 | 0 | 0.00% | 0.00% | 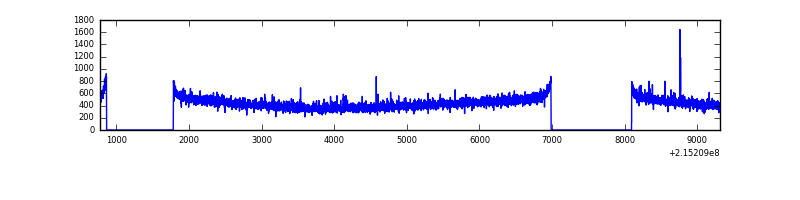 |
| B | 8537 | 6509 | 1 | 1 | 0.01% | 0.02% | 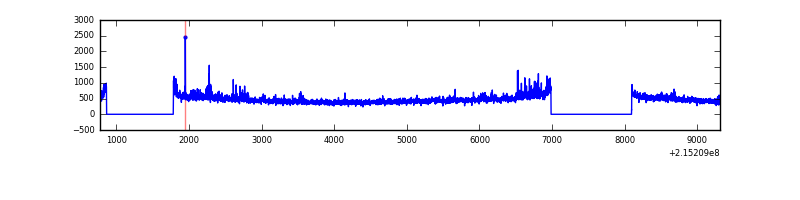 |
| C | 8537 | 6509 | 0 | 0 | 0.00% | 0.00% | 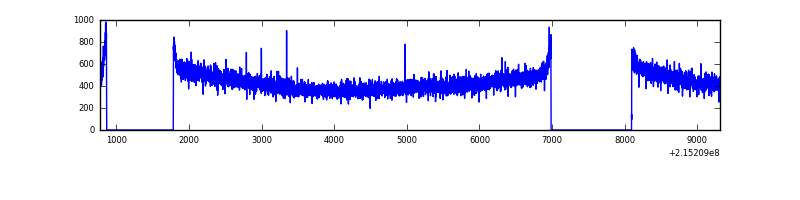 |
| D | 8537 | 6509 | 47 | 47 | 0.55% | 0.72% | 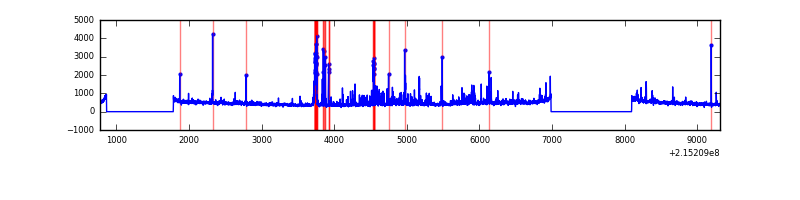 |
Top three noisy pixels from each quadrant. If the there are fewer than three noisy pixels in the level2.evt file, extra rows are filled as -1
| Pixel properties | Quadrant properties | ||||||
|---|---|---|---|---|---|---|---|
| Quadrant | DetID | PixID | Counts | Sigma | Mean | Median | Sigma |
| A | 14 | 111 | 9853 | 60.55 | 737 | 722 | 150.8 |
| A | 15 | 234 | 7860 | 47.33 | 737 | 722 | 150.8 |
| A | 12 | 194 | 7258 | 43.34 | 737 | 722 | 150.8 |
| B | 15 | 204 | 89232 | 625.01 | 745 | 726 | 141.6 |
| B | 0 | 214 | 59788 | 417.08 | 745 | 726 | 141.6 |
| B | 4 | 81 | 22480 | 153.62 | 745 | 726 | 141.6 |
| C | 13 | 61 | 5922 | 30.76 | 725 | 727 | 168.9 |
| C | 12 | 4 | 4865 | 24.5 | 725 | 727 | 168.9 |
| C | 8 | 222 | 2625 | 11.24 | 725 | 727 | 168.9 |
| D | 2 | 152 | 224366 | 1264.9 | 716 | 694 | 176.8 |
| D | 2 | 14 | 103900 | 583.64 | 716 | 694 | 176.8 |
| D | 12 | 233 | 90735 | 509.19 | 716 | 694 | 176.8 |
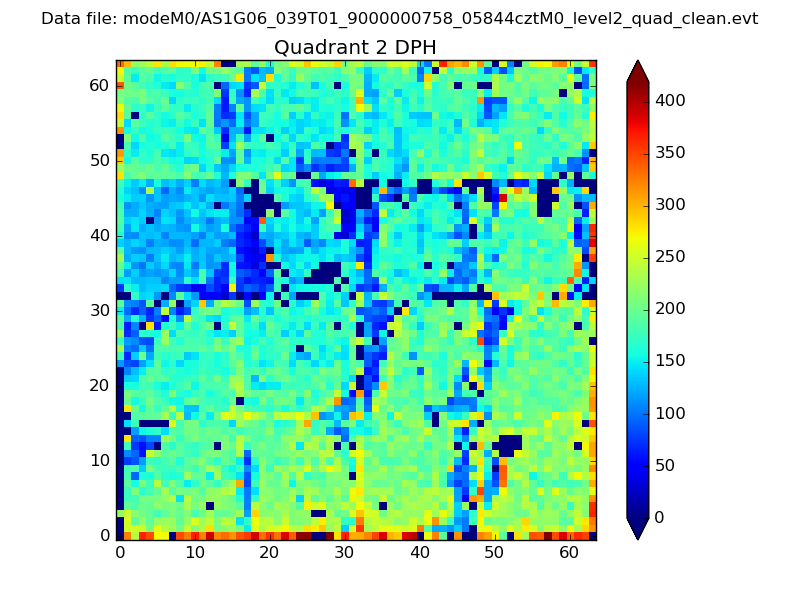
Histogram calculated using DETX and DETY for each event in the final _common_clean file
| Quadrant A |  |
 |
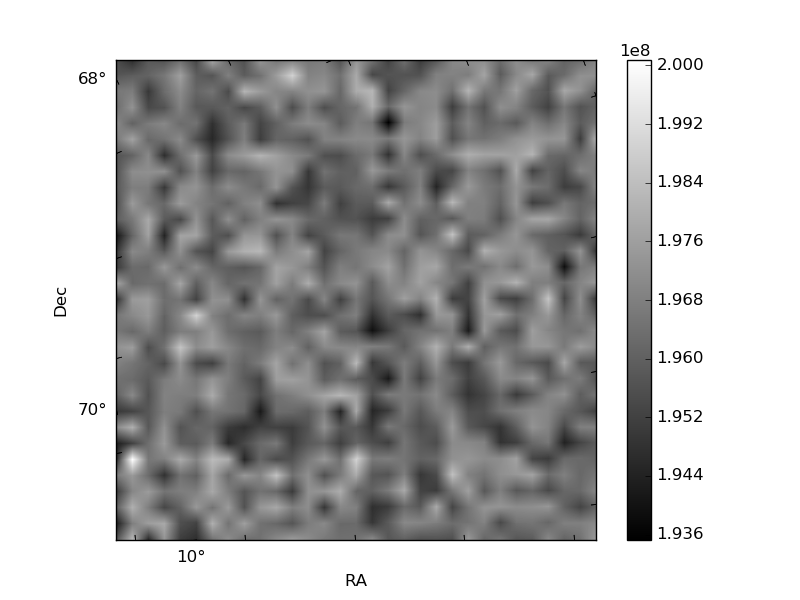
Quadrant B |
|---|---|---|---|
| Quadrant D | 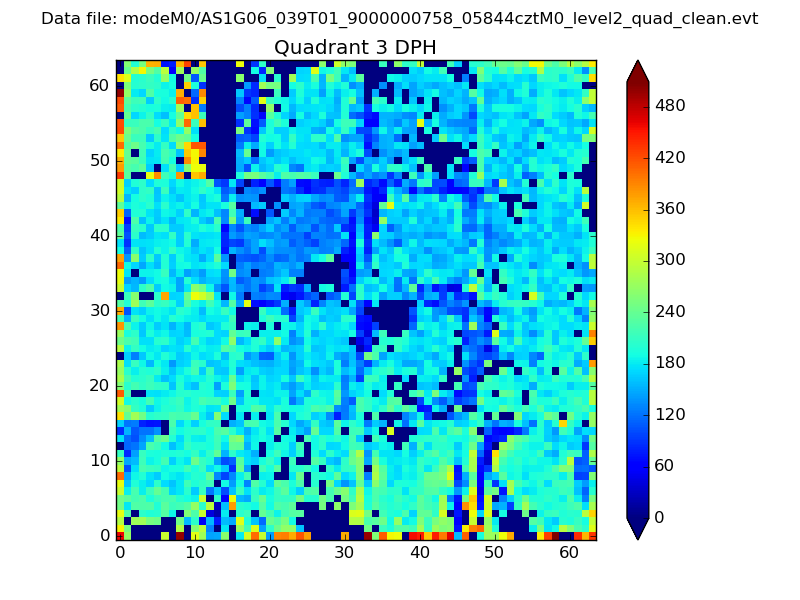 |
 |
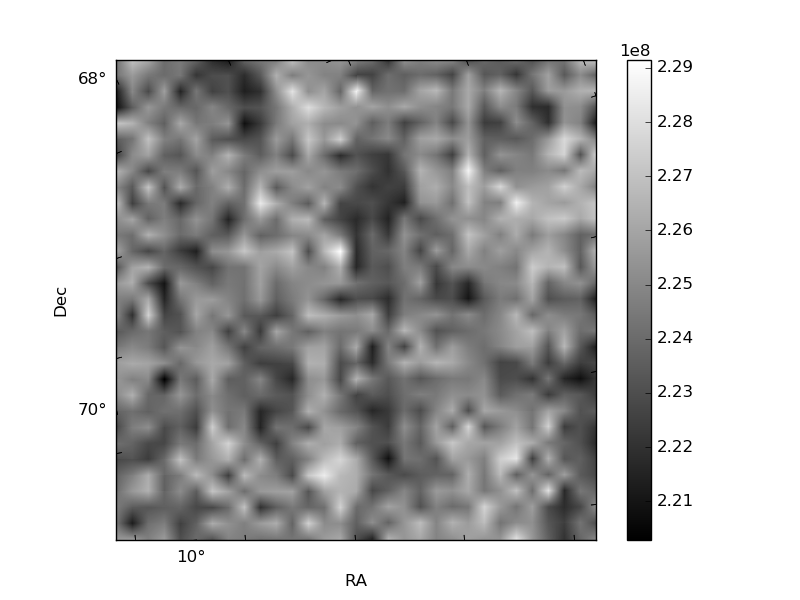
Quadrant C |
| Plot type | Count rate plots | Images |
|---|---|---|
| Comparison with Poisson distribution Blue bars denote a histogram of data divided into 1 sec bins. Red curve is a Poisson curve with rate = median count rate of data. |
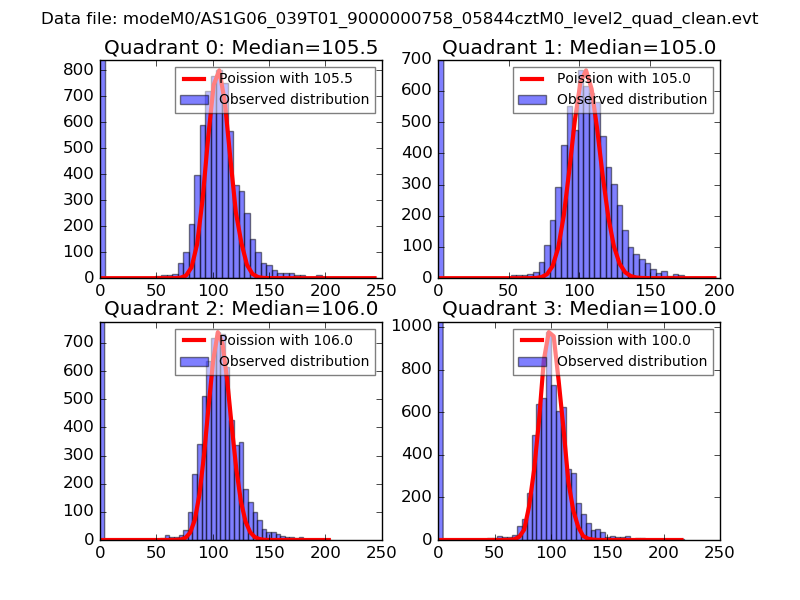 |
 |
| Quadrant-wise count rates Data is divided into 100 sec bins |
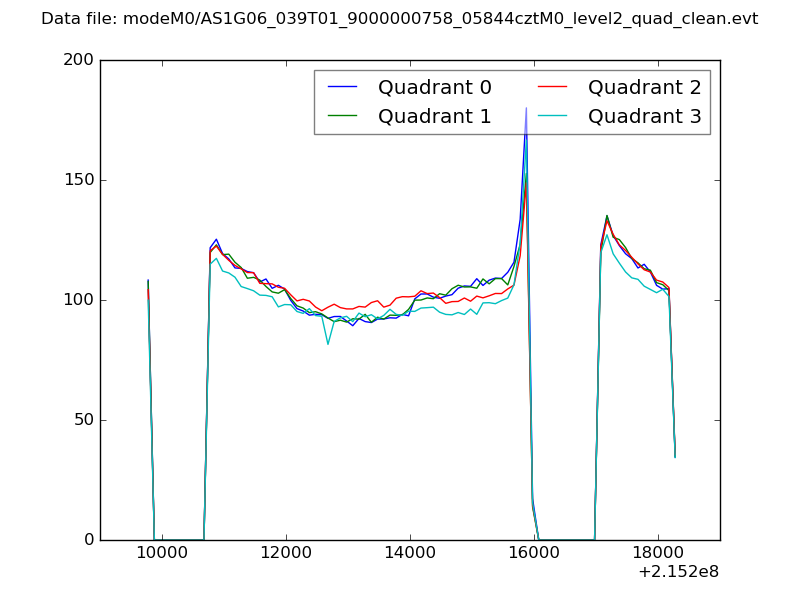 |
|
| Module-wise count rates for Quadrant A Data is divided into 100 sec bins |
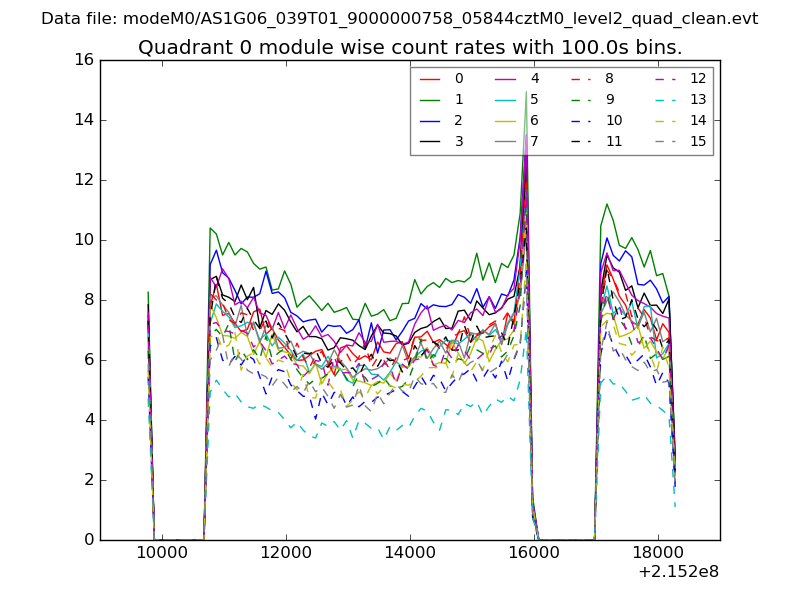 |
 |
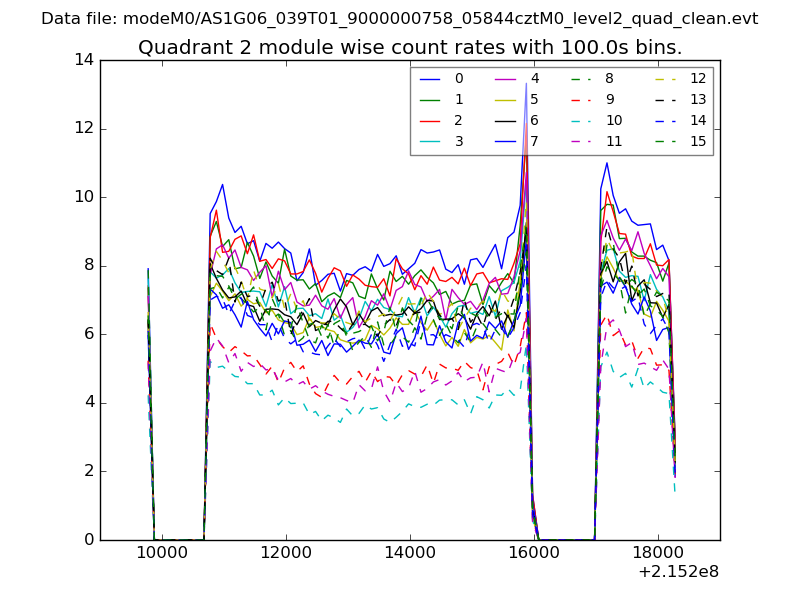
| Module-wise count rates for Quadrant B Data is divided into 100 sec bins |
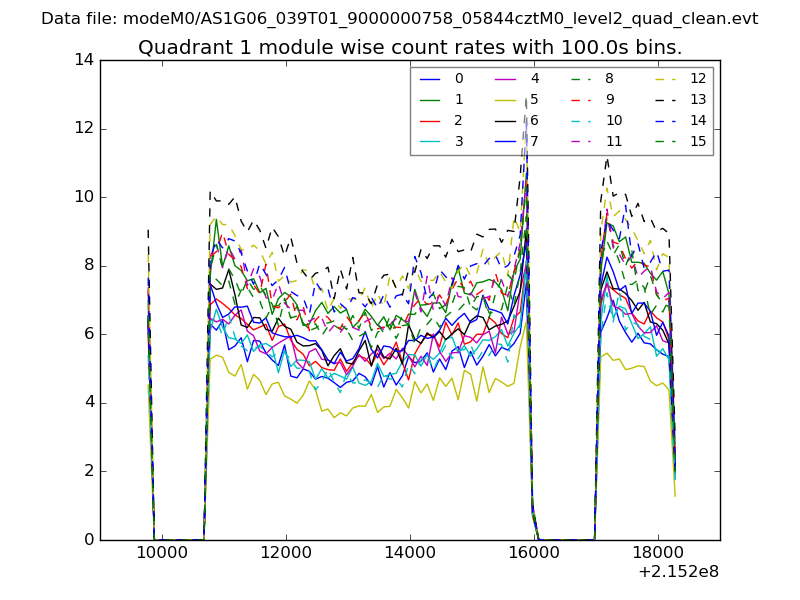 |
 |
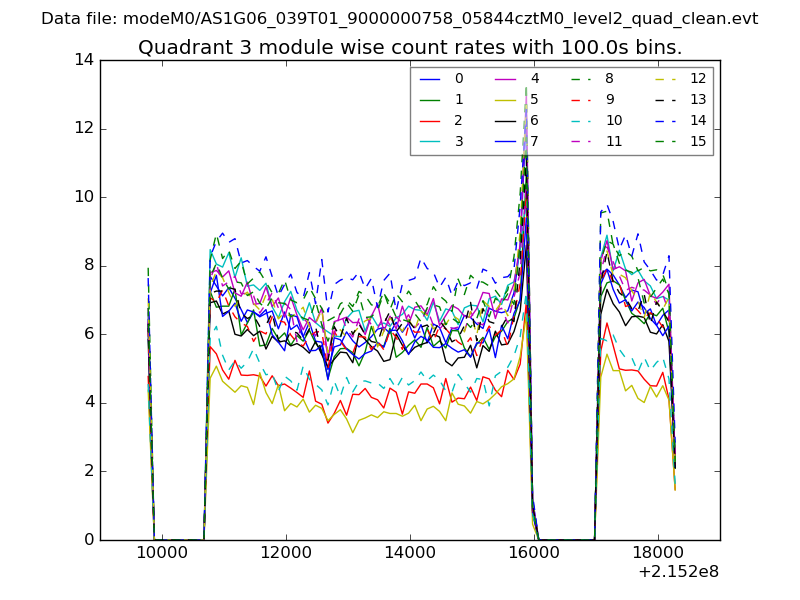
| Module-wise count rates for Quadrant C Data is divided into 100 sec bins |
 |
 |
| Module-wise count rates for Quadrant D Data is divided into 100 sec bins |
 |
 |
| Parameter | Plot |
|---|---|
| CZT HV Monitor | 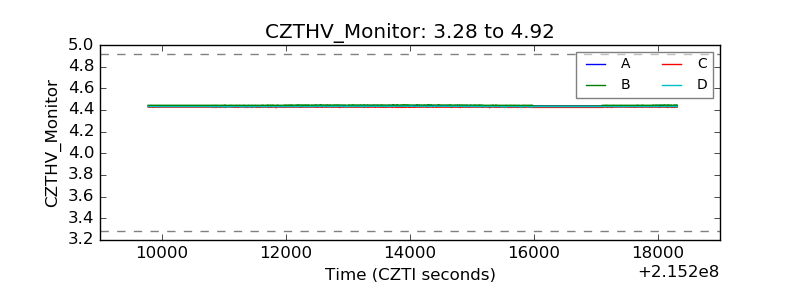 |
| D_VDD | 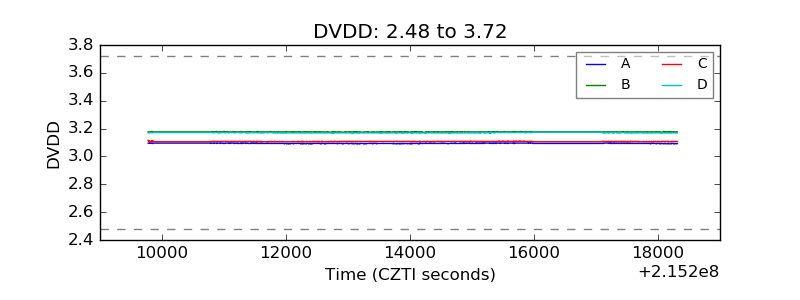 |
| Temperature 1 | 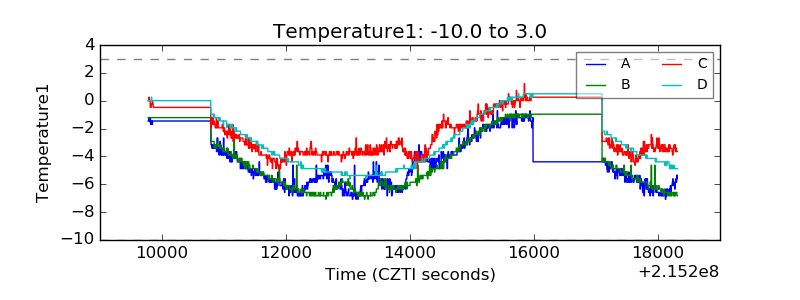 |
| Veto HV Monitor | 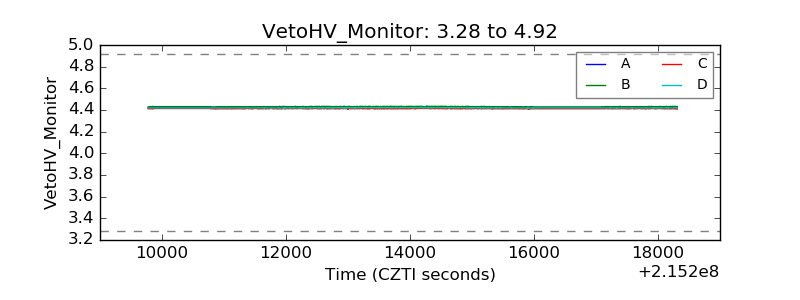 |
| Veto LLD | 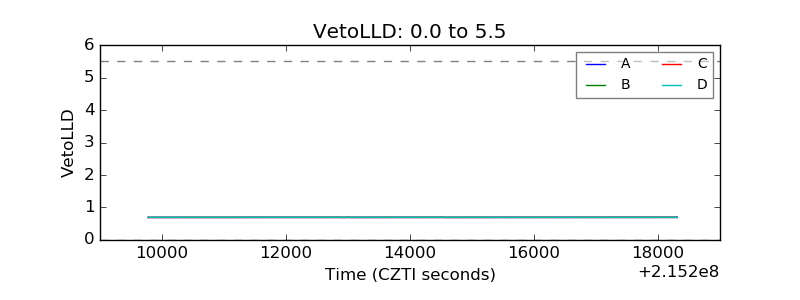 |
| Alpha Counter | 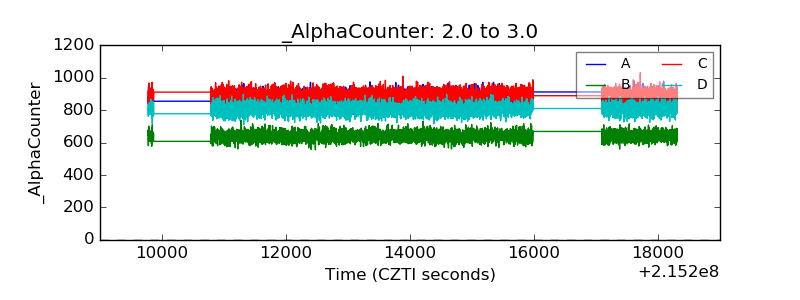 |
| _CPM_Rate | 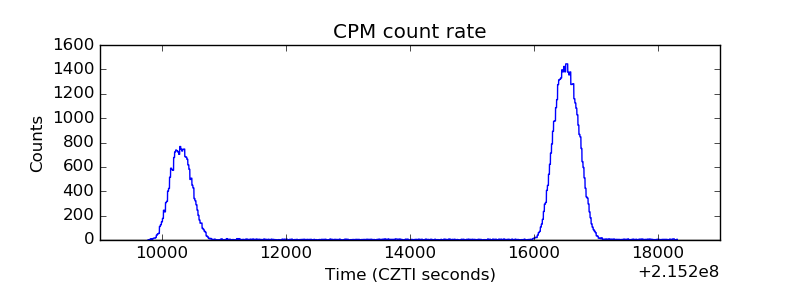 |
| CZT Counter | 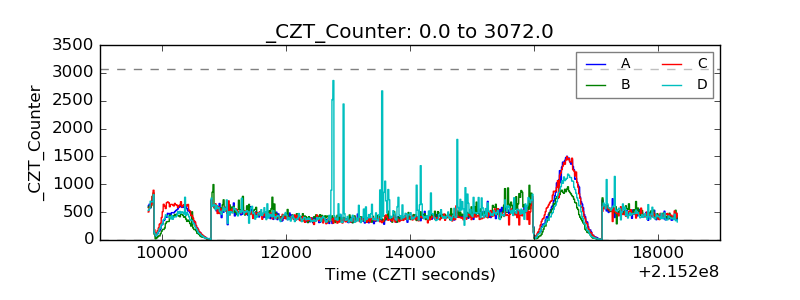 |
| +2.5 Volts monitor |  |
| +5 Volts monitor |  |
| _ROLL_ROT | 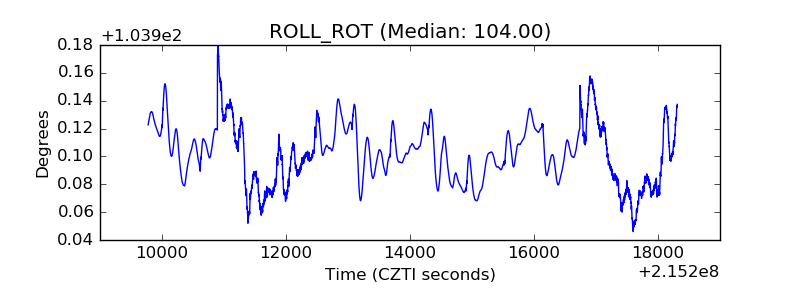 |
| _Roll_DEC | 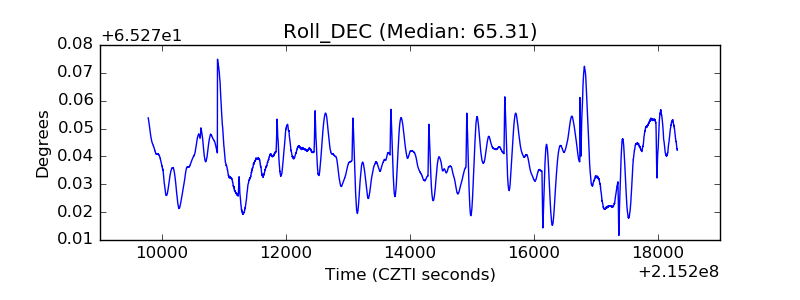 |
| _Roll_RA | 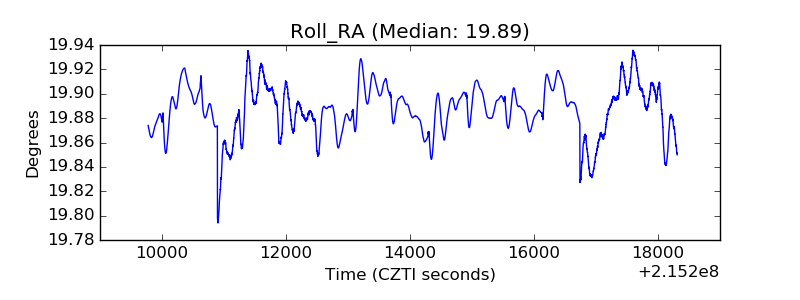 |
| Veto Counter | 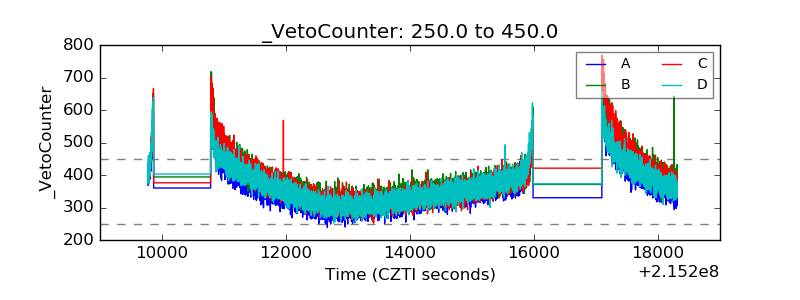 |