| Param | Original file | Final file |
|---|---|---|
| Filename | modeM0/AS1G06_039T01_9000000758_05846cztM0_level2.evt | modeM0/AS1G06_039T01_9000000758_05846cztM0_level2_quad_clean.evt |
| Size (bytes) | 425,430,720 | 111,818,880 |
| Size | 405.7 MB | 106.6 MB |
| Events in quadrant A | 2,930,347 | 740,325 |
| Events in quadrant B | 3,095,228 | 749,945 |
| Events in quadrant C | 2,904,484 | 739,409 |
| Events in quadrant D | 3,501,769 | 693,399 |
| Mode M0 | |||
|---|---|---|---|
| Quadrant | BADHDUFLAG | Total packets | Discarded packets |
| A | 0 | 13503 | 3 |
| B | 0 | 13810 | 2 |
| C | 0 | 13502 | 2 |
| D | 0 | 15157 | 2 |
| Mode SS | |||
|---|---|---|---|
| Quadrant | BADHDUFLAG | Total packets | Discarded packets |
| A | 0 | 136 | 0 |
| B | 0 | 136 | 0 |
| C | 0 | 136 | 0 |
| D | 0 | 136 | 0 |
| Mode M9 | |||
|---|---|---|---|
| Quadrant | BADHDUFLAG | Total packets | Discarded packets |
| A | 0 | 19 | 0 |
| B | 0 | 19 | 0 |
| C | 0 | 19 | 0 |
| D | 0 | 20 | 0 |
| Quadrant | Total seconds | Saturated seconds | Saturation percentage |
|---|---|---|---|
| A | 6646 | 14 | 0.210653% |
| B | 6646 | 27 | 0.406259% |
| C | 6646 | 11 | 0.165513% |
| D | 6646 | 87 | 1.309058% |
Noise dominated data is calculated using 1-second bins in cleaned event files. If a bin has >2000 counts, and if more than 50% of those come from <1% of pixels, then it is considered to be noise-dominated and hence unusable.
| Quadrant | # 1 sec bins | Bins with >0 counts | Bins with >2000 counts | High rate bins dominated by noise | Noise dominated (total time) | Noise dominated (detector-on time) | Marked lightcurve |
|---|---|---|---|---|---|---|---|
| A | 7881 | 6647 | 0 | 0 | 0.00% | 0.00% | 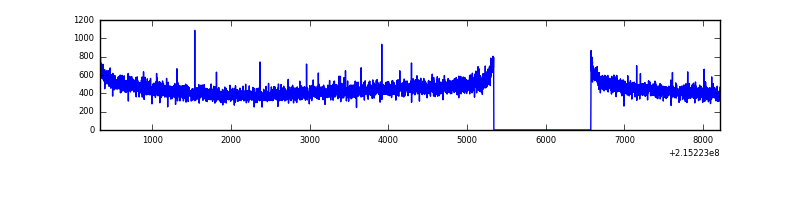 |
| B | 7881 | 6647 | 1 | 1 | 0.01% | 0.02% | 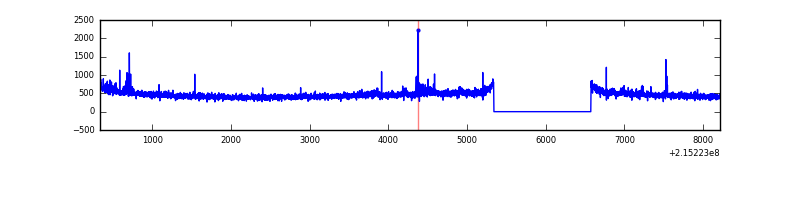 |
| C | 7881 | 6647 | 0 | 0 | 0.00% | 0.00% | 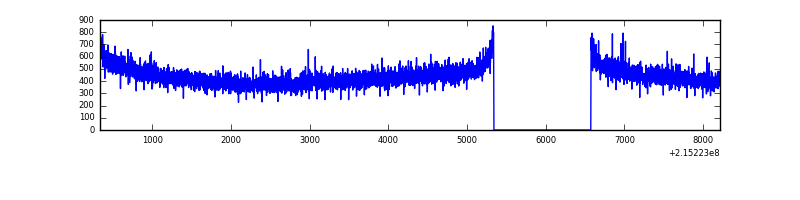 |
| D | 7881 | 6647 | 52 | 52 | 0.66% | 0.78% | 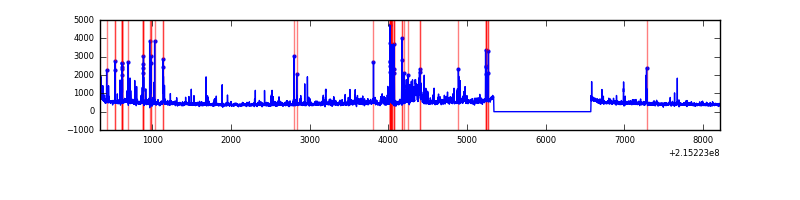 |
Top three noisy pixels from each quadrant. If the there are fewer than three noisy pixels in the level2.evt file, extra rows are filled as -1
| Pixel properties | Quadrant properties | ||||||
|---|---|---|---|---|---|---|---|
| Quadrant | DetID | PixID | Counts | Sigma | Mean | Median | Sigma |
| A | 12 | 194 | 7437 | 43.58 | 759 | 743 | 153.6 |
| A | 0 | 226 | 7390 | 43.27 | 759 | 743 | 153.6 |
| A | 13 | 254 | 3327 | 16.82 | 759 | 743 | 153.6 |
| B | 15 | 204 | 44514 | 299.93 | 775 | 757 | 145.9 |
| B | 15 | 85 | 23627 | 156.76 | 775 | 757 | 145.9 |
| B | 0 | 214 | 22664 | 150.16 | 775 | 757 | 145.9 |
| C | 13 | 61 | 6132 | 31.56 | 742 | 745 | 170.7 |
| C | 14 | 67 | 3127 | 13.95 | 742 | 745 | 170.7 |
| C | 1 | 16 | 2863 | 12.41 | 742 | 745 | 170.7 |
| D | 1 | 239 | 455072 | 2569.99 | 726 | 704 | 176.8 |
| D | 12 | 110 | 152429 | 858.19 | 726 | 704 | 176.8 |
| D | 8 | 195 | 39315 | 218.39 | 726 | 704 | 176.8 |
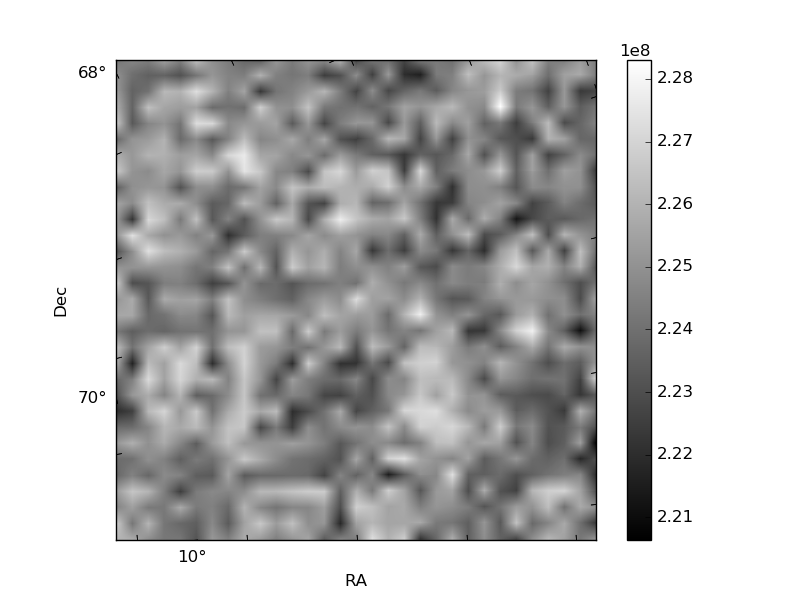
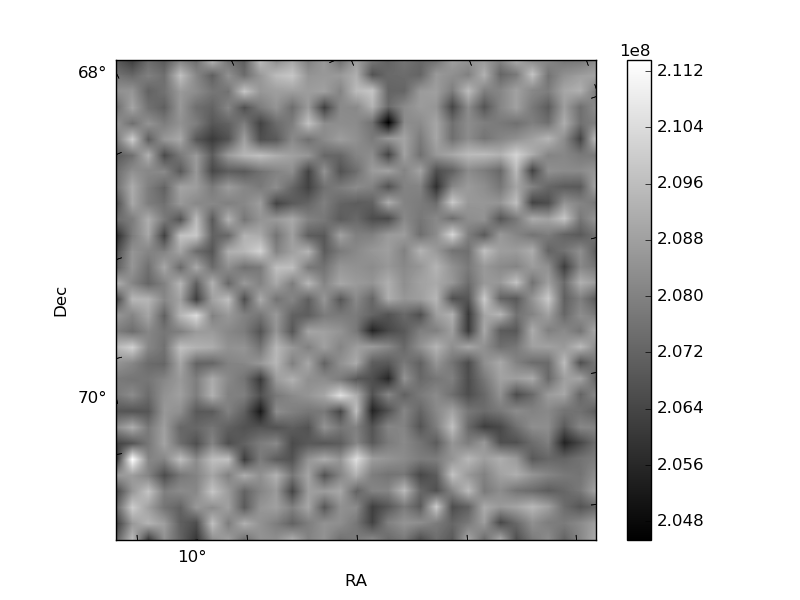
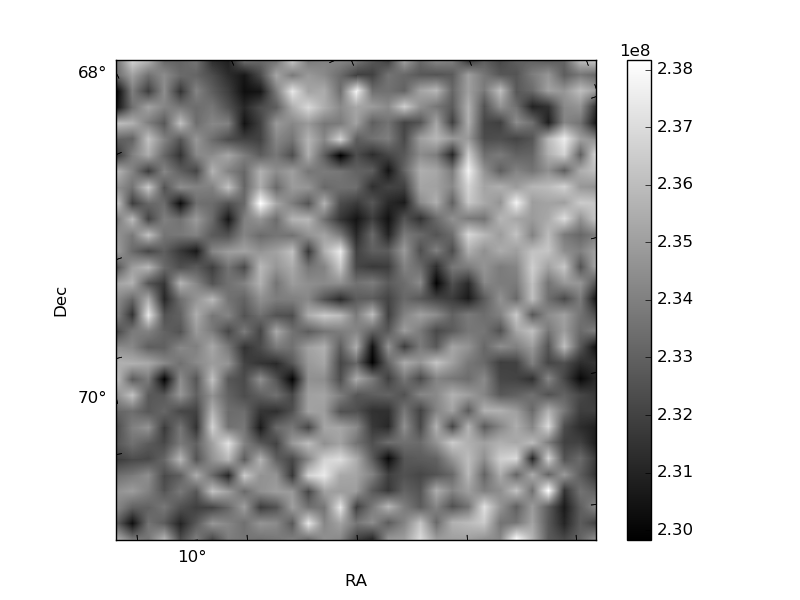
Histogram calculated using DETX and DETY for each event in the final _common_clean file
| Quadrant A | 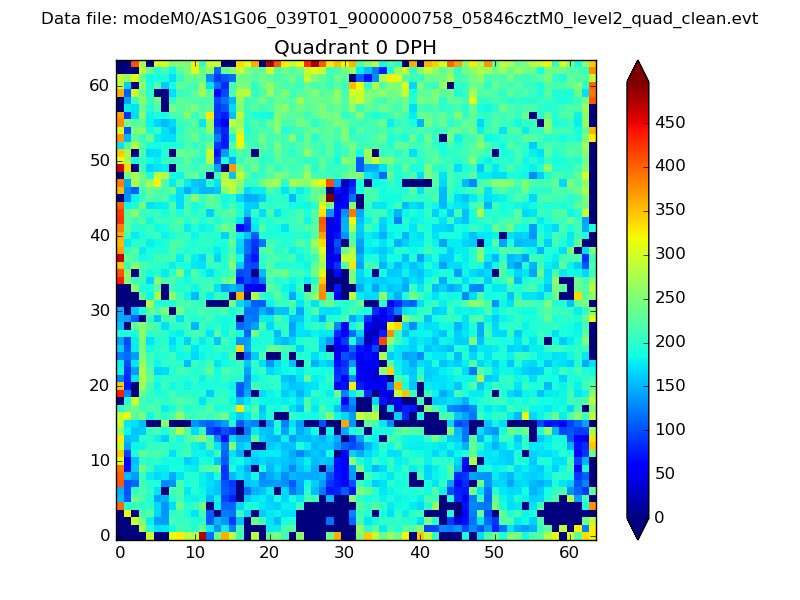 |
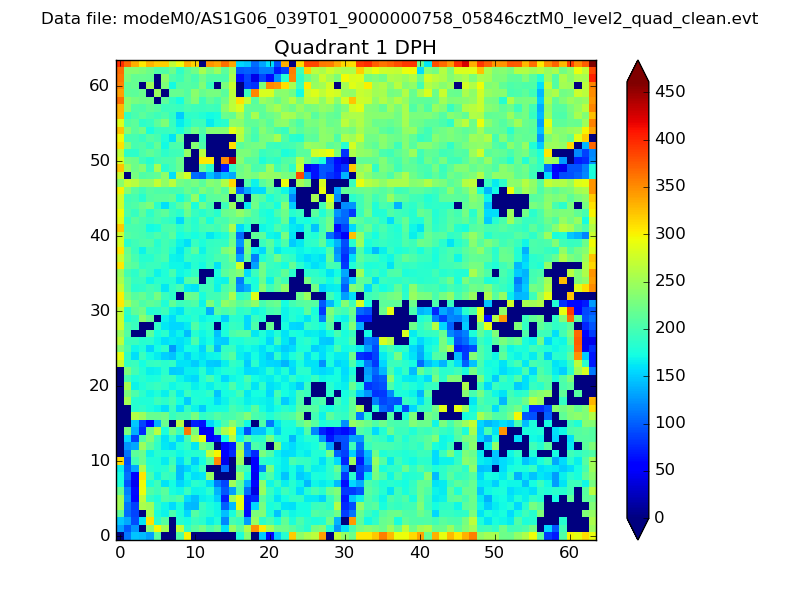 |
Quadrant B |
|---|---|---|---|
| Quadrant D | 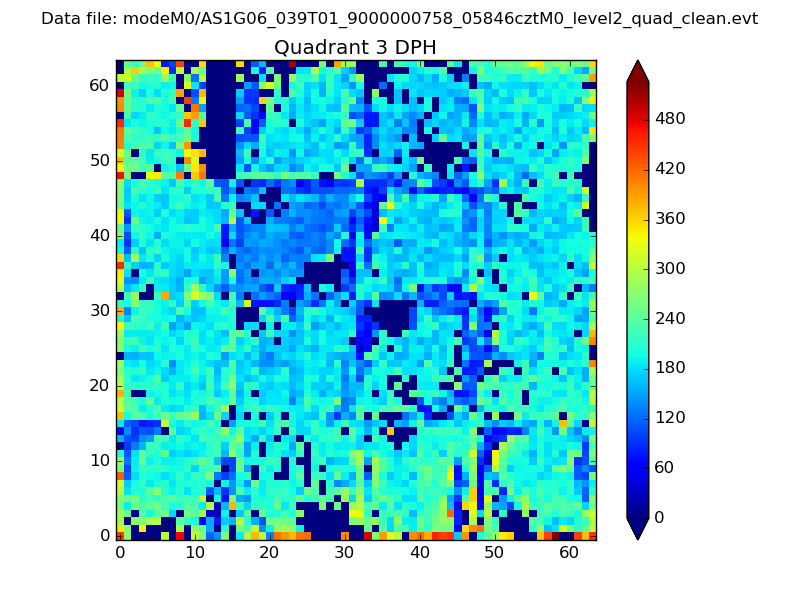 |
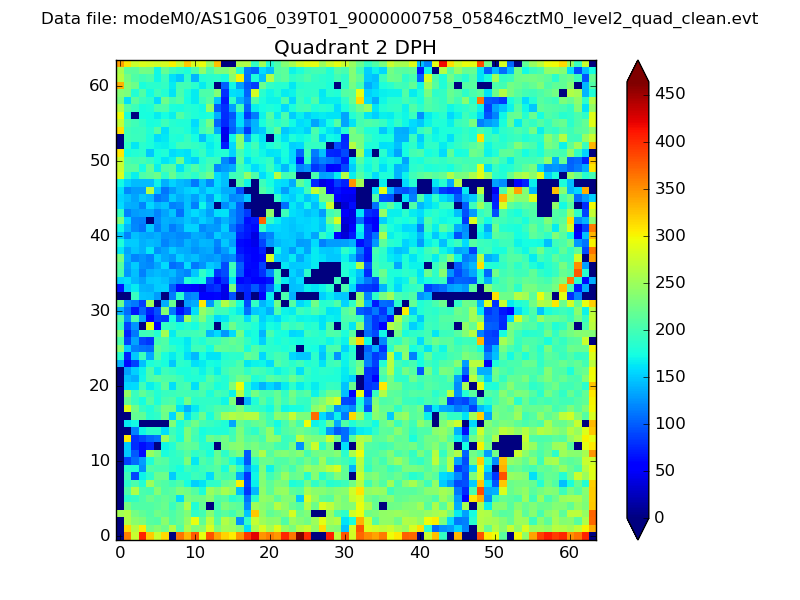 |
Quadrant C |
| Plot type | Count rate plots | Images |
|---|---|---|
| Comparison with Poisson distribution Blue bars denote a histogram of data divided into 1 sec bins. Red curve is a Poisson curve with rate = median count rate of data. |
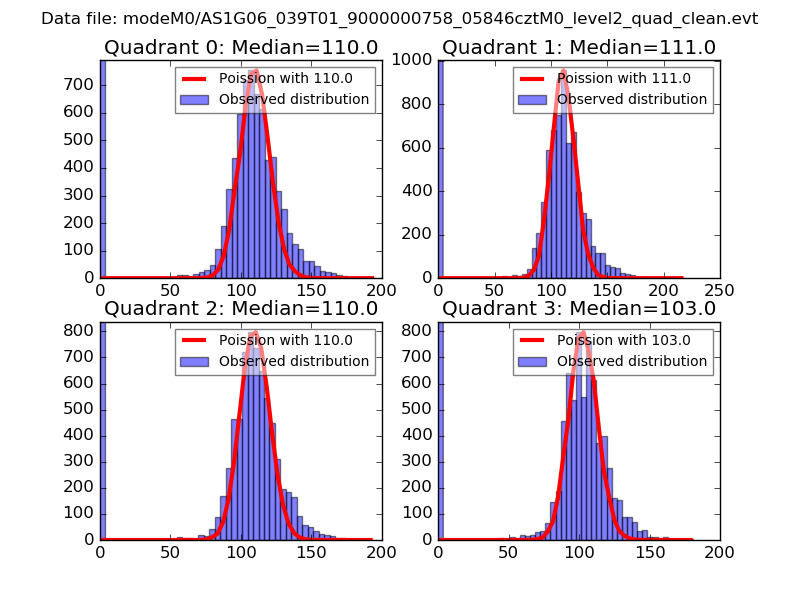 |
 |
| Quadrant-wise count rates Data is divided into 100 sec bins |
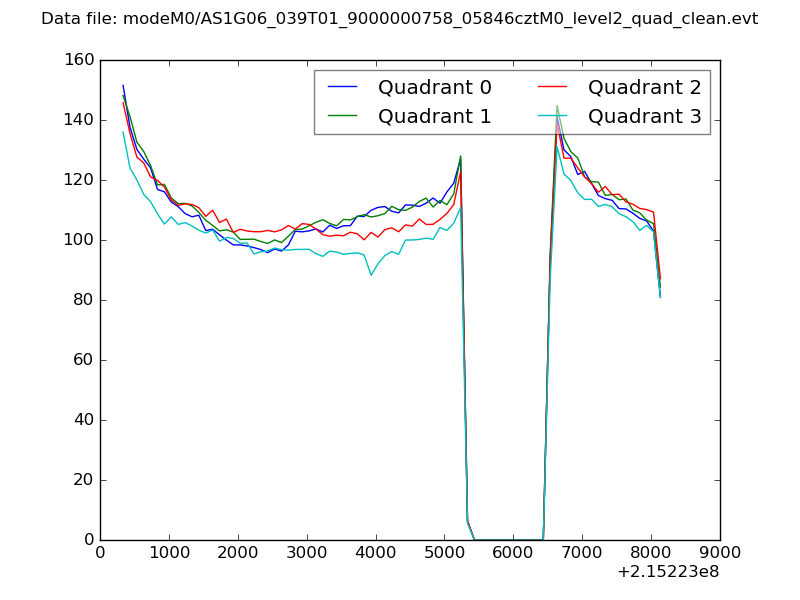 |
|
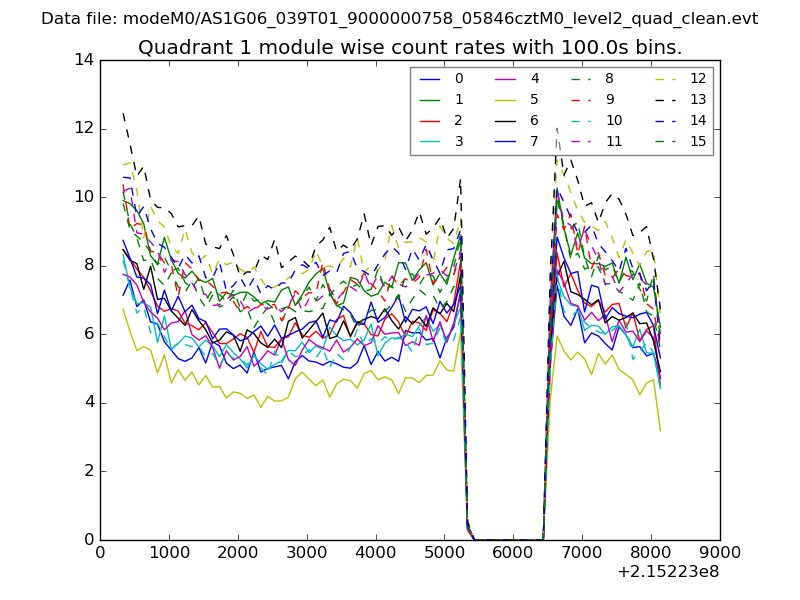
| Module-wise count rates for Quadrant A Data is divided into 100 sec bins |
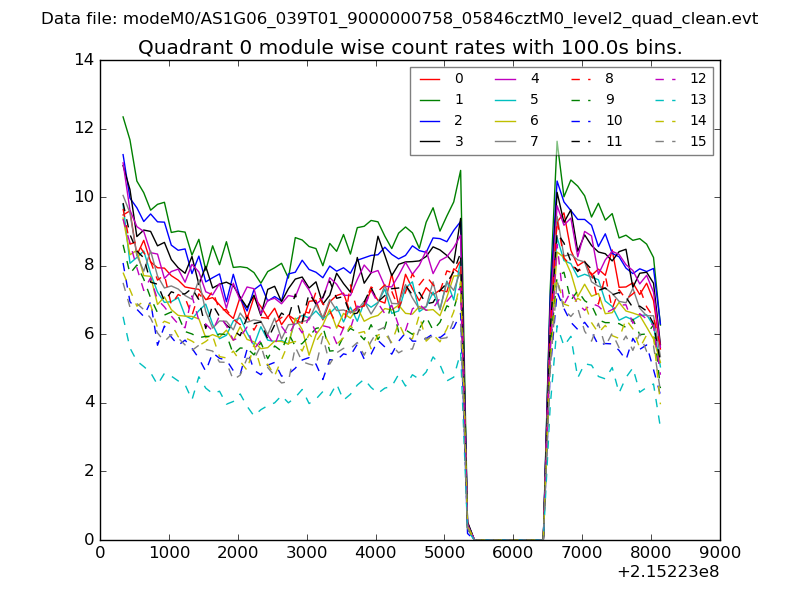 |
 |
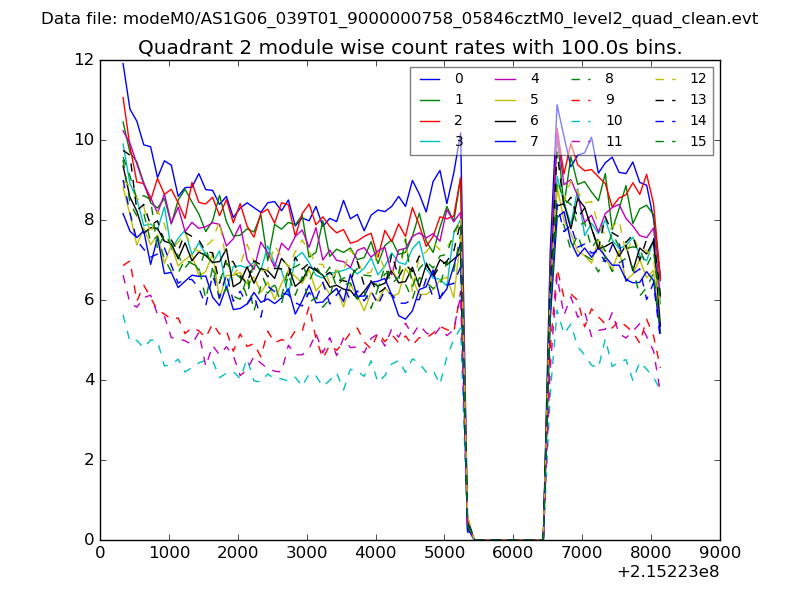
| Module-wise count rates for Quadrant B Data is divided into 100 sec bins |
 |
 |
| Module-wise count rates for Quadrant C Data is divided into 100 sec bins |
 |
 |
| Module-wise count rates for Quadrant D Data is divided into 100 sec bins |
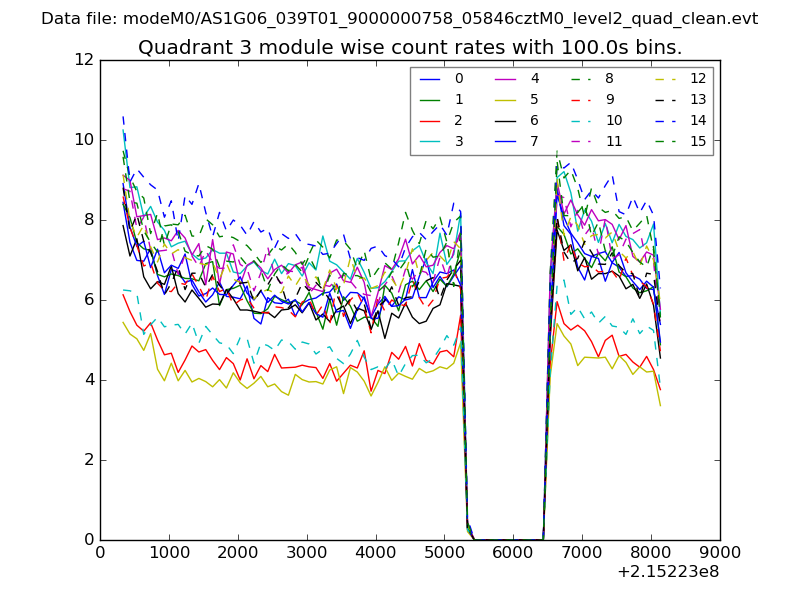 |
 |
| Parameter | Plot |
|---|---|
| CZT HV Monitor | 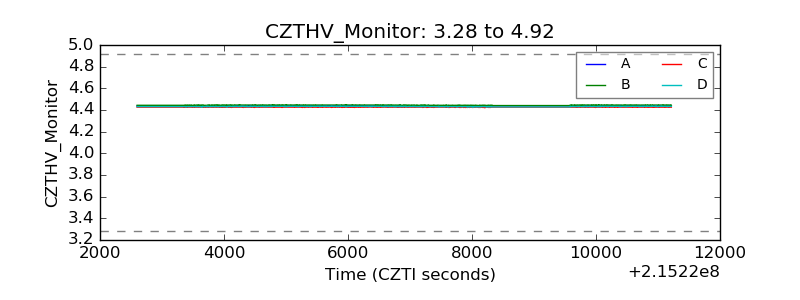 |
| D_VDD | 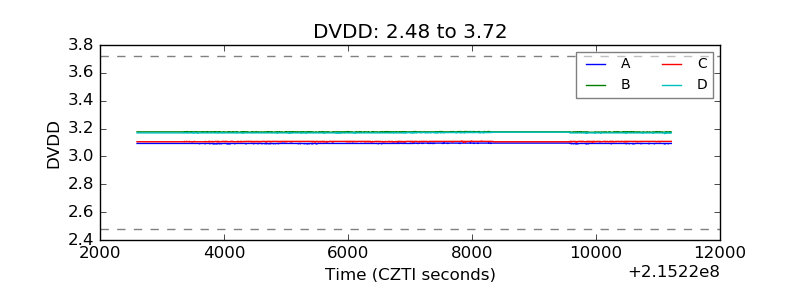 |
| Temperature 1 | 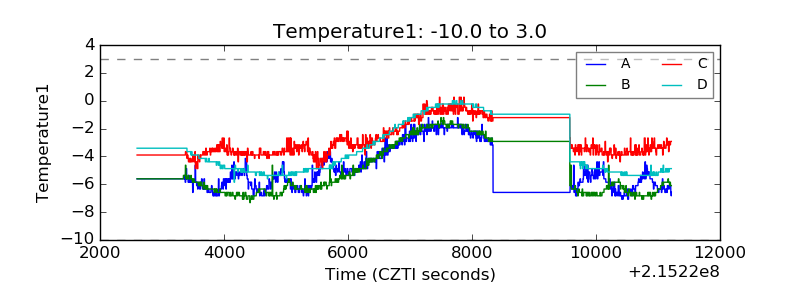 |
| Veto HV Monitor | 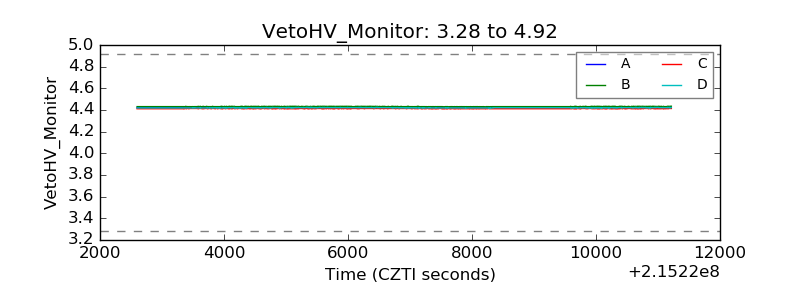 |
| Veto LLD | 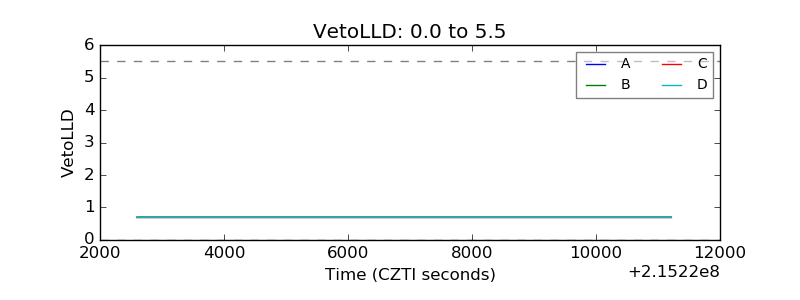 |
| Alpha Counter | 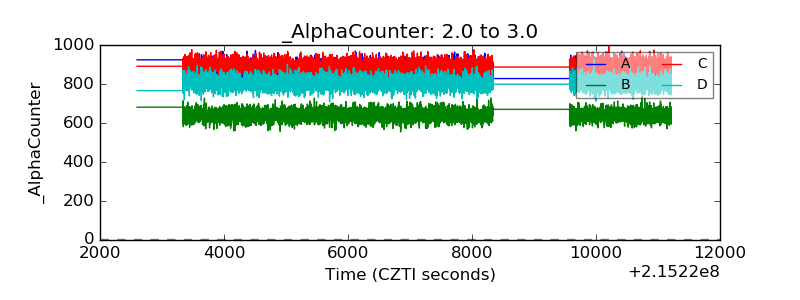 |
| _CPM_Rate | 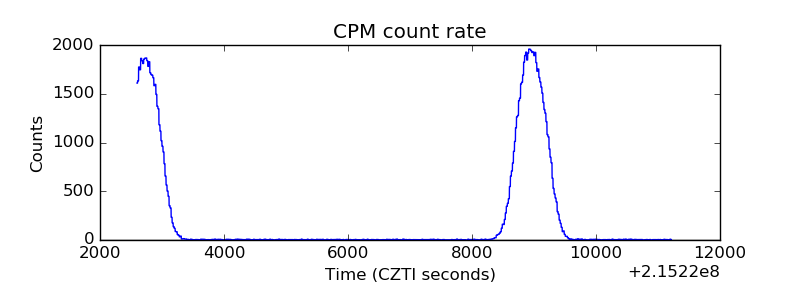 |
| CZT Counter | 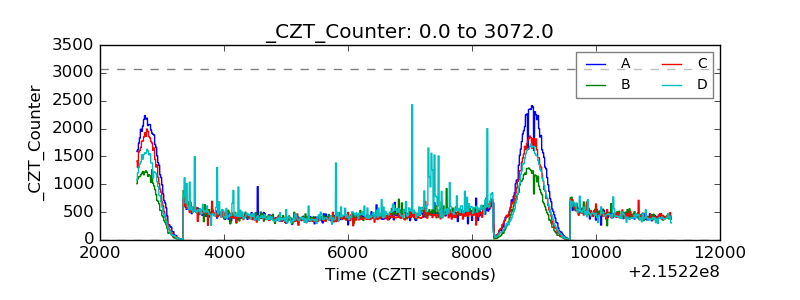 |
| +2.5 Volts monitor |  |
| +5 Volts monitor | 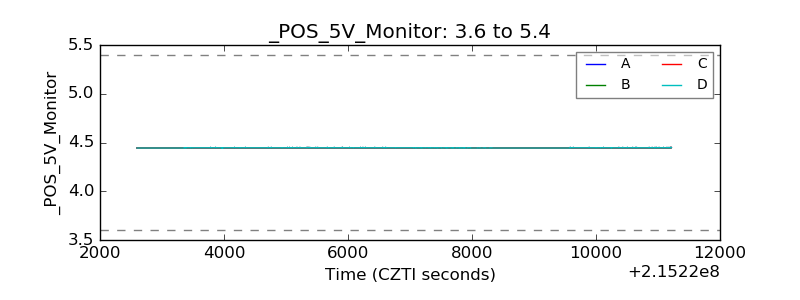 |
| _ROLL_ROT | 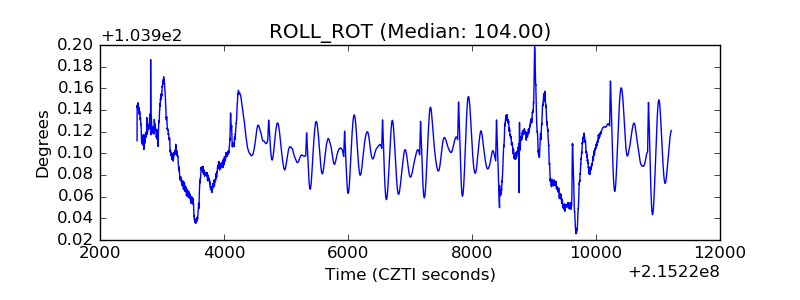 |
| _Roll_DEC | 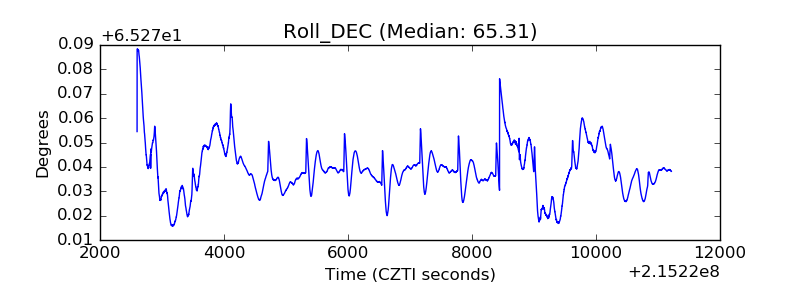 |
| _Roll_RA | 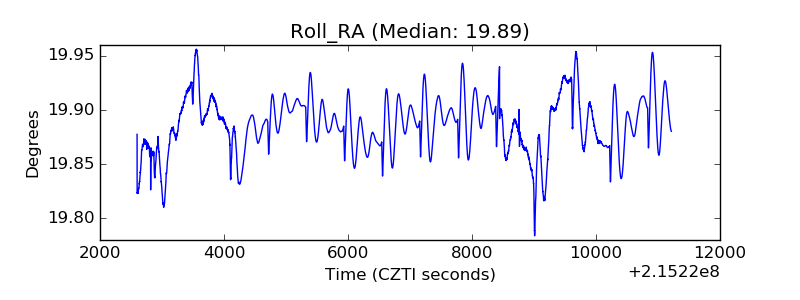 |
| Veto Counter | 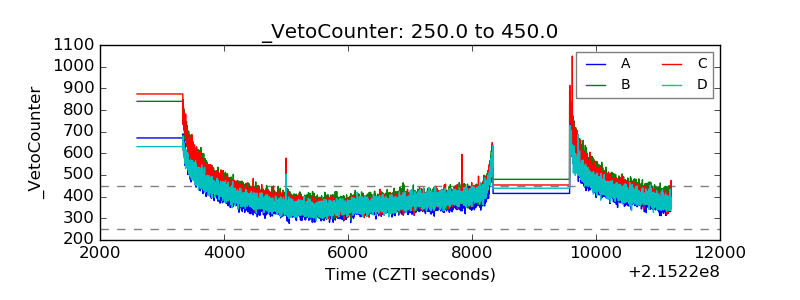 |