| Param | Original file | Final file |
|---|---|---|
| Filename | modeM0/AS1G06_039T01_9000000758_05849cztM0_level2.evt | modeM0/AS1G06_039T01_9000000758_05849cztM0_level2_quad_clean.evt |
| Size (bytes) | 471,686,400 | 105,554,880 |
| Size | 449.8 MB | 100.7 MB |
| Events in quadrant A | 2,922,012 | 714,371 |
| Events in quadrant B | 3,004,135 | 717,377 |
| Events in quadrant C | 2,863,633 | 703,601 |
| Events in quadrant D | 5,051,682 | 606,254 |
| Mode M0 | |||
|---|---|---|---|
| Quadrant | BADHDUFLAG | Total packets | Discarded packets |
| A | 0 | 13315 | 4 |
| B | 0 | 13396 | 3 |
| C | 0 | 13306 | 3 |
| D | 0 | 19734 | 3 |
| Mode SS | |||
|---|---|---|---|
| Quadrant | BADHDUFLAG | Total packets | Discarded packets |
| A | 0 | 132 | 0 |
| B | 0 | 132 | 0 |
| C | 0 | 132 | 0 |
| D | 0 | 132 | 0 |
| Mode M9 | |||
|---|---|---|---|
| Quadrant | BADHDUFLAG | Total packets | Discarded packets |
| A | 0 | 13 | 0 |
| B | 0 | 13 | 0 |
| C | 0 | 13 | 0 |
| D | 0 | 14 | 0 |
| Quadrant | Total seconds | Saturated seconds | Saturation percentage |
|---|---|---|---|
| A | 6523 | 91 | 1.395064% |
| B | 6523 | 111 | 1.701671% |
| C | 6523 | 55 | 0.843170% |
| D | 6523 | 883 | 13.536716% |
Noise dominated data is calculated using 1-second bins in cleaned event files. If a bin has >2000 counts, and if more than 50% of those come from <1% of pixels, then it is considered to be noise-dominated and hence unusable.
| Quadrant | # 1 sec bins | Bins with >0 counts | Bins with >2000 counts | High rate bins dominated by noise | Noise dominated (total time) | Noise dominated (detector-on time) | Marked lightcurve |
|---|---|---|---|---|---|---|---|
| A | 7613 | 6525 | 0 | 0 | 0.00% | 0.00% | 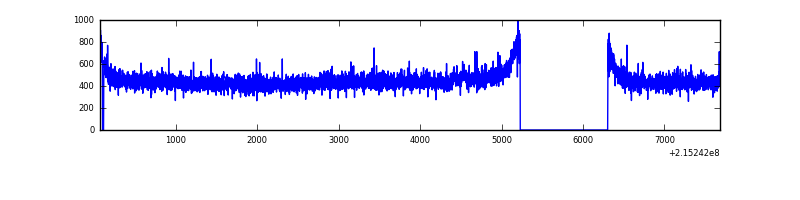 |
| B | 7613 | 6525 | 0 | 0 | 0.00% | 0.00% |  |
| C | 7613 | 6525 | 0 | 0 | 0.00% | 0.00% | 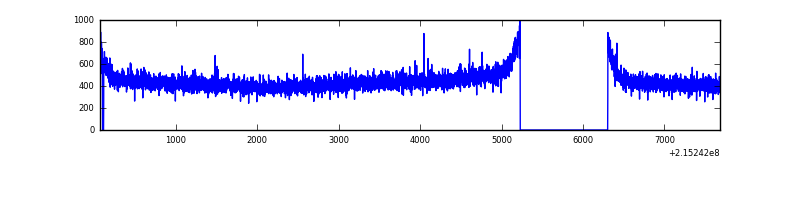 |
| D | 7613 | 6524 | 515 | 515 | 6.76% | 7.89% |  |
Top three noisy pixels from each quadrant. If the there are fewer than three noisy pixels in the level2.evt file, extra rows are filled as -1
| Pixel properties | Quadrant properties | ||||||
|---|---|---|---|---|---|---|---|
| Quadrant | DetID | PixID | Counts | Sigma | Mean | Median | Sigma |
| A | 13 | 251 | 10659 | 64.74 | 754 | 738 | 153.2 |
| A | 0 | 226 | 7313 | 42.91 | 754 | 738 | 153.2 |
| A | 15 | 234 | 7215 | 42.27 | 754 | 738 | 153.2 |
| B | 15 | 204 | 41533 | 282.37 | 759 | 739 | 144.5 |
| B | 0 | 219 | 13997 | 91.77 | 759 | 739 | 144.5 |
| B | 12 | 111 | 13376 | 87.47 | 759 | 739 | 144.5 |
| C | 8 | 128 | 13511 | 76.82 | 725 | 730 | 166.4 |
| C | 8 | 112 | 7064 | 38.07 | 725 | 730 | 166.4 |
| C | 13 | 61 | 5776 | 30.33 | 725 | 730 | 166.4 |
| D | 1 | 239 | 1762991 | 10948.06 | 659 | 637 | 161.0 |
| D | 2 | 152 | 384393 | 2383.96 | 659 | 637 | 161.0 |
| D | 9 | 85 | 258604 | 1602.54 | 659 | 637 | 161.0 |
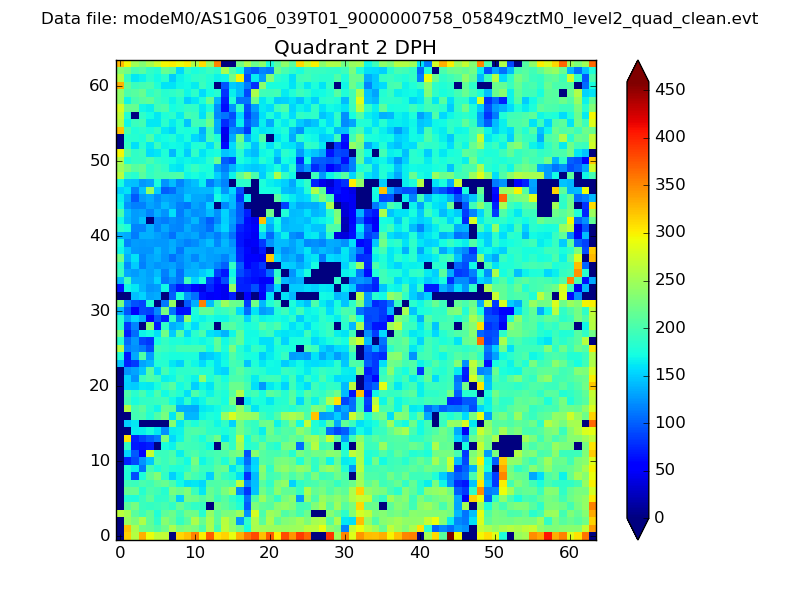
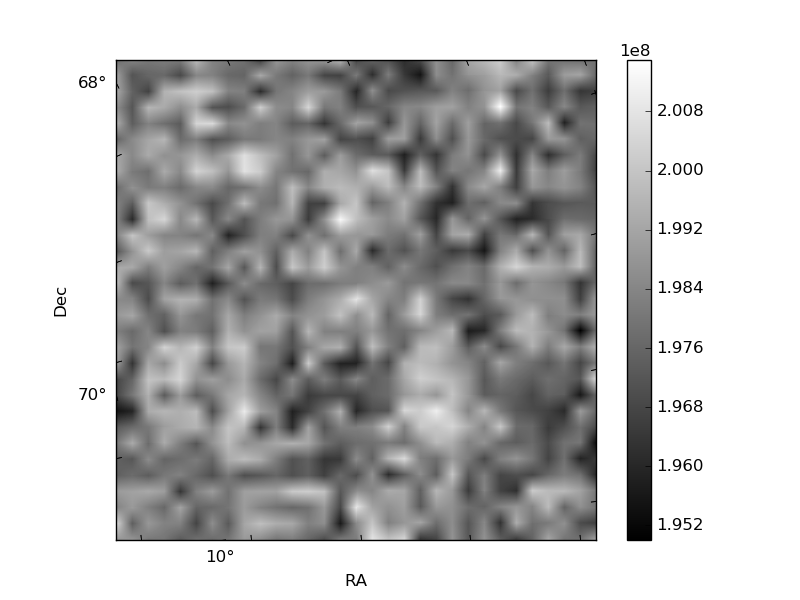
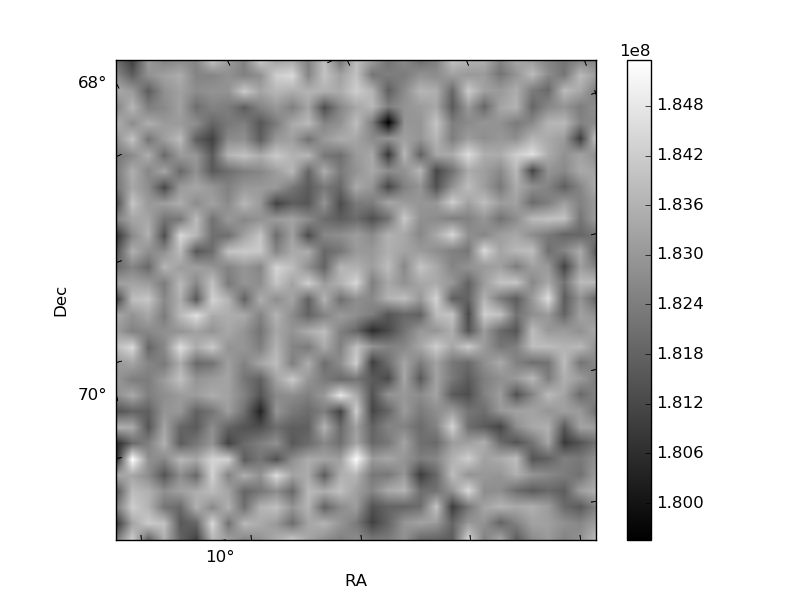
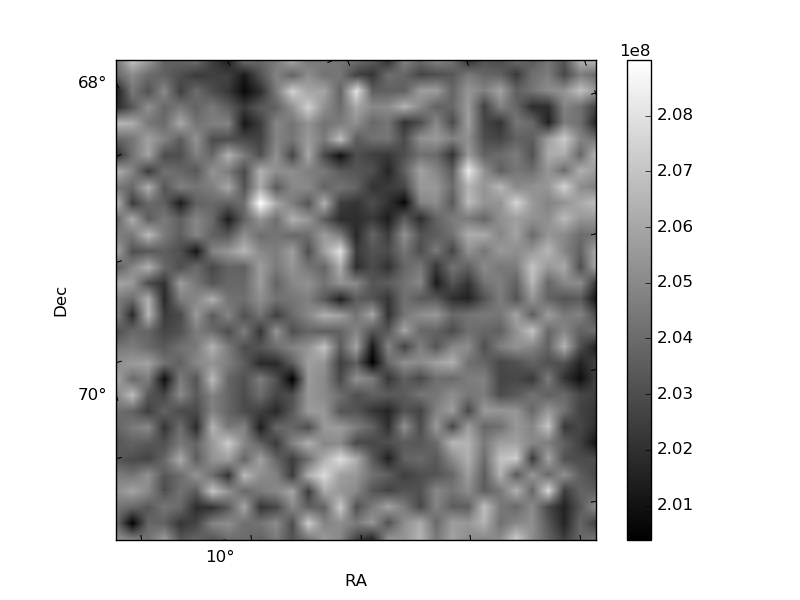
Histogram calculated using DETX and DETY for each event in the final _common_clean file
| Quadrant A | 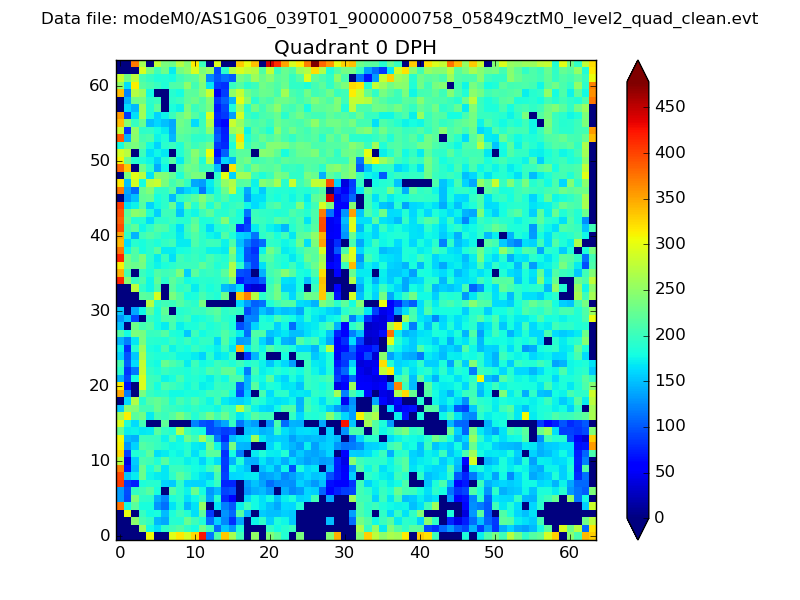 |
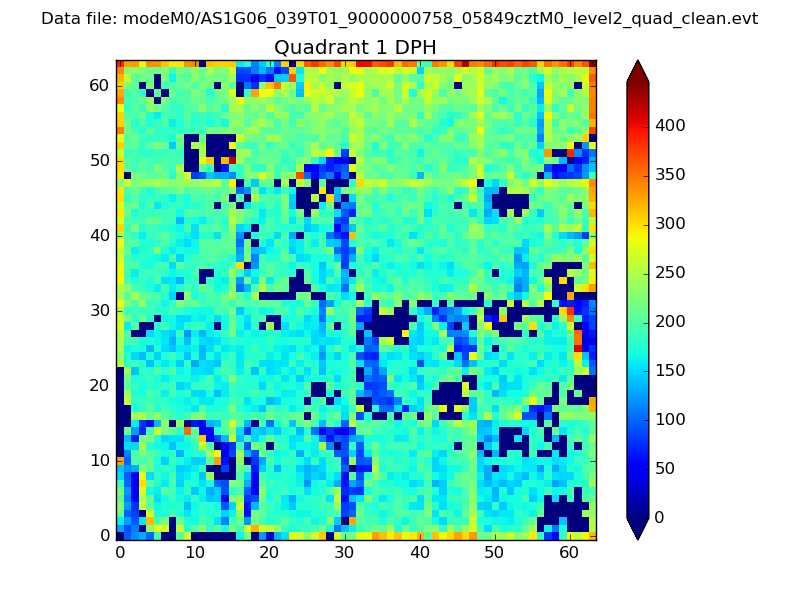 |
Quadrant B |
|---|---|---|---|
| Quadrant D | 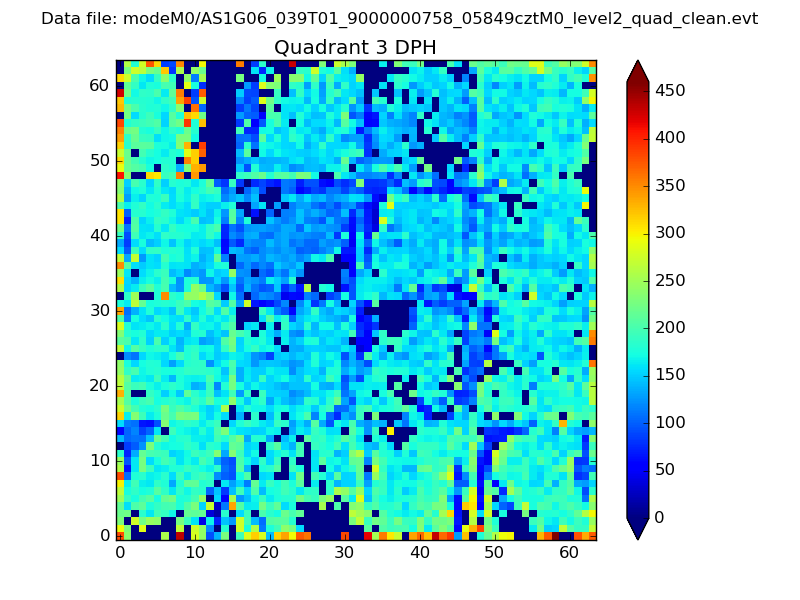 |
 |
Quadrant C |
| Plot type | Count rate plots | Images |
|---|---|---|
| Comparison with Poisson distribution Blue bars denote a histogram of data divided into 1 sec bins. Red curve is a Poisson curve with rate = median count rate of data. |
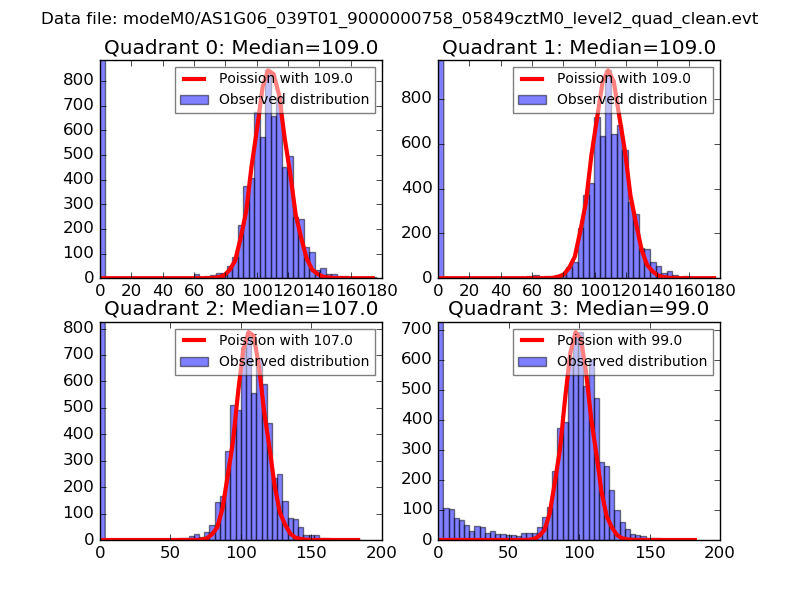 |
 |
| Quadrant-wise count rates Data is divided into 100 sec bins |
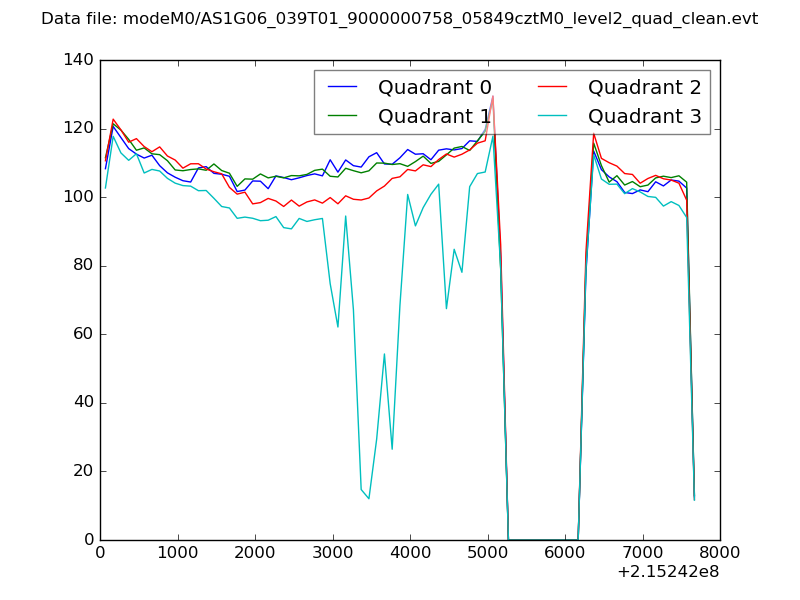 |
|
| Module-wise count rates for Quadrant A Data is divided into 100 sec bins |
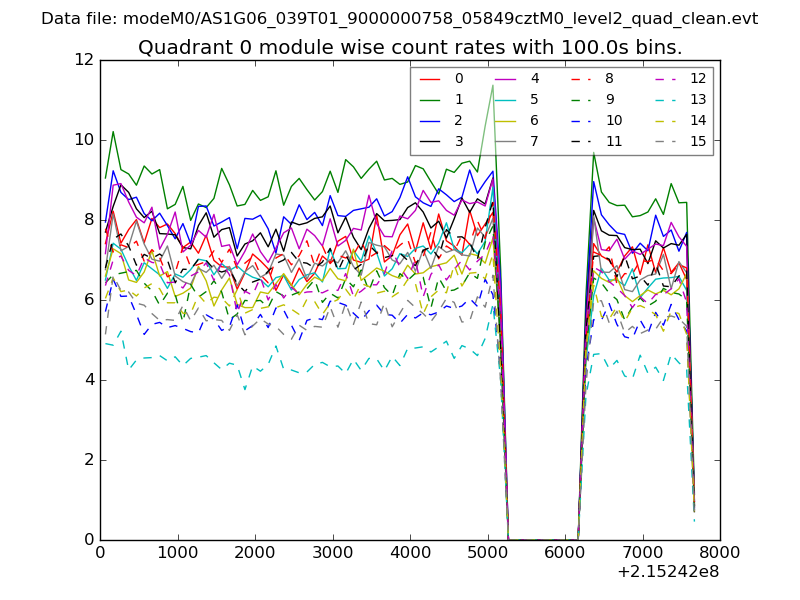 |
 |
| Module-wise count rates for Quadrant B Data is divided into 100 sec bins |
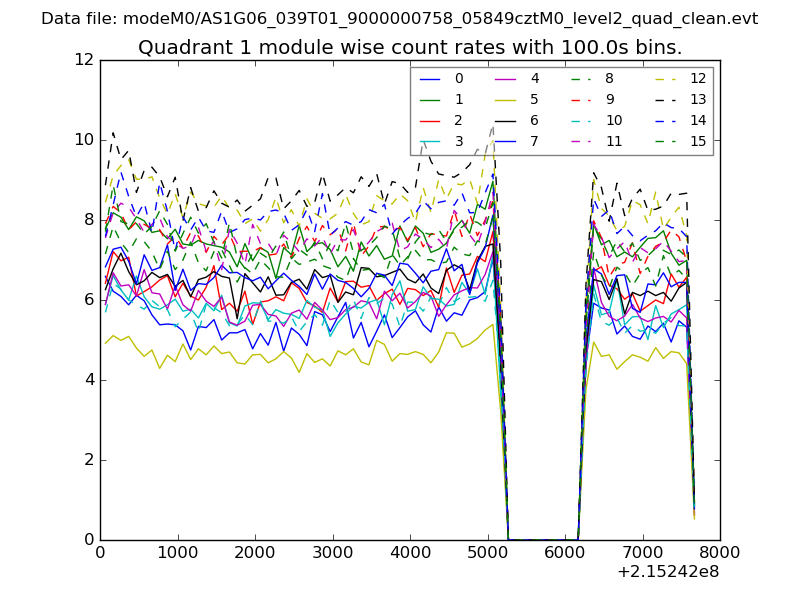 |
 |
| Module-wise count rates for Quadrant C Data is divided into 100 sec bins |
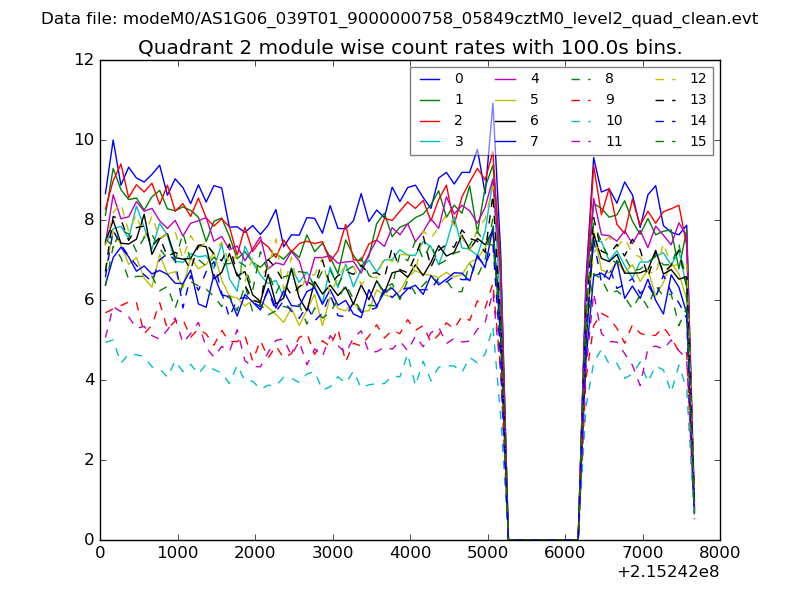 |
 |
| Module-wise count rates for Quadrant D Data is divided into 100 sec bins |
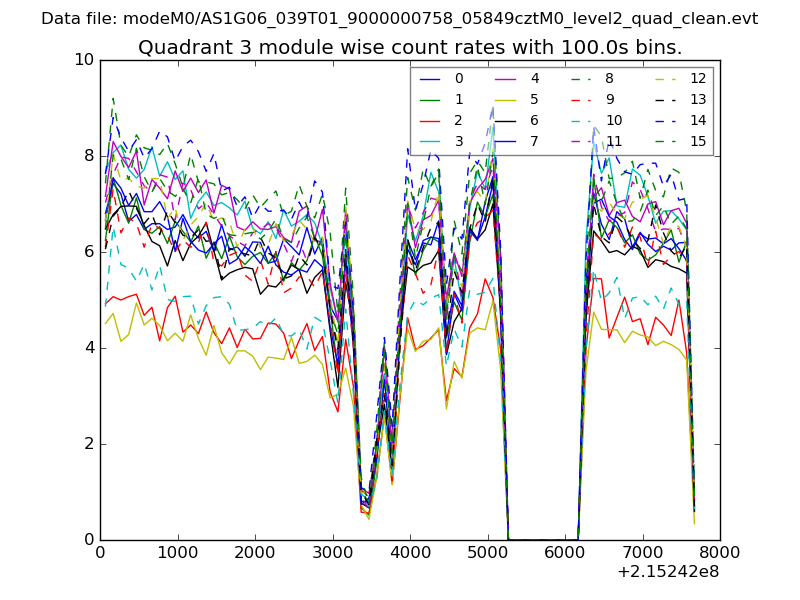 |
 |
| Parameter | Plot |
|---|---|
| CZT HV Monitor | 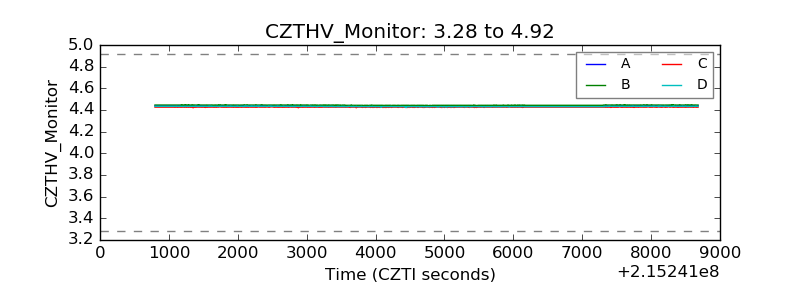 |
| D_VDD | 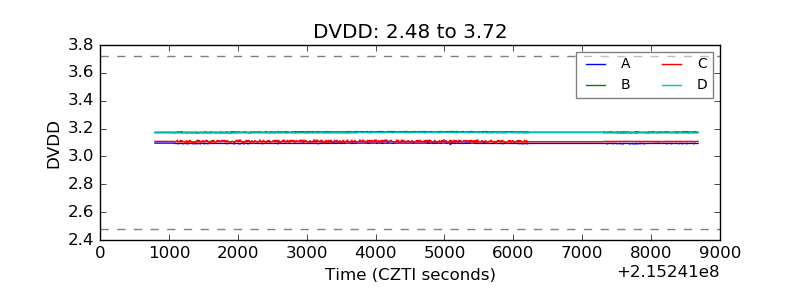 |
| Temperature 1 | 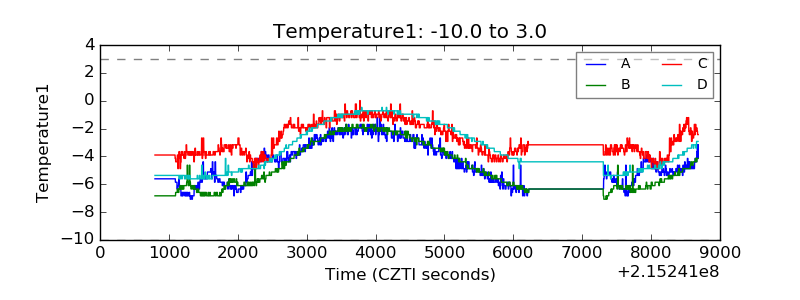 |
| Veto HV Monitor | 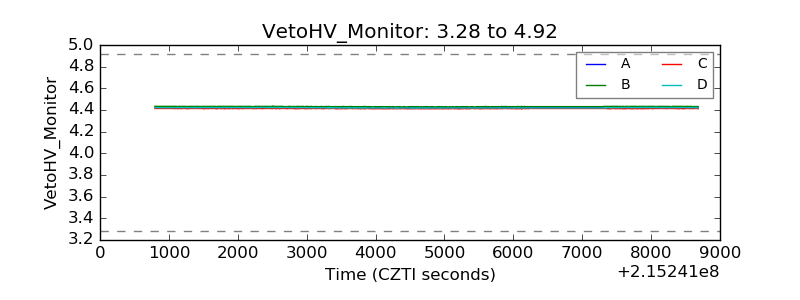 |
| Veto LLD |  |
| Alpha Counter | 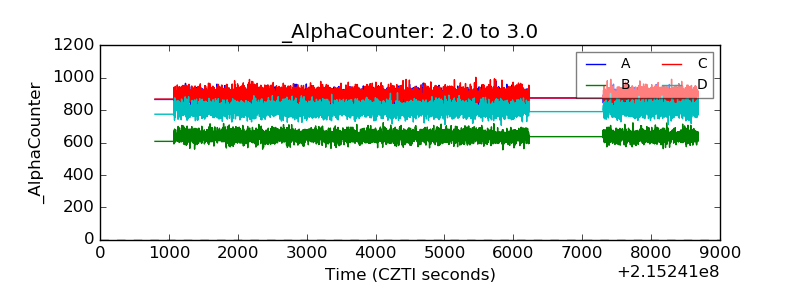 |
| _CPM_Rate | 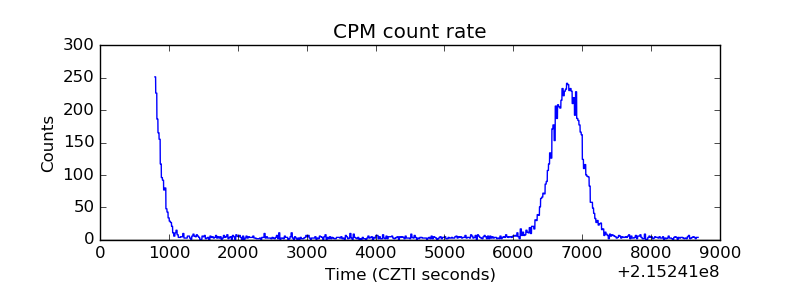 |
| CZT Counter | 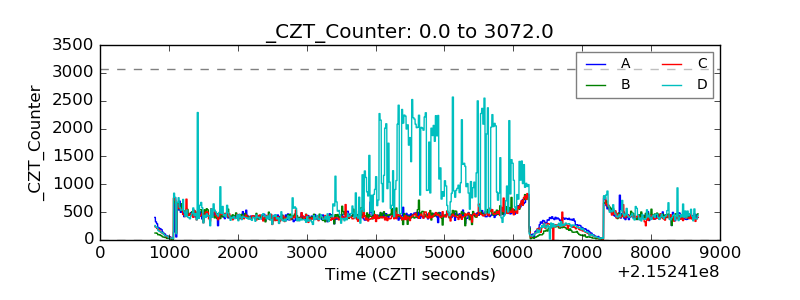 |
| +2.5 Volts monitor |  |
| +5 Volts monitor |  |
| _ROLL_ROT | 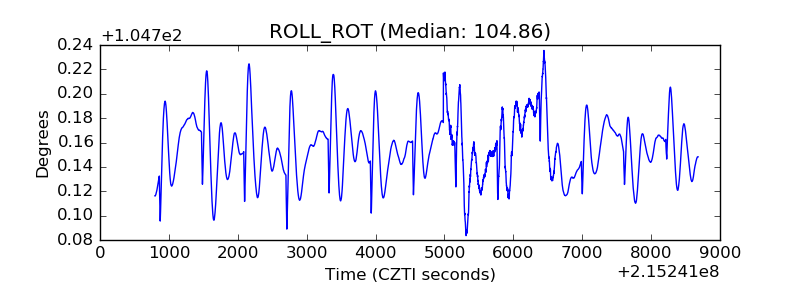 |
| _Roll_DEC | 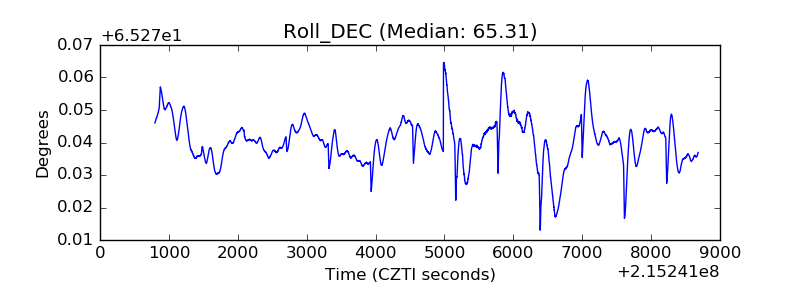 |
| _Roll_RA | 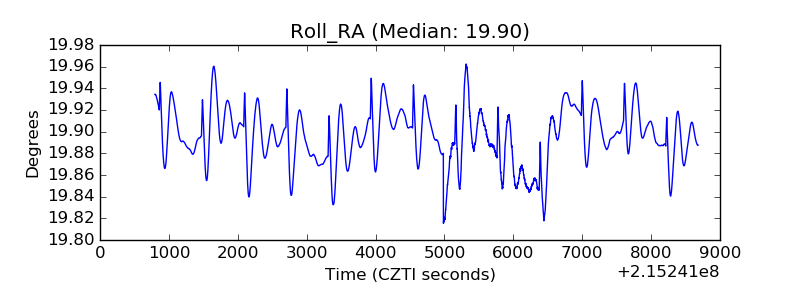 |
| Veto Counter | 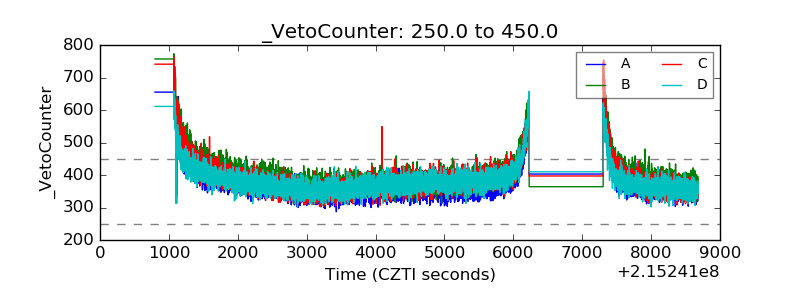 |