| Param | Original file | Final file |
|---|---|---|
| Filename | modeM0/AS1G06_039T01_9000000758_05850cztM0_level2.evt | modeM0/AS1G06_039T01_9000000758_05850cztM0_level2_quad_clean.evt |
| Size (bytes) | 464,785,920 | 113,215,680 |
| Size | 443.3 MB | 108.0 MB |
| Events in quadrant A | 3,141,730 | 751,941 |
| Events in quadrant B | 3,212,185 | 748,356 |
| Events in quadrant C | 3,057,886 | 742,127 |
| Events in quadrant D | 4,188,234 | 698,799 |
| Mode M0 | |||
|---|---|---|---|
| Quadrant | BADHDUFLAG | Total packets | Discarded packets |
| A | 0 | 14424 | 3 |
| B | 0 | 14434 | 2 |
| C | 0 | 14372 | 2 |
| D | 0 | 17460 | 2 |
| Mode SS | |||
|---|---|---|---|
| Quadrant | BADHDUFLAG | Total packets | Discarded packets |
| A | 0 | 140 | 0 |
| B | 0 | 140 | 0 |
| C | 0 | 140 | 0 |
| D | 0 | 140 | 0 |
| Mode M9 | |||
|---|---|---|---|
| Quadrant | BADHDUFLAG | Total packets | Discarded packets |
| A | 0 | 7 | 0 |
| B | 0 | 7 | 0 |
| C | 0 | 7 | 0 |
| D | 0 | 7 | 0 |
| Quadrant | Total seconds | Saturated seconds | Saturation percentage |
|---|---|---|---|
| A | 7005 | 152 | 2.169879% |
| B | 7005 | 175 | 2.498216% |
| C | 7005 | 112 | 1.598858% |
| D | 7006 | 244 | 3.482729% |
Noise dominated data is calculated using 1-second bins in cleaned event files. If a bin has >2000 counts, and if more than 50% of those come from <1% of pixels, then it is considered to be noise-dominated and hence unusable.
| Quadrant | # 1 sec bins | Bins with >0 counts | Bins with >2000 counts | High rate bins dominated by noise | Noise dominated (total time) | Noise dominated (detector-on time) | Marked lightcurve |
|---|---|---|---|---|---|---|---|
| A | 7685 | 7006 | 4 | 4 | 0.05% | 0.06% | 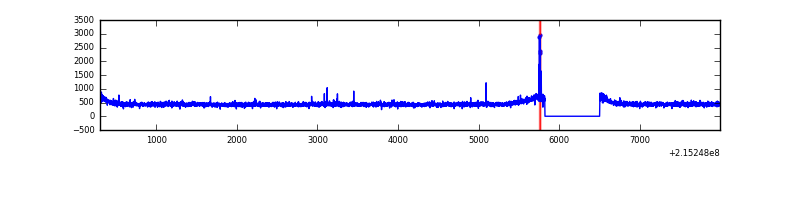 |
| B | 7685 | 7006 | 1 | 1 | 0.01% | 0.01% | 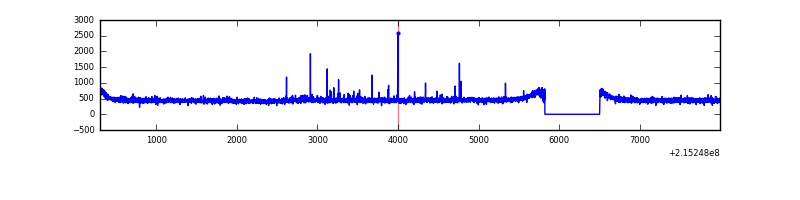 |
| C | 7685 | 7006 | 0 | 0 | 0.00% | 0.00% | 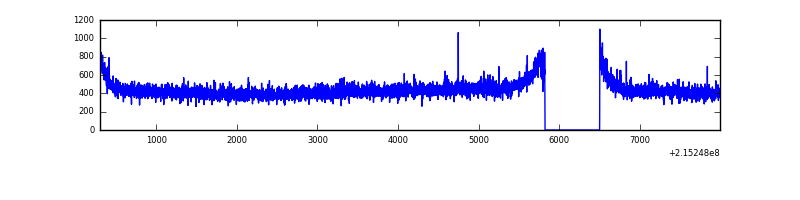 |
| D | 7686 | 7007 | 106 | 106 | 1.38% | 1.51% | 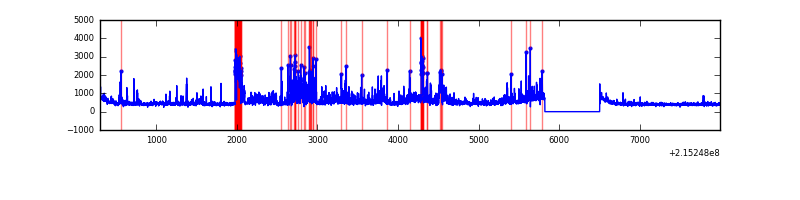 |
Top three noisy pixels from each quadrant. If the there are fewer than three noisy pixels in the level2.evt file, extra rows are filled as -1
| Pixel properties | Quadrant properties | ||||||
|---|---|---|---|---|---|---|---|
| Quadrant | DetID | PixID | Counts | Sigma | Mean | Median | Sigma |
| A | 15 | 234 | 32373 | 193.56 | 805 | 787 | 163.2 |
| A | 13 | 251 | 8802 | 49.12 | 805 | 787 | 163.2 |
| A | 0 | 226 | 7952 | 43.91 | 805 | 787 | 163.2 |
| B | 15 | 204 | 29626 | 186.04 | 809 | 787 | 155.0 |
| B | 15 | 85 | 17115 | 105.33 | 809 | 787 | 155.0 |
| B | 12 | 111 | 14471 | 88.27 | 809 | 787 | 155.0 |
| C | 1 | 16 | 14278 | 75.58 | 776 | 779 | 178.6 |
| C | 12 | 4 | 8259 | 41.88 | 776 | 779 | 178.6 |
| C | 13 | 61 | 6320 | 31.02 | 776 | 779 | 178.6 |
| D | 1 | 239 | 491315 | 2625.67 | 768 | 743 | 186.8 |
| D | 2 | 152 | 452988 | 2420.53 | 768 | 743 | 186.8 |
| D | 12 | 233 | 176769 | 942.14 | 768 | 743 | 186.8 |
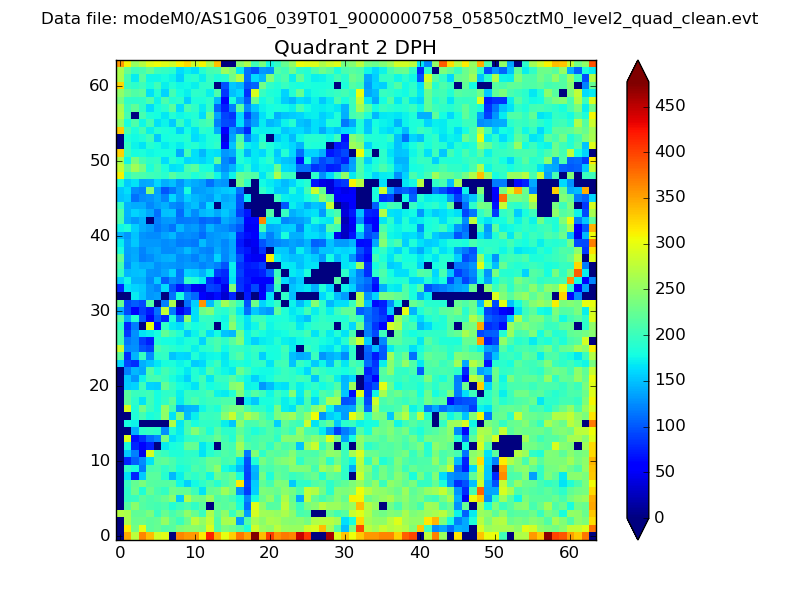
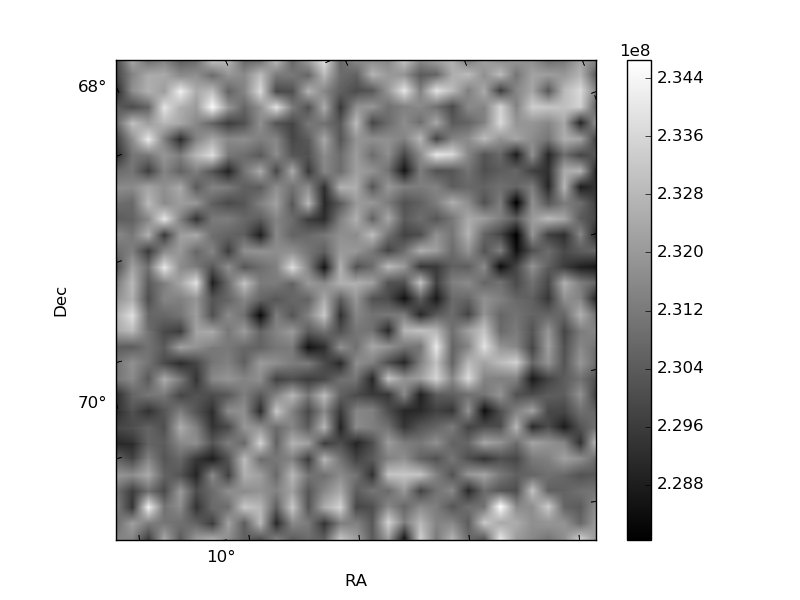
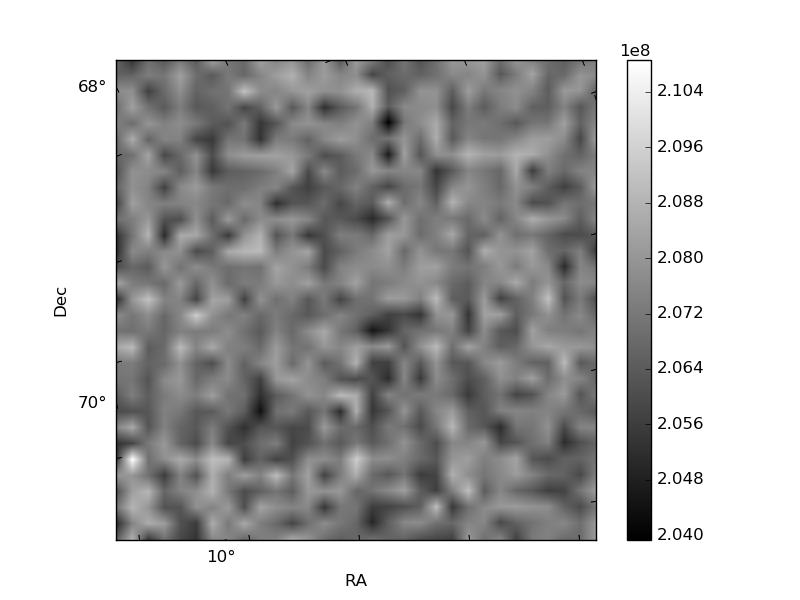
Histogram calculated using DETX and DETY for each event in the final _common_clean file
| Quadrant A | 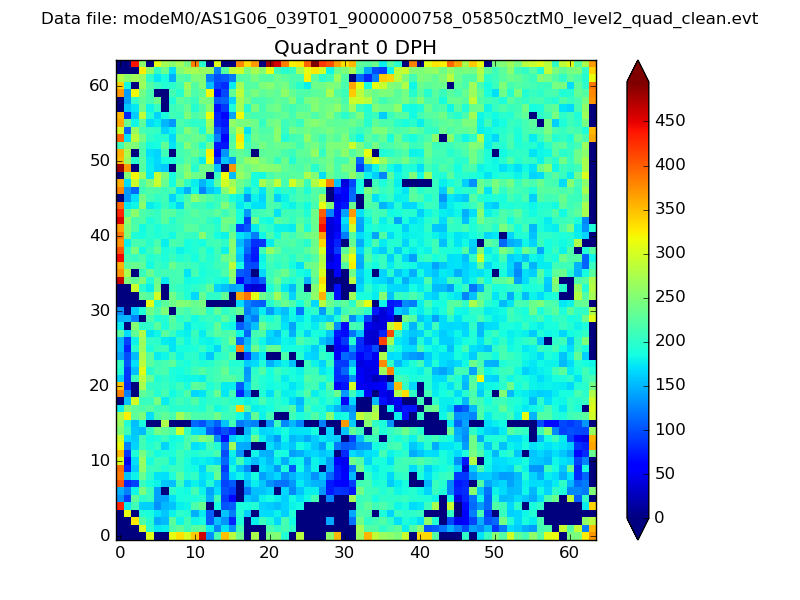 |
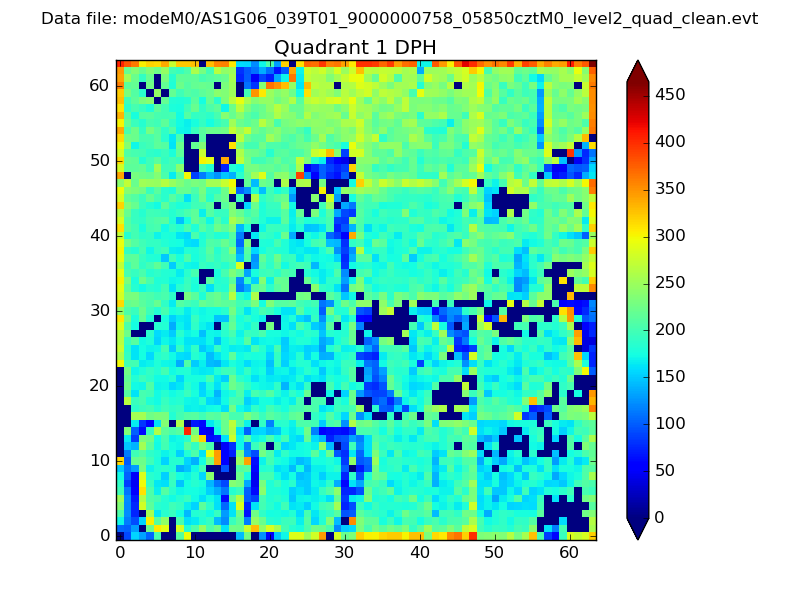 |
Quadrant B |
|---|---|---|---|
| Quadrant D | 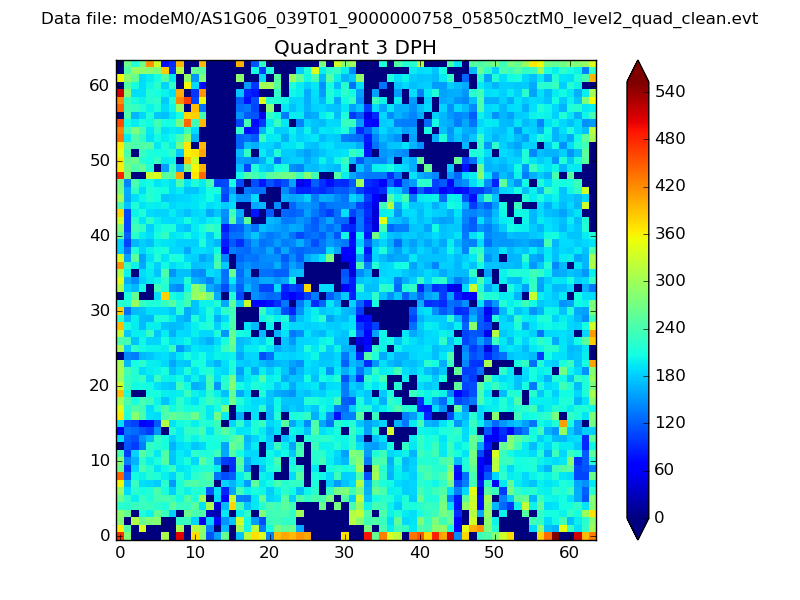 |
 |
Quadrant C |
| Plot type | Count rate plots | Images |
|---|---|---|
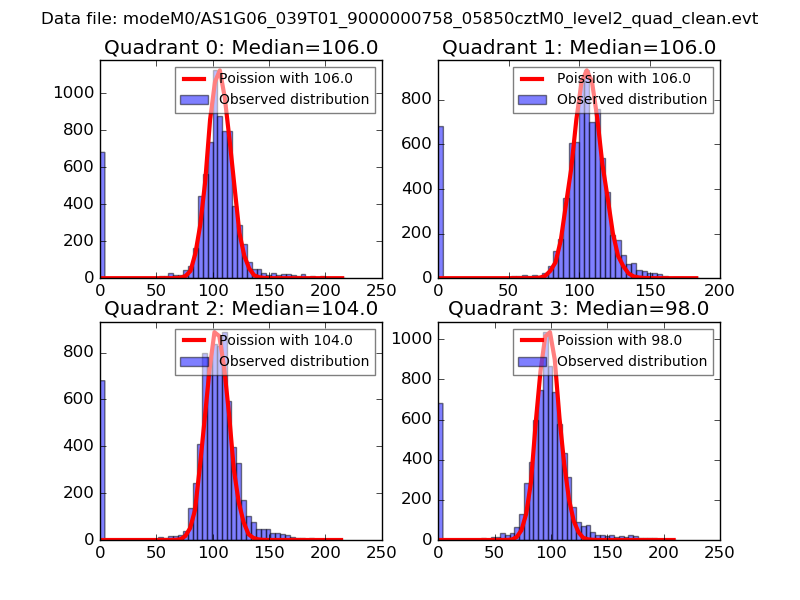
| Comparison with Poisson distribution Blue bars denote a histogram of data divided into 1 sec bins. Red curve is a Poisson curve with rate = median count rate of data. |
 |
 |
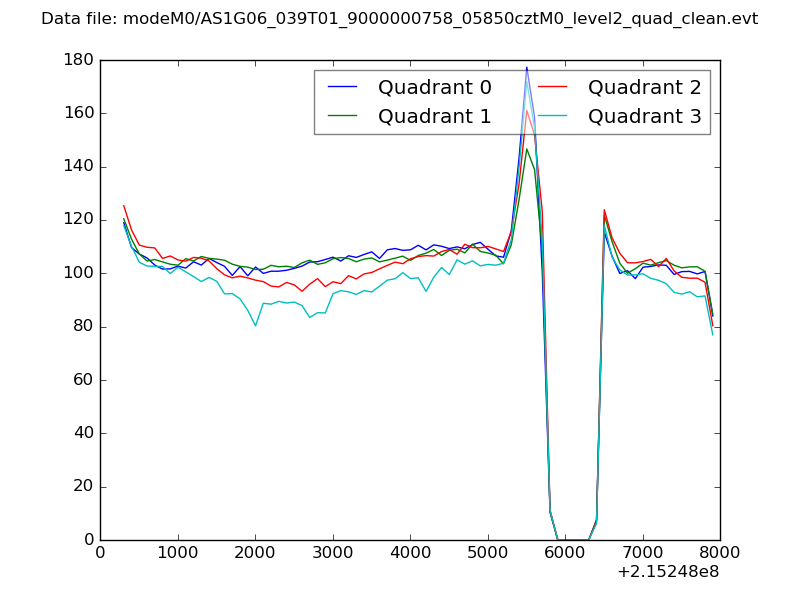
| Quadrant-wise count rates Data is divided into 100 sec bins |
 |
|
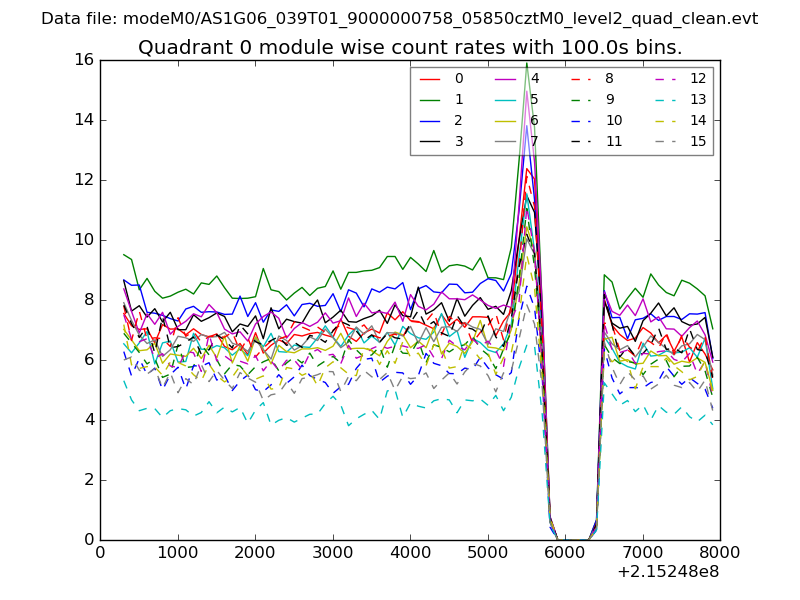
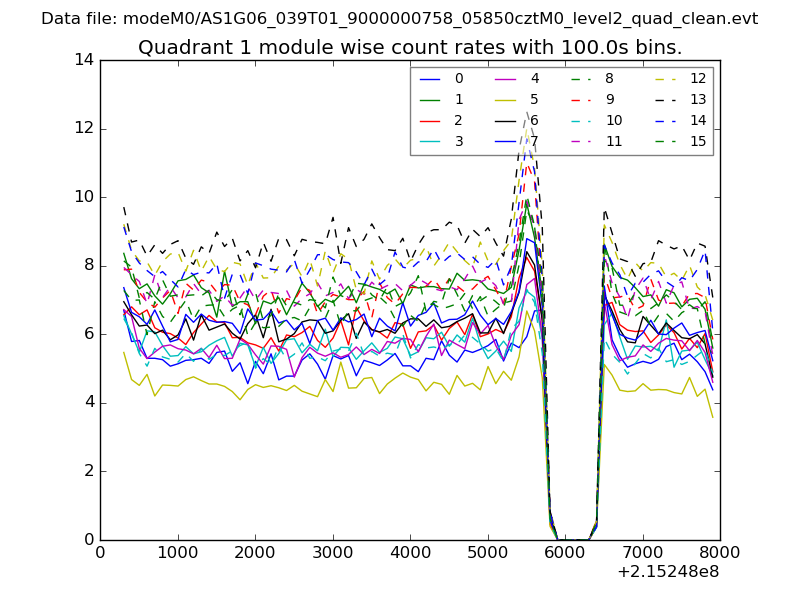
| Module-wise count rates for Quadrant A Data is divided into 100 sec bins |
 |
 |
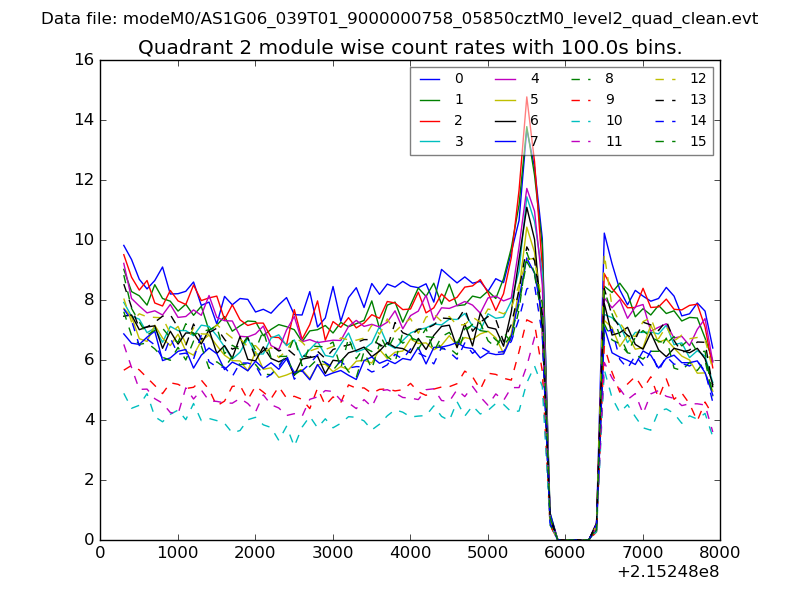
| Module-wise count rates for Quadrant B Data is divided into 100 sec bins |
 |
 |
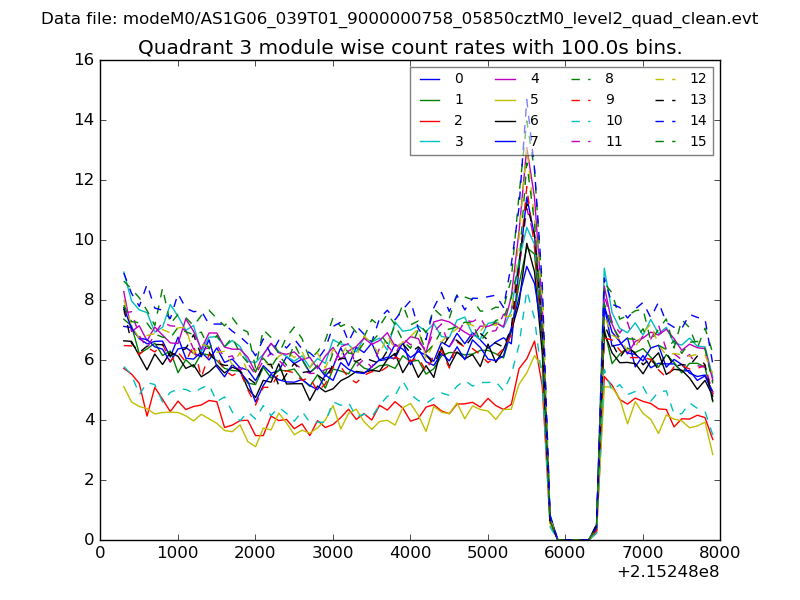
| Module-wise count rates for Quadrant C Data is divided into 100 sec bins |
 |
 |
| Module-wise count rates for Quadrant D Data is divided into 100 sec bins |
 |
 |
| Parameter | Plot |
|---|---|
| CZT HV Monitor | 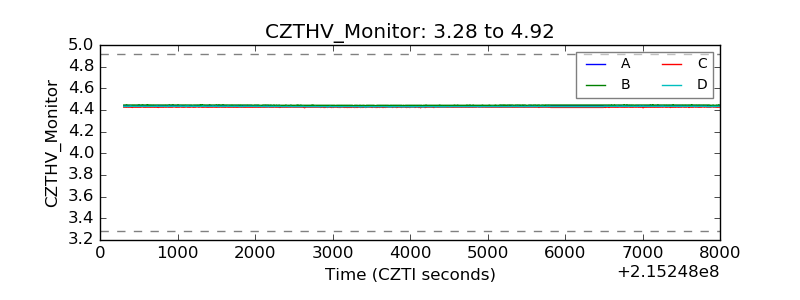 |
| D_VDD | 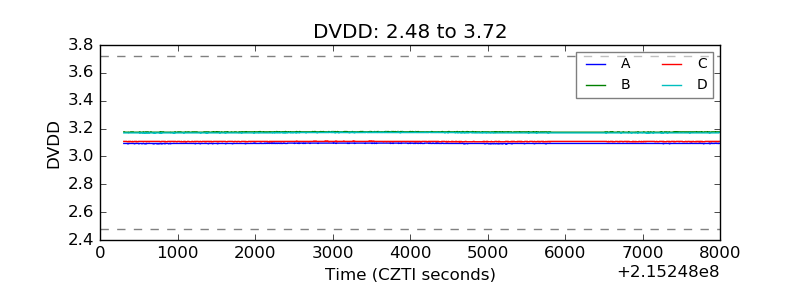 |
| Temperature 1 | 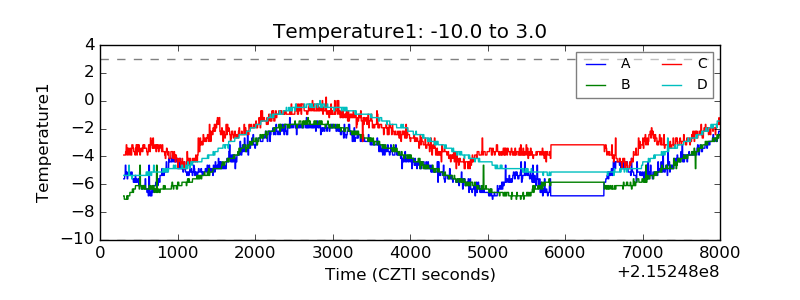 |
| Veto HV Monitor | 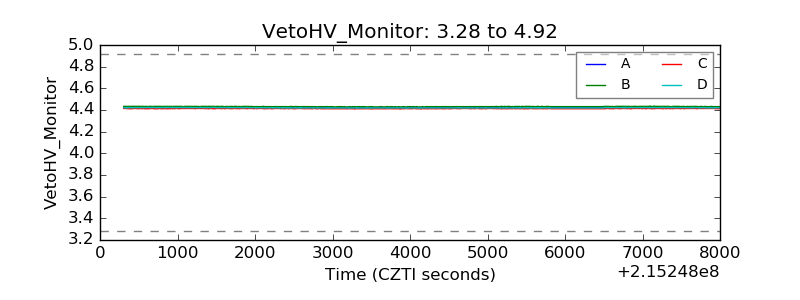 |
| Veto LLD | 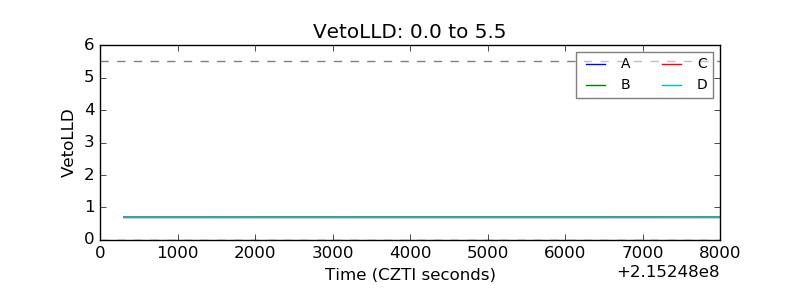 |
| Alpha Counter | 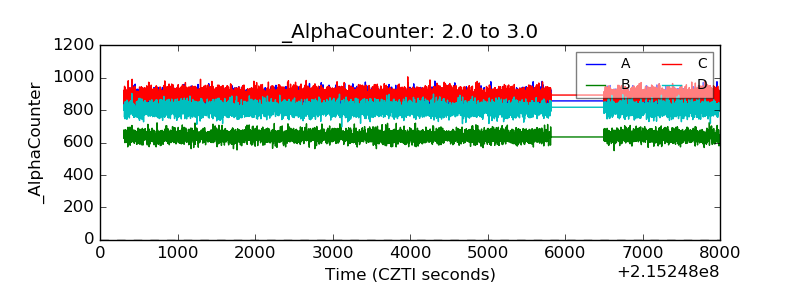 |
| _CPM_Rate | 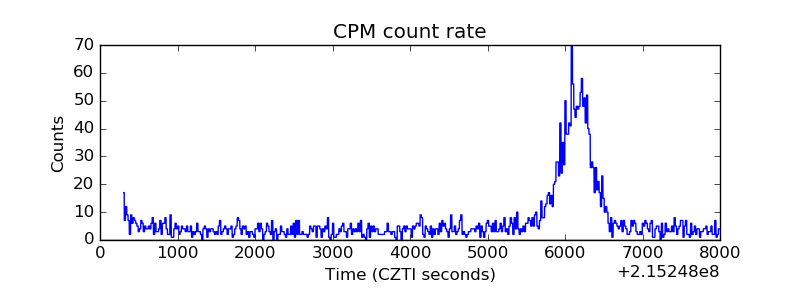 |
| CZT Counter | 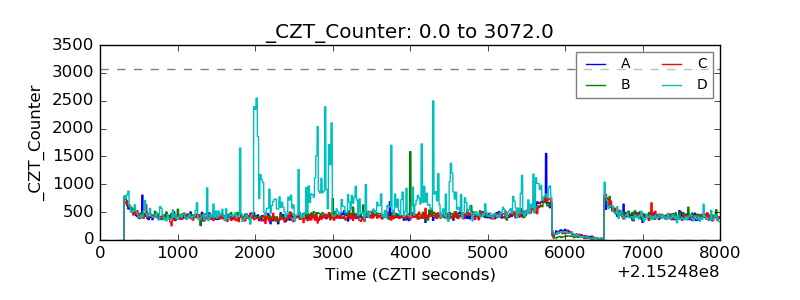 |
| +2.5 Volts monitor |  |
| +5 Volts monitor |  |
| _ROLL_ROT | 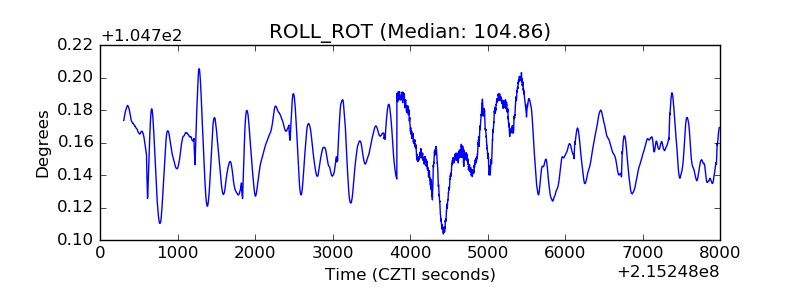 |
| _Roll_DEC | 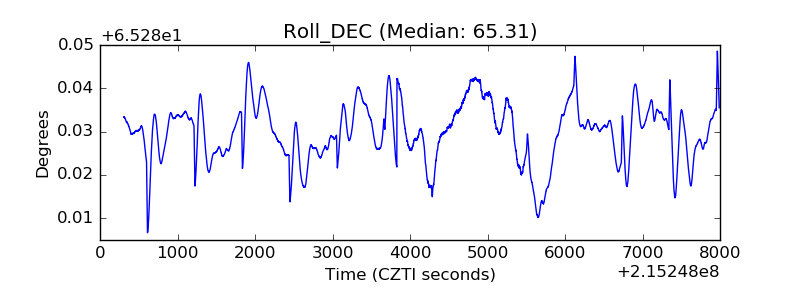 |
| _Roll_RA | 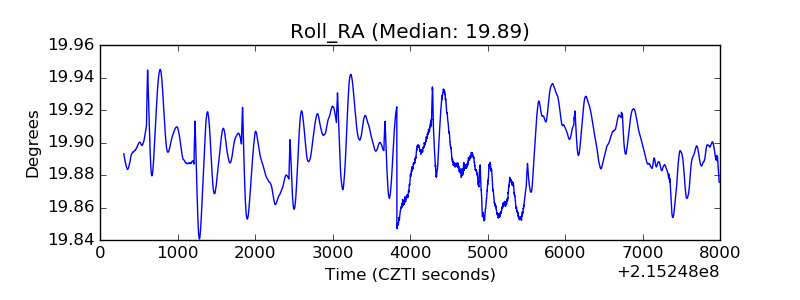 |
| Veto Counter | 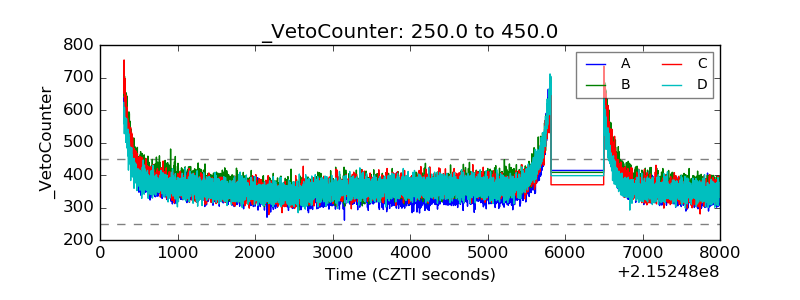 |