| Param | Original file | Final file |
|---|---|---|
| Filename | modeM0/AS1G06_039T01_9000000758_05851cztM0_level2.evt | modeM0/AS1G06_039T01_9000000758_05851cztM0_level2_quad_clean.evt |
| Size (bytes) | 496,906,560 | 122,348,160 |
| Size | 473.9 MB | 116.7 MB |
| Events in quadrant A | 3,421,116 | 806,904 |
| Events in quadrant B | 3,629,480 | 807,402 |
| Events in quadrant C | 3,354,702 | 797,194 |
| Events in quadrant D | 4,115,859 | 754,148 |
| Mode M0 | |||
|---|---|---|---|
| Quadrant | BADHDUFLAG | Total packets | Discarded packets |
| A | 0 | 15867 | 2 |
| B | 0 | 16079 | 1 |
| C | 0 | 15875 | 1 |
| D | 0 | 17855 | 1 |
| Mode SS | |||
|---|---|---|---|
| Quadrant | BADHDUFLAG | Total packets | Discarded packets |
| A | 0 | 156 | 0 |
| B | 0 | 156 | 0 |
| C | 0 | 156 | 0 |
| D | 0 | 156 | 0 |
| Mode M9 | |||
|---|---|---|---|
| Quadrant | BADHDUFLAG | Total packets | Discarded packets |
| A | 0 | 1 | 0 |
| B | 0 | 1 | 0 |
| C | 0 | 1 | 0 |
| D | 0 | 1 | 0 |
| Quadrant | Total seconds | Saturated seconds | Saturation percentage |
|---|---|---|---|
| A | 7764 | 224 | 2.885111% |
| B | 7764 | 232 | 2.988150% |
| C | 7764 | 170 | 2.189593% |
| D | 7764 | 227 | 2.923751% |
Noise dominated data is calculated using 1-second bins in cleaned event files. If a bin has >2000 counts, and if more than 50% of those come from <1% of pixels, then it is considered to be noise-dominated and hence unusable.
| Quadrant | # 1 sec bins | Bins with >0 counts | Bins with >2000 counts | High rate bins dominated by noise | Noise dominated (total time) | Noise dominated (detector-on time) | Marked lightcurve |
|---|---|---|---|---|---|---|---|
| A | 7874 | 7766 | 0 | 0 | 0.00% | 0.00% | 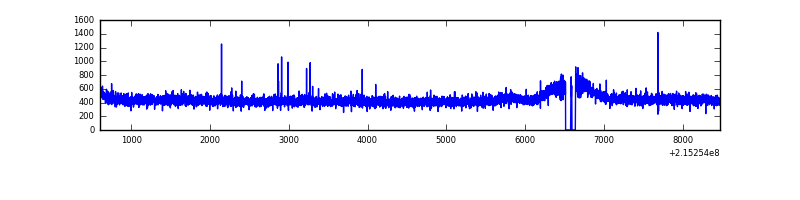 |
| B | 7874 | 7766 | 0 | 0 | 0.00% | 0.00% | 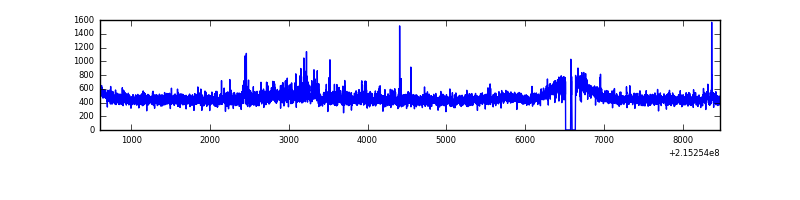 |
| C | 7874 | 7766 | 0 | 0 | 0.00% | 0.00% | 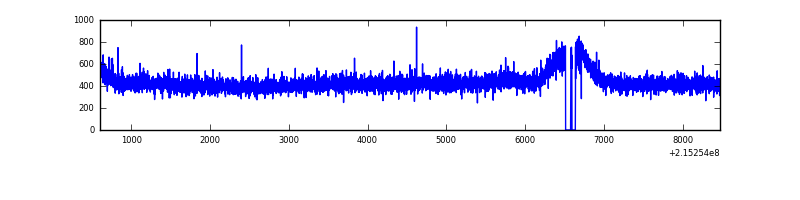 |
| D | 7874 | 7766 | 46 | 46 | 0.58% | 0.59% | 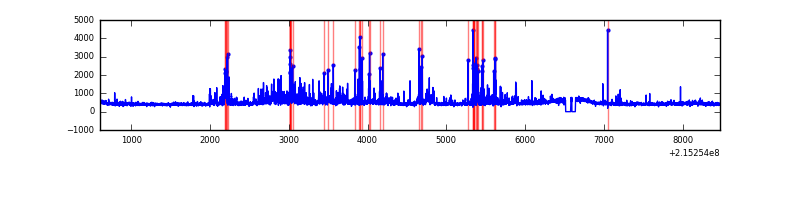 |
Top three noisy pixels from each quadrant. If the there are fewer than three noisy pixels in the level2.evt file, extra rows are filled as -1
| Pixel properties | Quadrant properties | ||||||
|---|---|---|---|---|---|---|---|
| Quadrant | DetID | PixID | Counts | Sigma | Mean | Median | Sigma |
| A | 12 | 194 | 8713 | 43.53 | 886 | 866 | 180.3 |
| A | 0 | 226 | 8552 | 42.63 | 886 | 866 | 180.3 |
| A | 15 | 234 | 8232 | 40.86 | 886 | 866 | 180.3 |
| B | 15 | 204 | 94399 | 550.29 | 891 | 867 | 170.0 |
| B | 0 | 219 | 34075 | 195.38 | 891 | 867 | 170.0 |
| B | 4 | 48 | 20274 | 114.18 | 891 | 867 | 170.0 |
| C | 1 | 16 | 12955 | 61.35 | 854 | 855 | 197.2 |
| C | 13 | 61 | 6981 | 31.06 | 854 | 855 | 197.2 |
| C | 8 | 222 | 2910 | 10.42 | 854 | 855 | 197.2 |
| D | 1 | 239 | 647306 | 3115.52 | 848 | 819 | 207.5 |
| D | 2 | 152 | 115485 | 552.59 | 848 | 819 | 207.5 |
| D | 9 | 85 | 33946 | 159.64 | 848 | 819 | 207.5 |
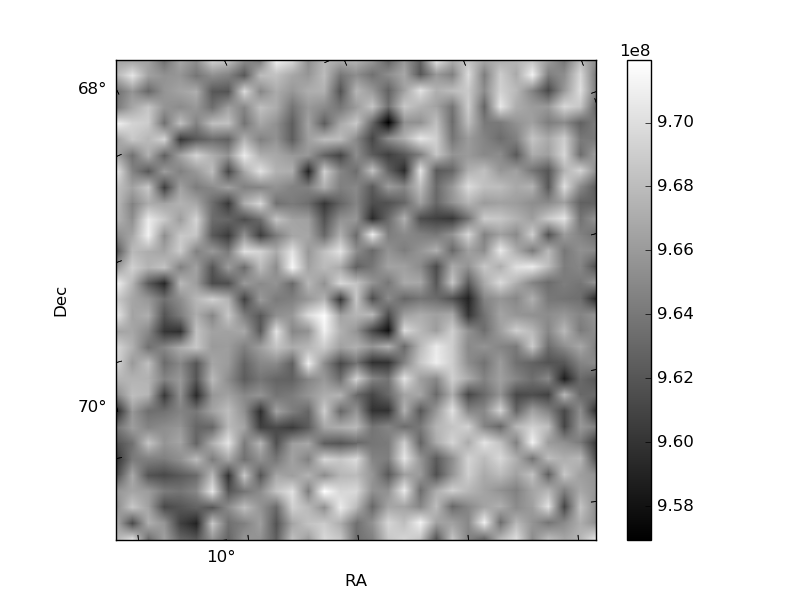
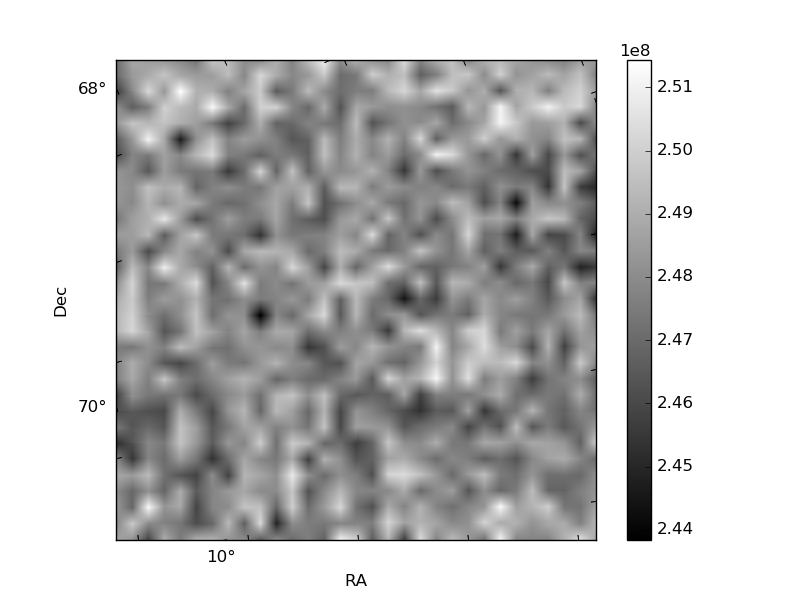
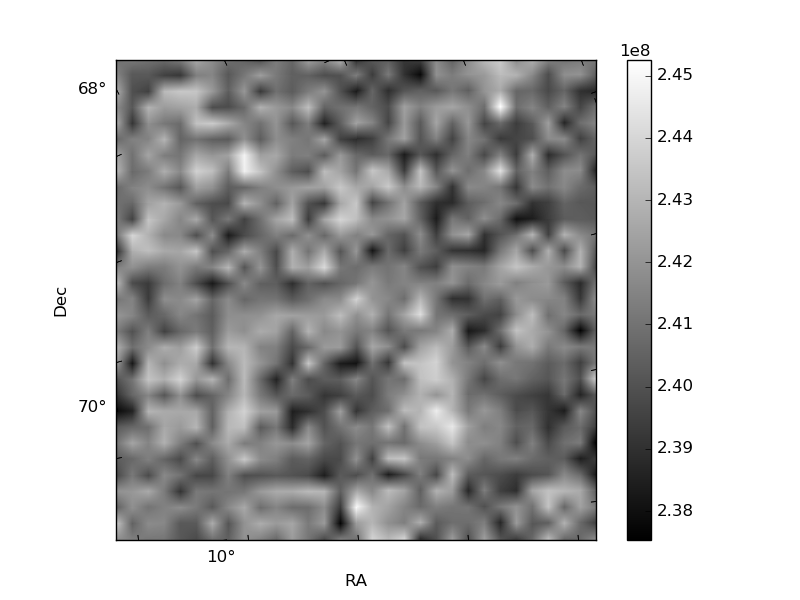
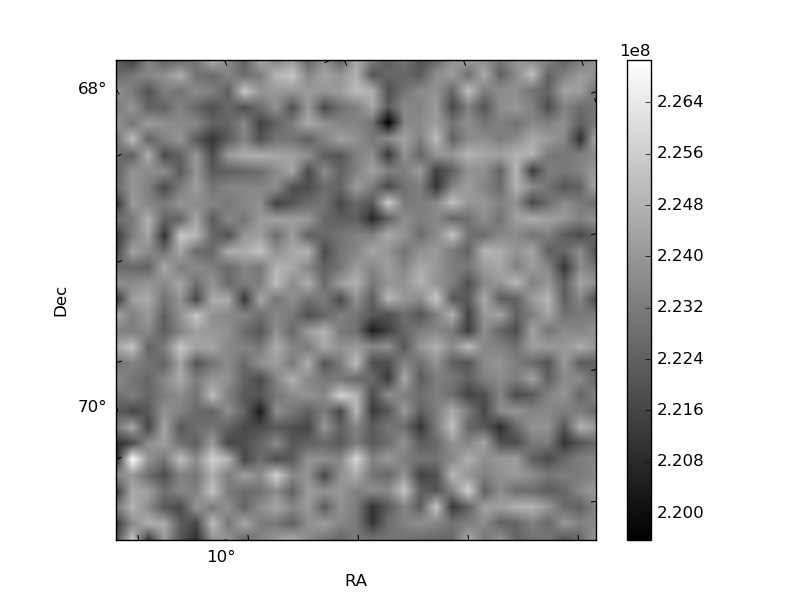
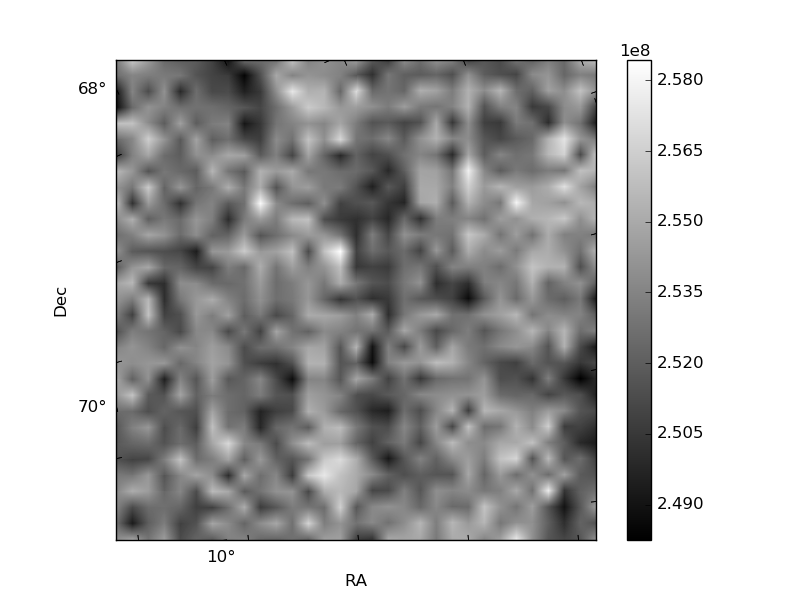
Histogram calculated using DETX and DETY for each event in the final _common_clean file
| Quadrant A | 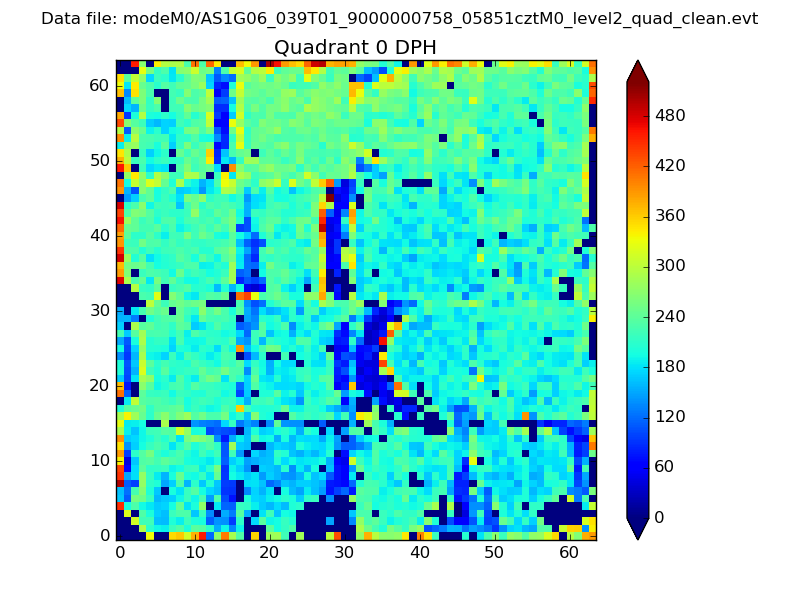 |
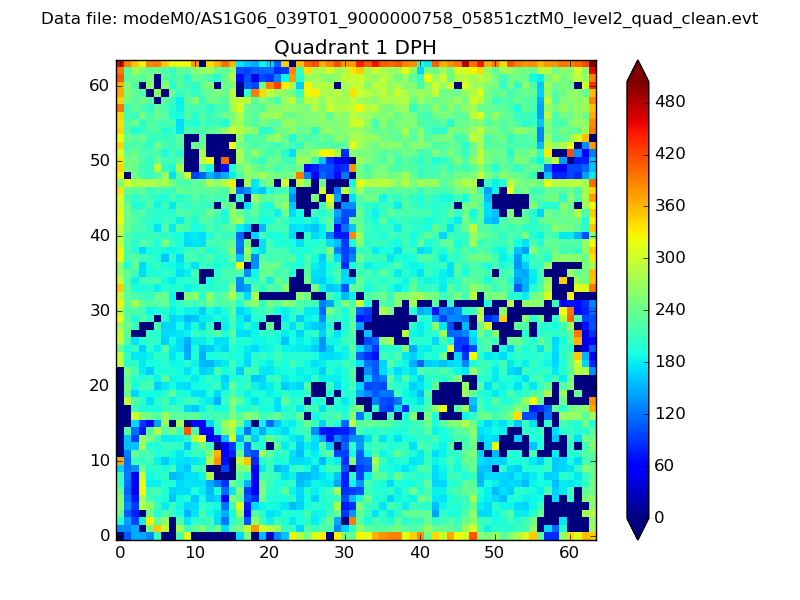 |
Quadrant B |
|---|---|---|---|
| Quadrant D | 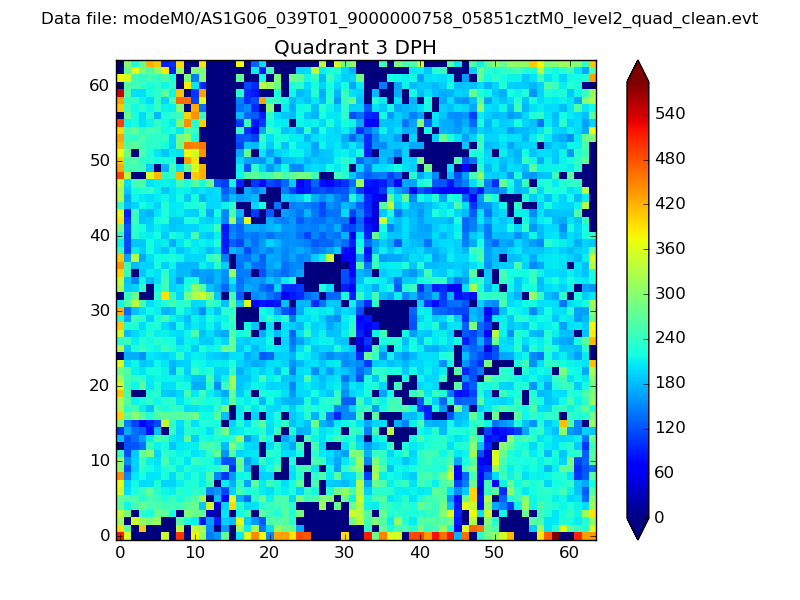 |
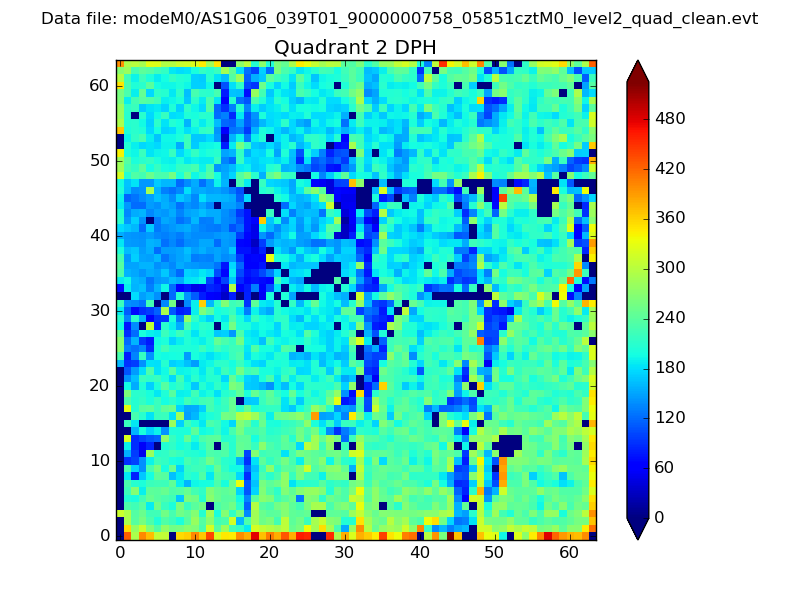 |
Quadrant C |
| Plot type | Count rate plots | Images |
|---|---|---|
| Comparison with Poisson distribution Blue bars denote a histogram of data divided into 1 sec bins. Red curve is a Poisson curve with rate = median count rate of data. |
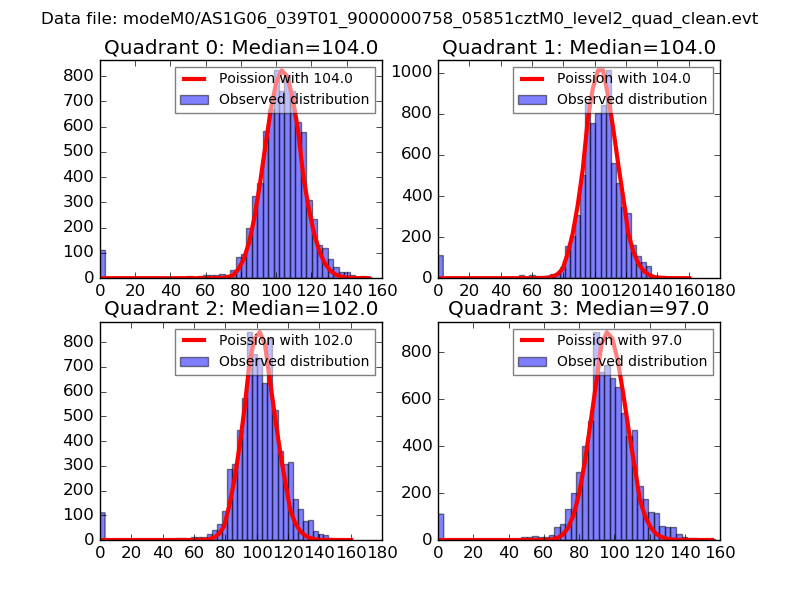 |
 |
| Quadrant-wise count rates Data is divided into 100 sec bins |
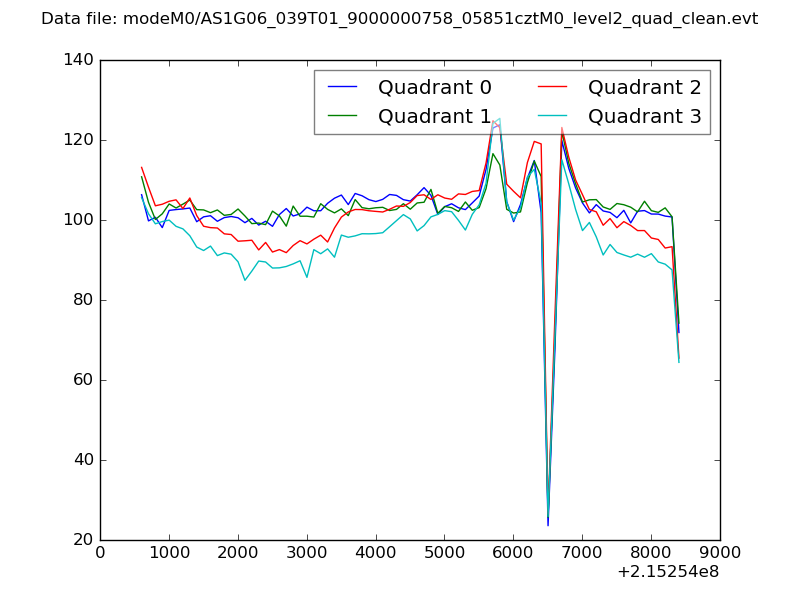 |
|
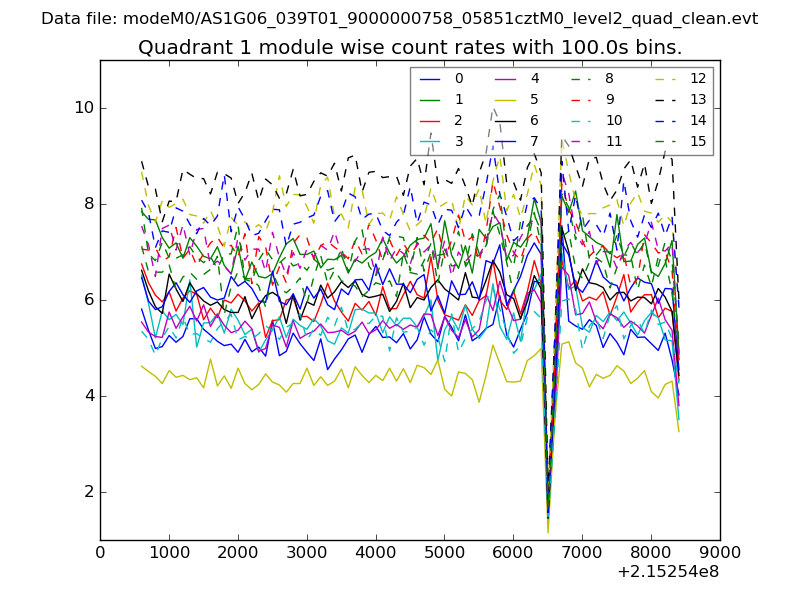
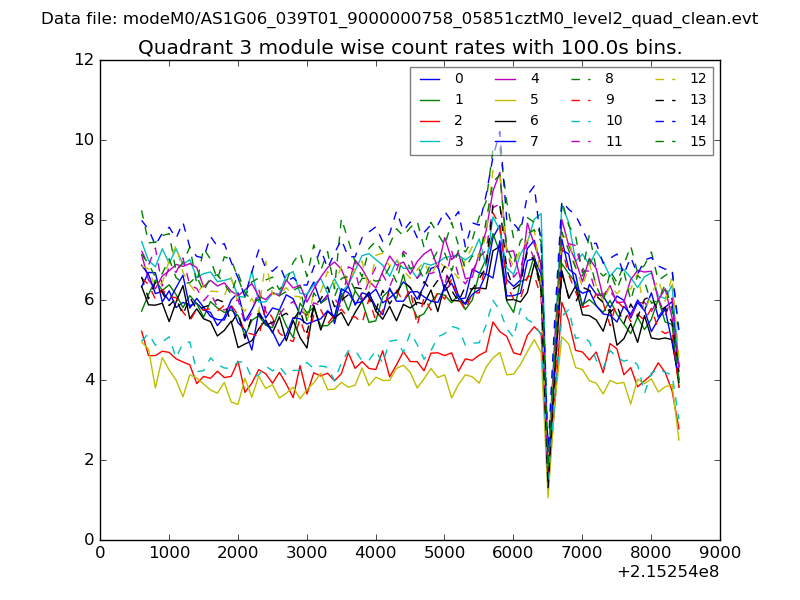
| Module-wise count rates for Quadrant A Data is divided into 100 sec bins |
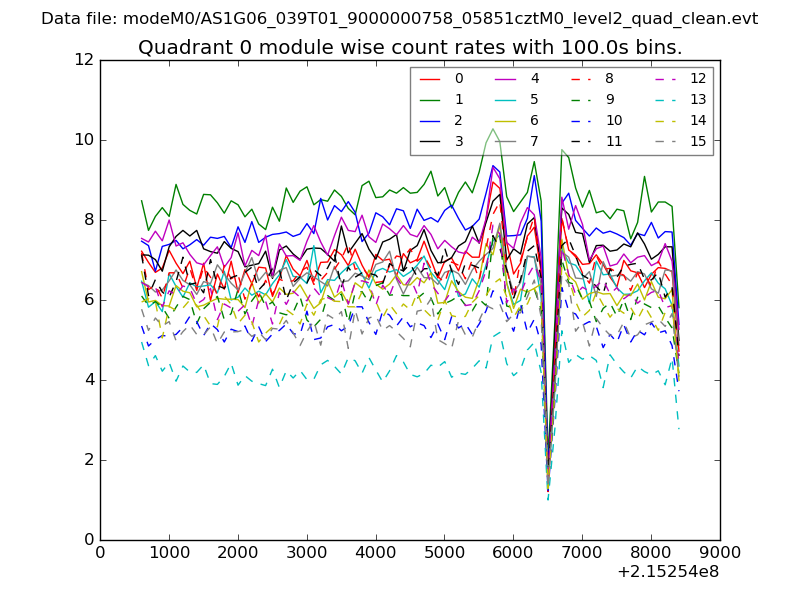 |
 |
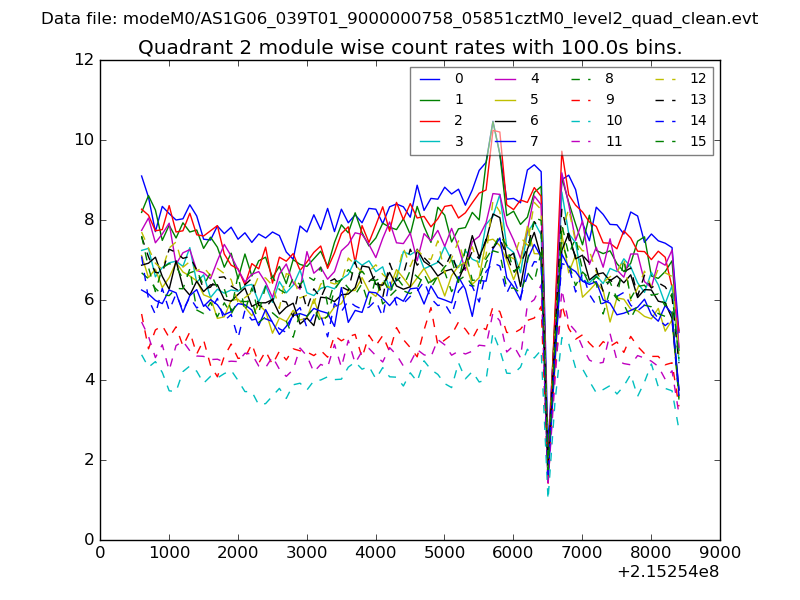
| Module-wise count rates for Quadrant B Data is divided into 100 sec bins |
 |
 |
| Module-wise count rates for Quadrant C Data is divided into 100 sec bins |
 |
 |
| Module-wise count rates for Quadrant D Data is divided into 100 sec bins |
 |
 |
| Parameter | Plot |
|---|---|
| CZT HV Monitor | 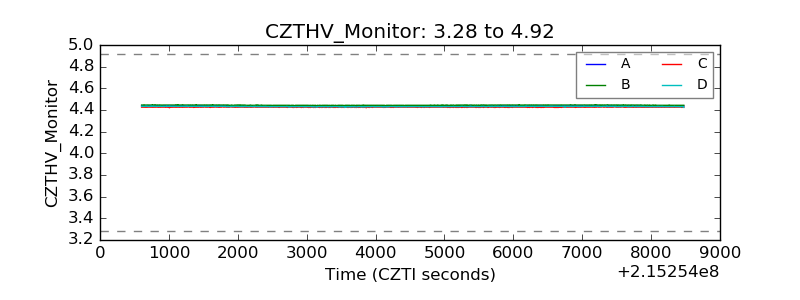 |
| D_VDD | 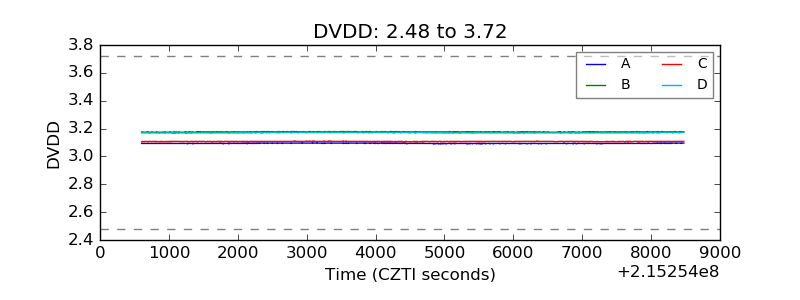 |
| Temperature 1 | 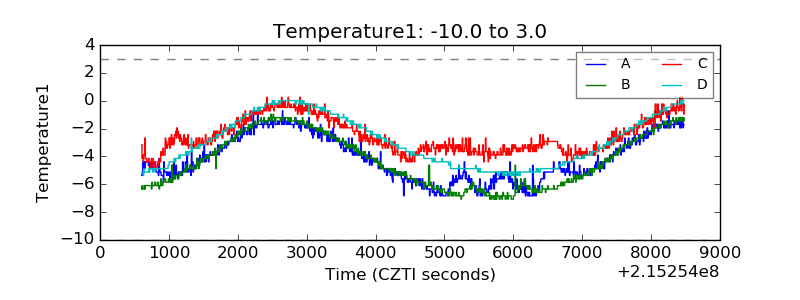 |
| Veto HV Monitor | 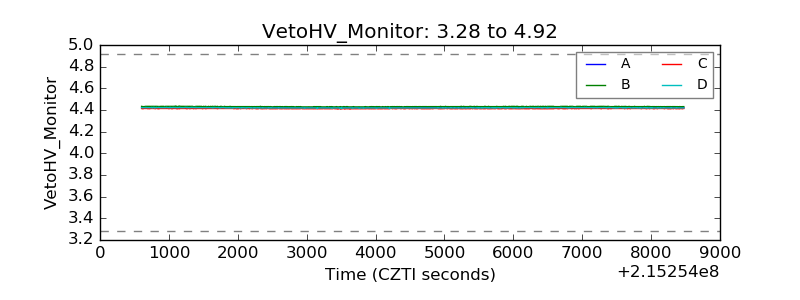 |
| Veto LLD | 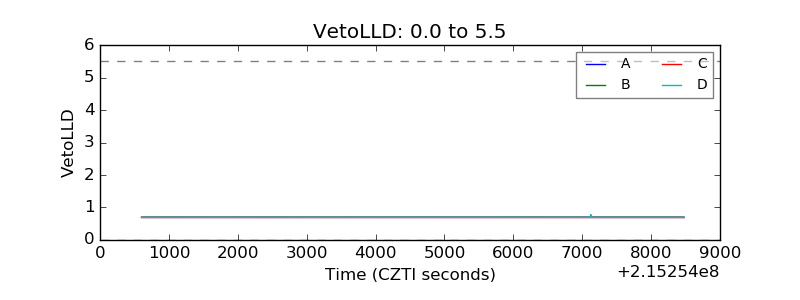 |
| Alpha Counter | 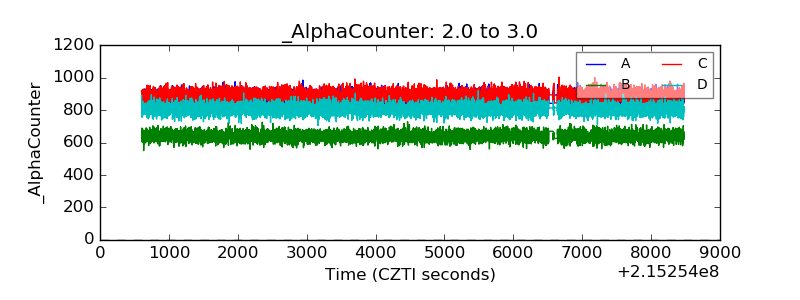 |
| _CPM_Rate | 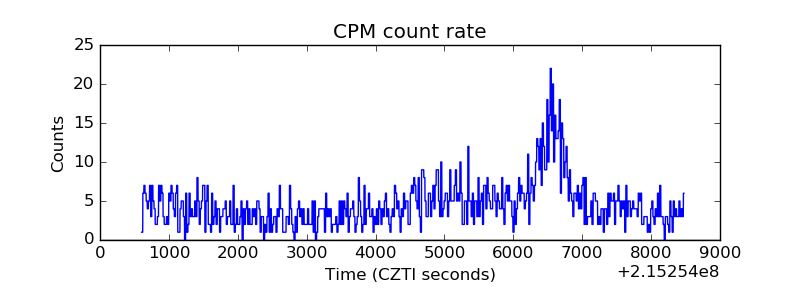 |
| CZT Counter | 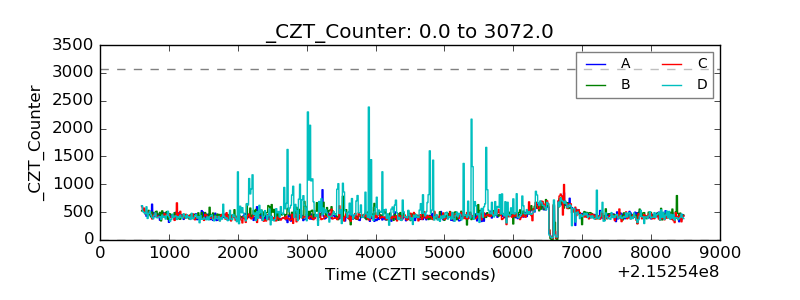 |
| +2.5 Volts monitor |  |
| +5 Volts monitor |  |
| _ROLL_ROT | 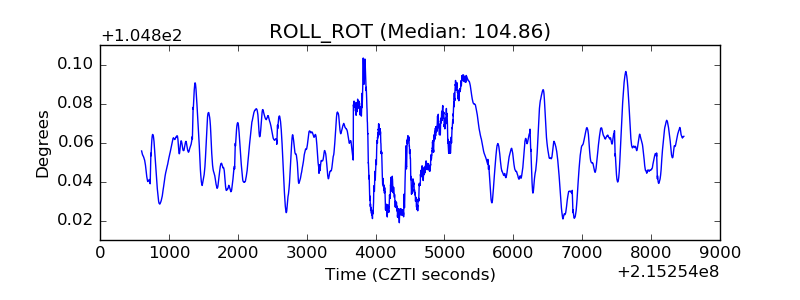 |
| _Roll_DEC | 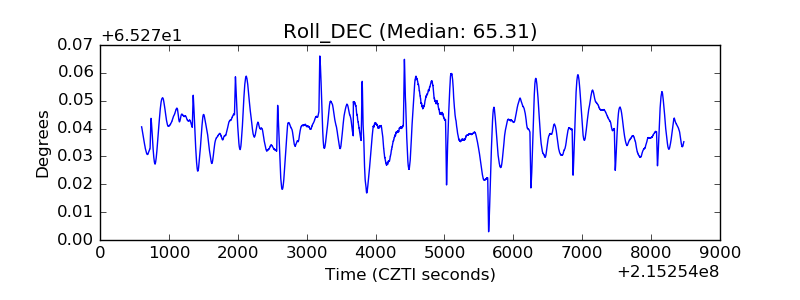 |
| _Roll_RA | 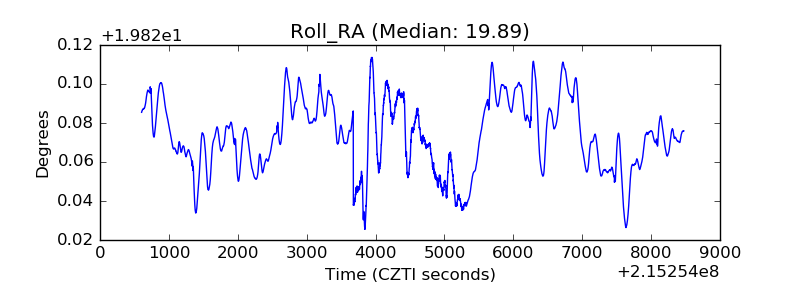 |
| Veto Counter | 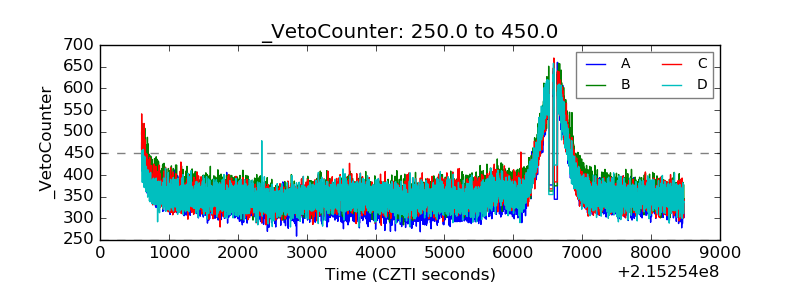 |