| Param | Original file | Final file |
|---|---|---|
| Filename | modeM0/AS1G06_039T01_9000000758_05852cztM0_level2.evt | modeM0/AS1G06_039T01_9000000758_05852cztM0_level2_quad_clean.evt |
| Size (bytes) | 481,458,240 | 110,059,200 |
| Size | 459.2 MB | 105.0 MB |
| Events in quadrant A | 3,139,142 | 729,794 |
| Events in quadrant B | 3,261,534 | 731,842 |
| Events in quadrant C | 3,049,343 | 714,611 |
| Events in quadrant D | 4,650,264 | 664,373 |
| Mode M0 | |||
|---|---|---|---|
| Quadrant | BADHDUFLAG | Total packets | Discarded packets |
| A | 0 | 14553 | 10 |
| B | 0 | 14610 | 7 |
| C | 0 | 14467 | 9 |
| D | 0 | 18883 | 33 |
| Mode SS | |||
|---|---|---|---|
| Quadrant | BADHDUFLAG | Total packets | Discarded packets |
| A | 0 | 142 | 0 |
| B | 0 | 142 | 0 |
| C | 0 | 142 | 0 |
| D | 0 | 142 | 0 |
| Quadrant | Total seconds | Saturated seconds | Saturation percentage |
|---|---|---|---|
| A | 7071 | 78 | 1.103097% |
| B | 7072 | 75 | 1.060520% |
| C | 7071 | 58 | 0.820252% |
| D | 7068 | 353 | 4.994341% |
Noise dominated data is calculated using 1-second bins in cleaned event files. If a bin has >2000 counts, and if more than 50% of those come from <1% of pixels, then it is considered to be noise-dominated and hence unusable.
| Quadrant | # 1 sec bins | Bins with >0 counts | Bins with >2000 counts | High rate bins dominated by noise | Noise dominated (total time) | Noise dominated (detector-on time) | Marked lightcurve |
|---|---|---|---|---|---|---|---|
| A | 7100 | 7076 | 3 | 3 | 0.04% | 0.04% | 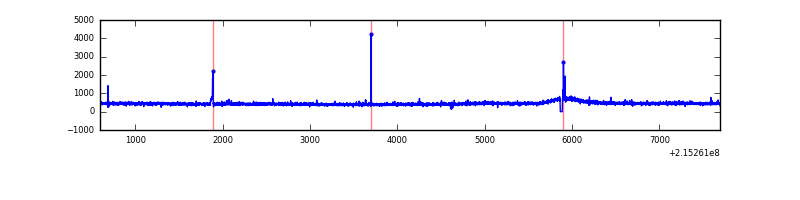 |
| B | 7100 | 7076 | 0 | 0 | 0.00% | 0.00% |  |
| C | 7100 | 7076 | 0 | 0 | 0.00% | 0.00% | 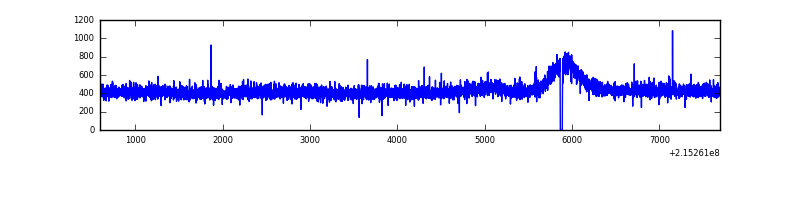 |
| D | 7100 | 7076 | 184 | 184 | 2.59% | 2.60% |  |
Top three noisy pixels from each quadrant. If the there are fewer than three noisy pixels in the level2.evt file, extra rows are filled as -1
| Pixel properties | Quadrant properties | ||||||
|---|---|---|---|---|---|---|---|
| Quadrant | DetID | PixID | Counts | Sigma | Mean | Median | Sigma |
| A | 15 | 234 | 29384 | 173.12 | 804 | 787 | 165.2 |
| A | 7 | 16 | 8164 | 44.66 | 804 | 787 | 165.2 |
| A | 12 | 194 | 7932 | 43.25 | 804 | 787 | 165.2 |
| B | 15 | 204 | 61511 | 392.13 | 809 | 788 | 154.9 |
| B | 0 | 219 | 19832 | 122.98 | 809 | 788 | 154.9 |
| B | 0 | 214 | 14669 | 89.64 | 809 | 788 | 154.9 |
| C | 13 | 61 | 6216 | 29.93 | 778 | 780 | 181.6 |
| C | 8 | 128 | 4983 | 23.14 | 778 | 780 | 181.6 |
| C | 1 | 16 | 3230 | 13.49 | 778 | 780 | 181.6 |
| D | 1 | 239 | 1406484 | 7435.35 | 762 | 736 | 189.1 |
| D | 2 | 152 | 124919 | 656.83 | 762 | 736 | 189.1 |
| D | 2 | 33 | 71436 | 373.95 | 762 | 736 | 189.1 |
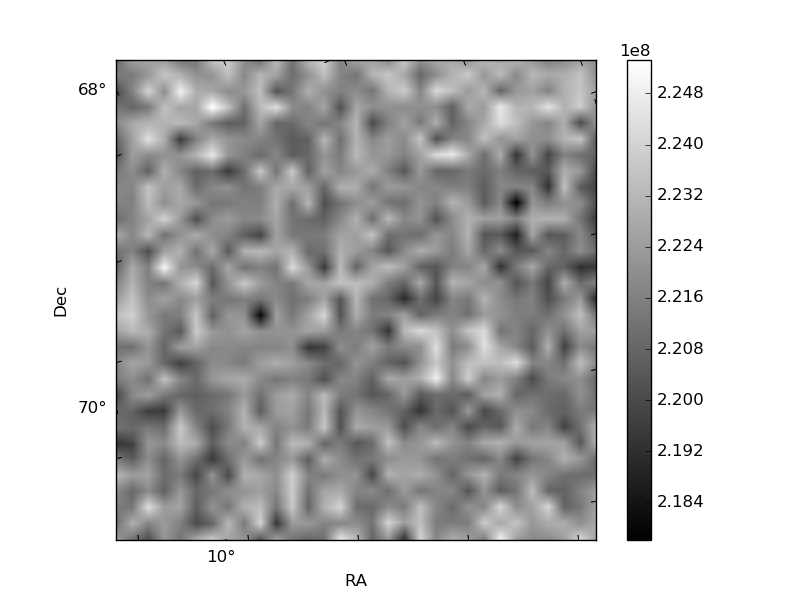
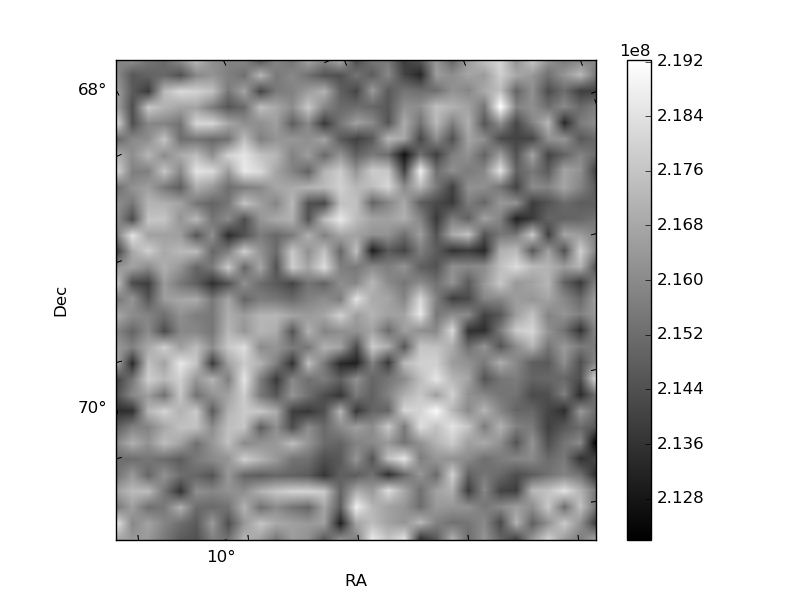
Histogram calculated using DETX and DETY for each event in the final _common_clean file
| Quadrant A | 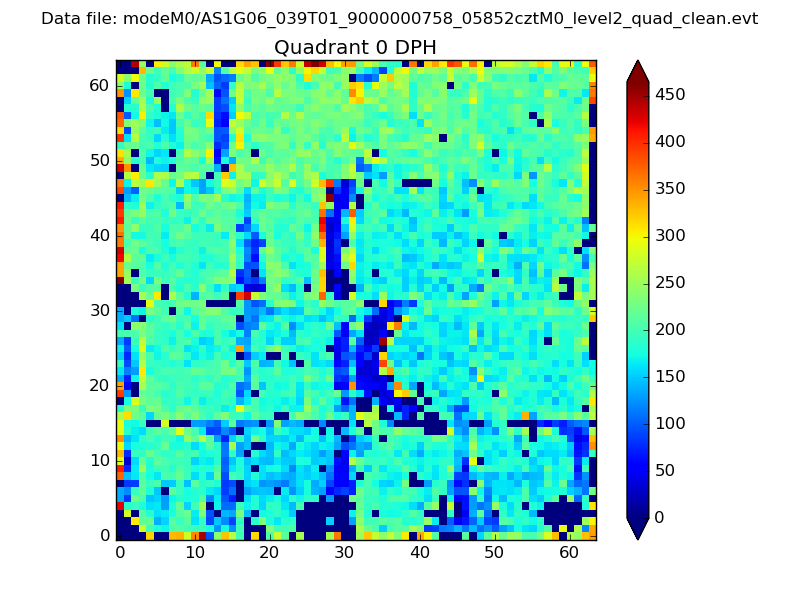 |
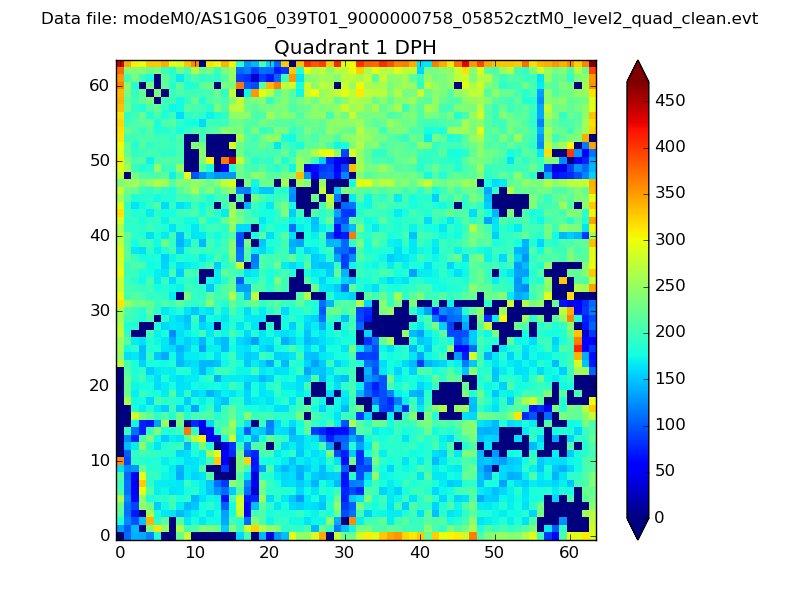 |
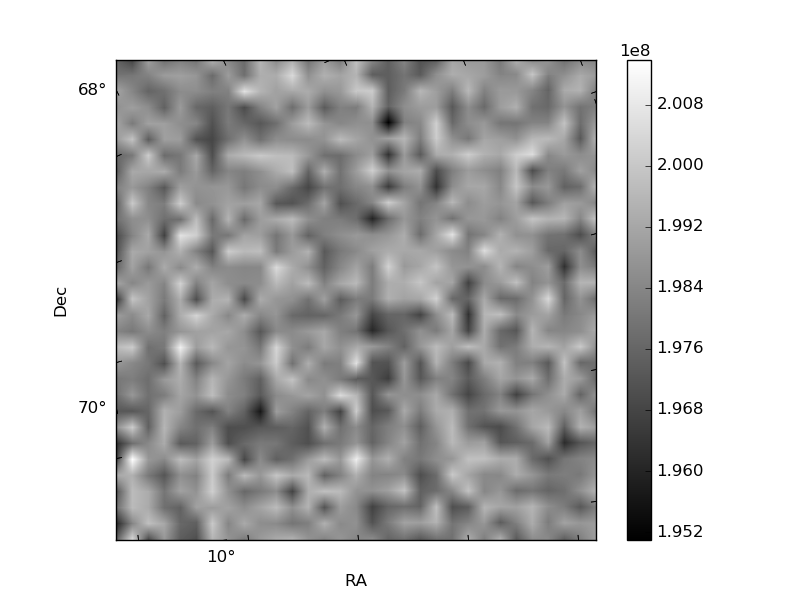
Quadrant B |
|---|---|---|---|
| Quadrant D |  |
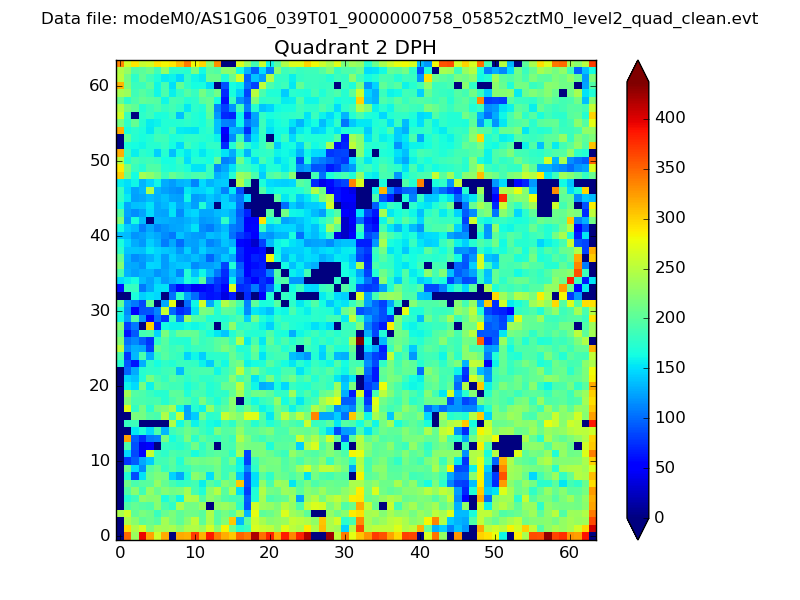 |
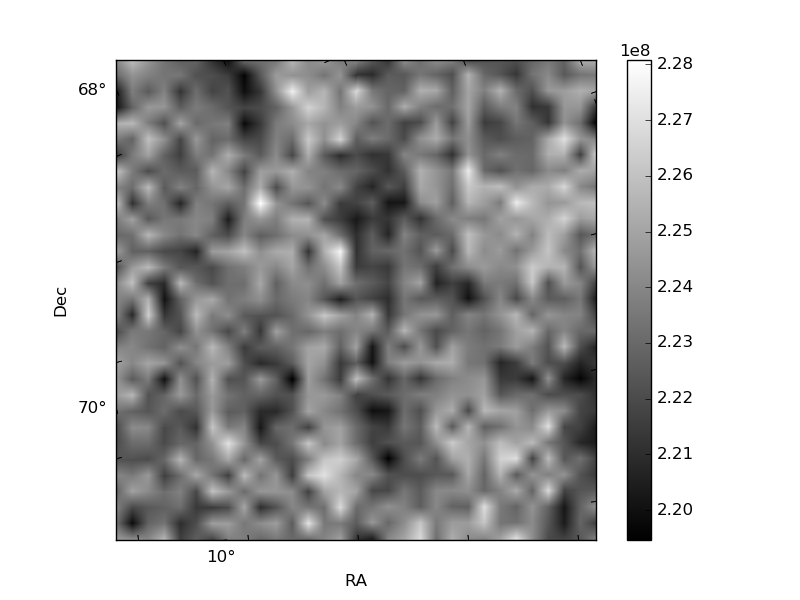
Quadrant C |
| Plot type | Count rate plots | Images |
|---|---|---|
| Comparison with Poisson distribution Blue bars denote a histogram of data divided into 1 sec bins. Red curve is a Poisson curve with rate = median count rate of data. |
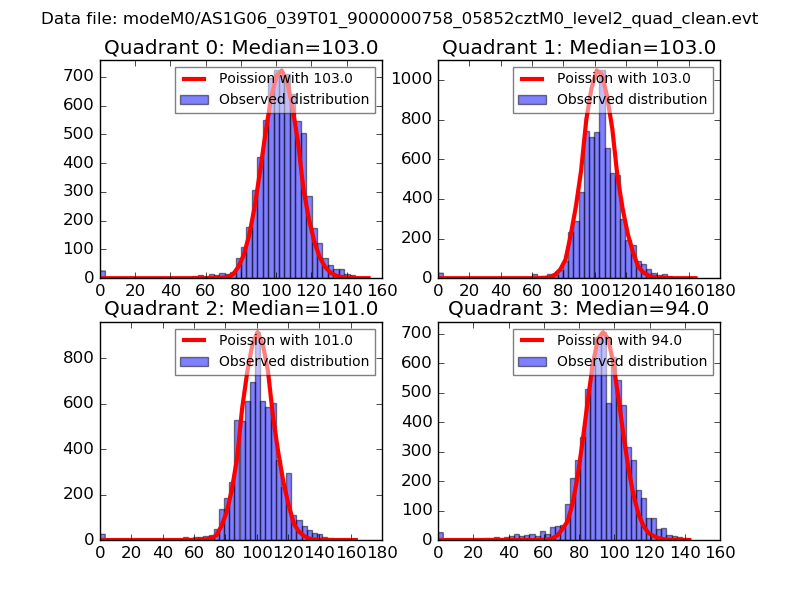 |
 |
| Quadrant-wise count rates Data is divided into 100 sec bins |
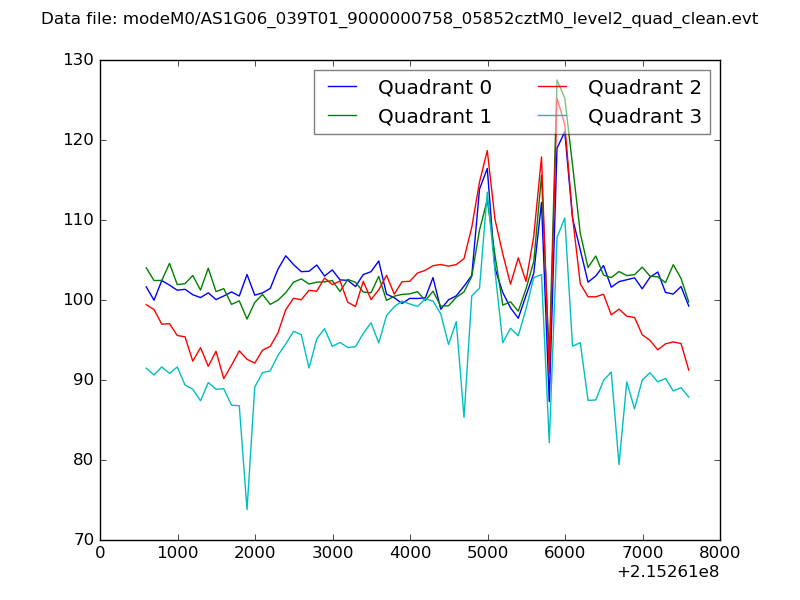 |
|
| Module-wise count rates for Quadrant A Data is divided into 100 sec bins |
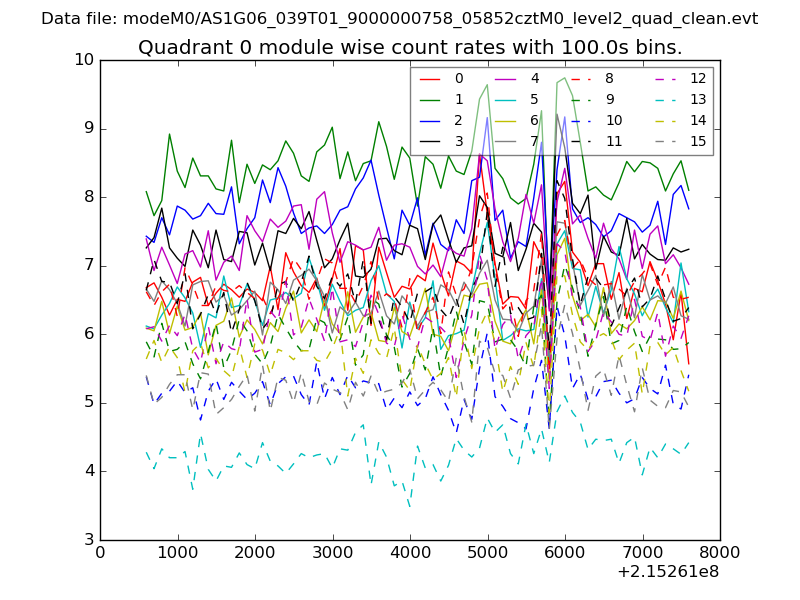 |
 |
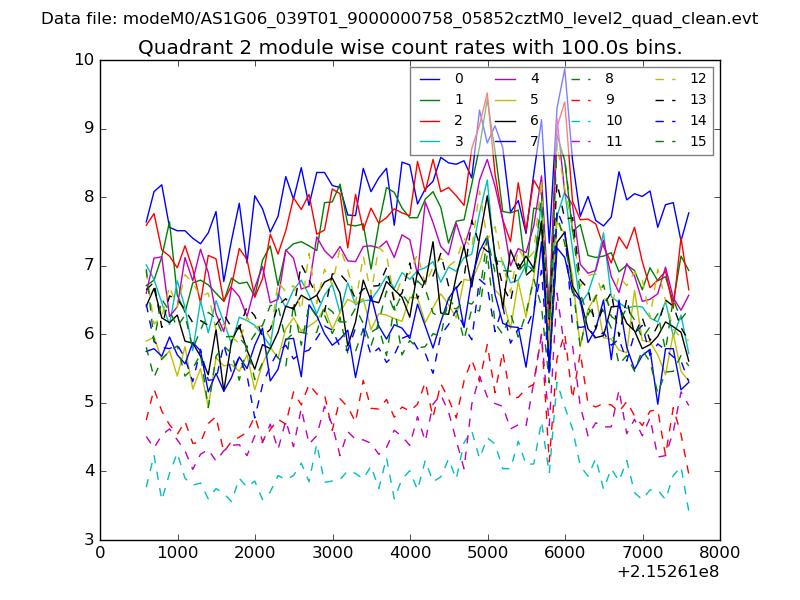
| Module-wise count rates for Quadrant B Data is divided into 100 sec bins |
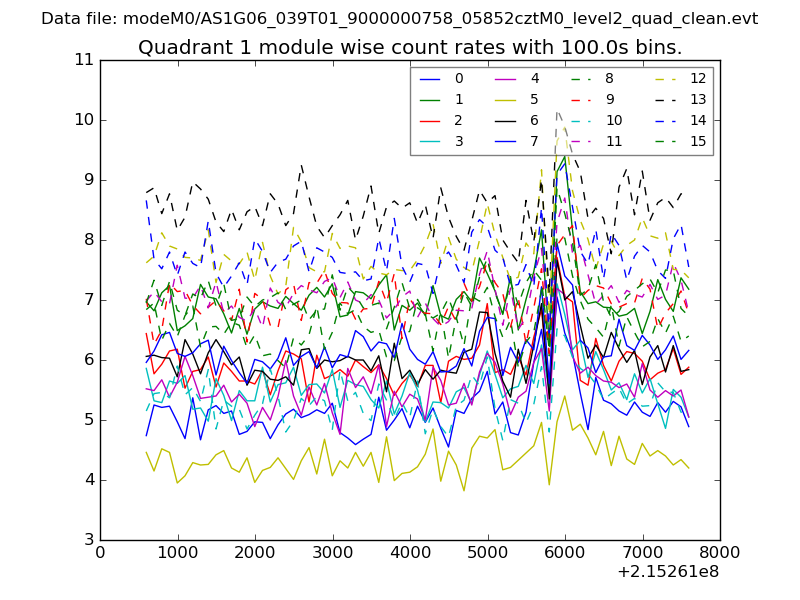 |
 |
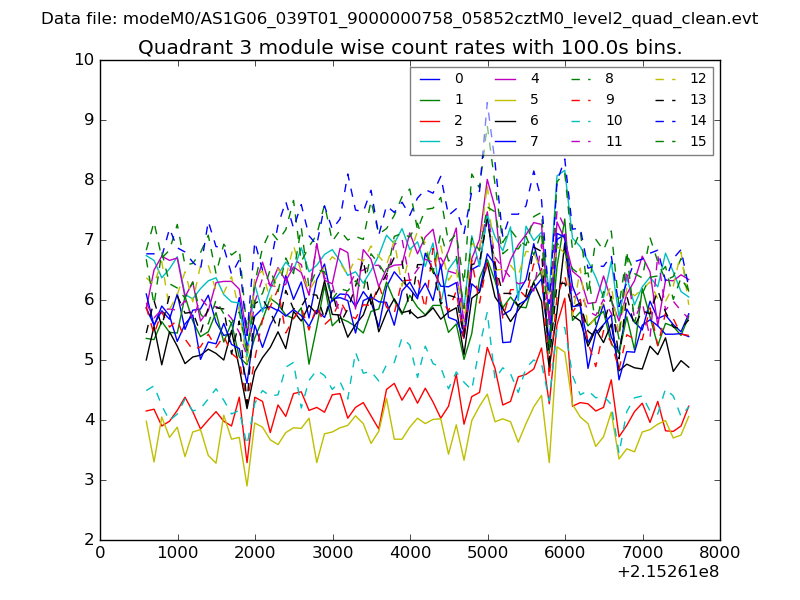
| Module-wise count rates for Quadrant C Data is divided into 100 sec bins |
 |
 |
| Module-wise count rates for Quadrant D Data is divided into 100 sec bins |
 |
 |
| Parameter | Plot |
|---|---|
| CZT HV Monitor | 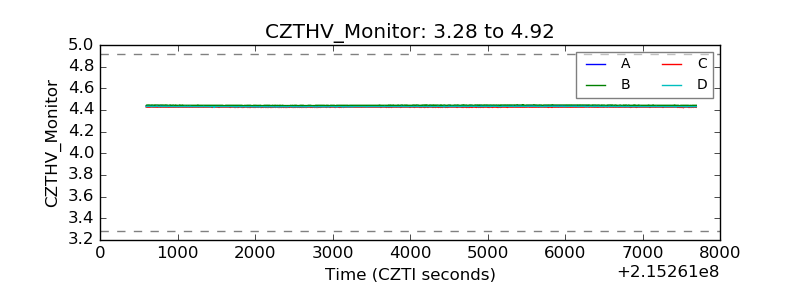 |
| D_VDD | 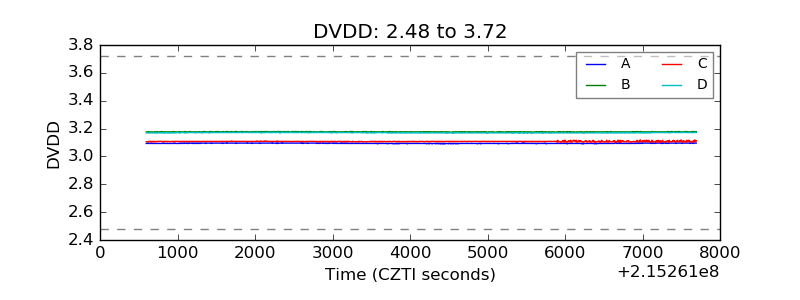 |
| Temperature 1 | 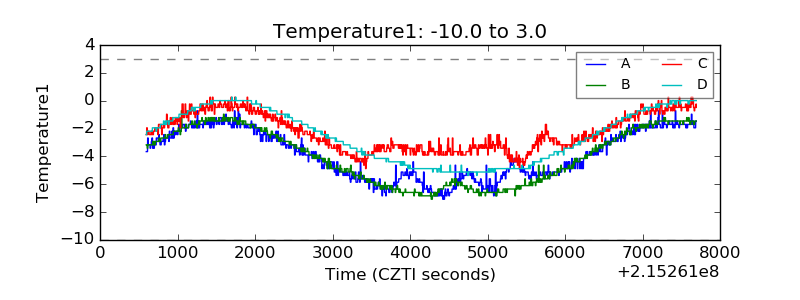 |
| Veto HV Monitor | 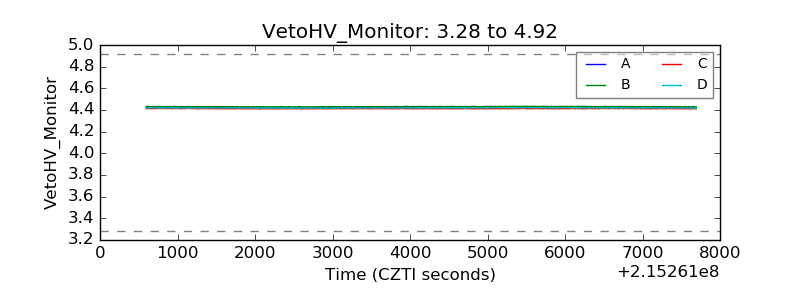 |
| Veto LLD | 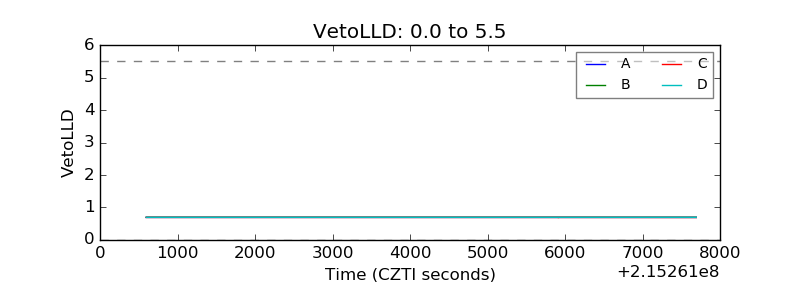 |
| Alpha Counter | 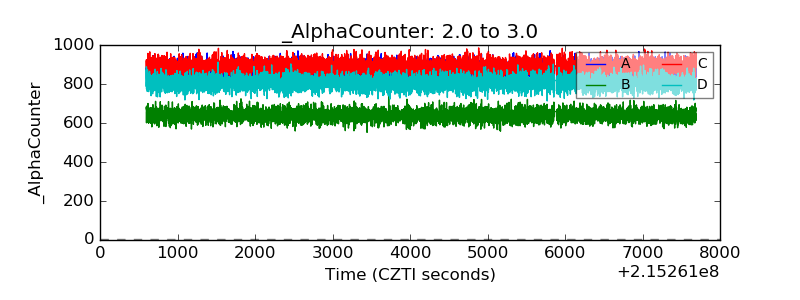 |
| _CPM_Rate | 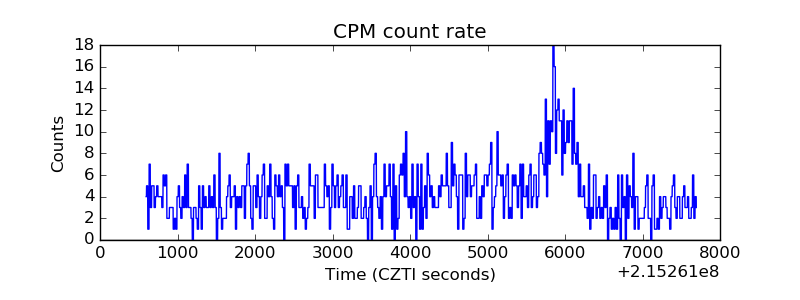 |
| CZT Counter | 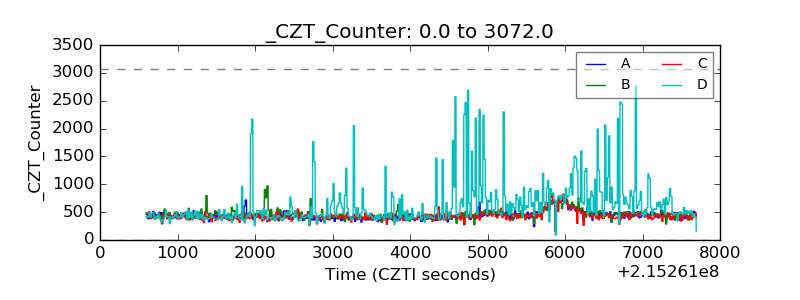 |
| +2.5 Volts monitor |  |
| +5 Volts monitor |  |
| _ROLL_ROT | 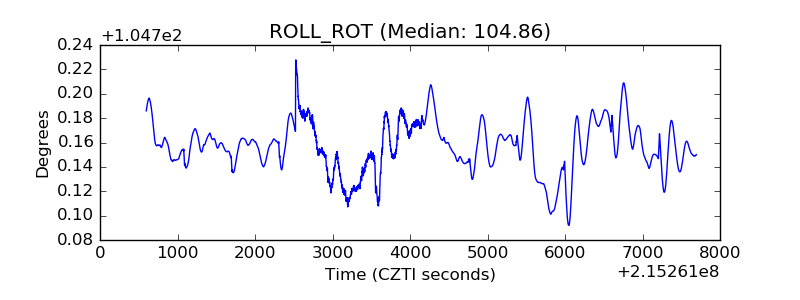 |
| _Roll_DEC | 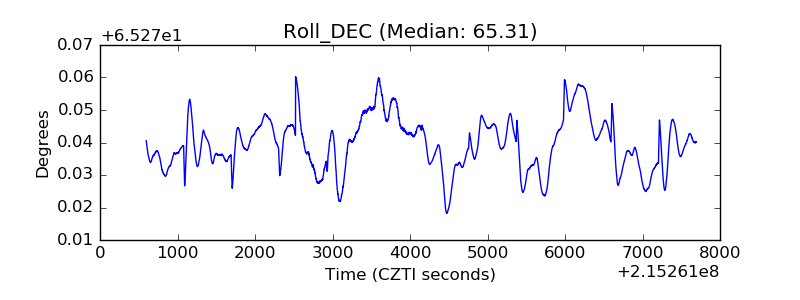 |
| _Roll_RA | 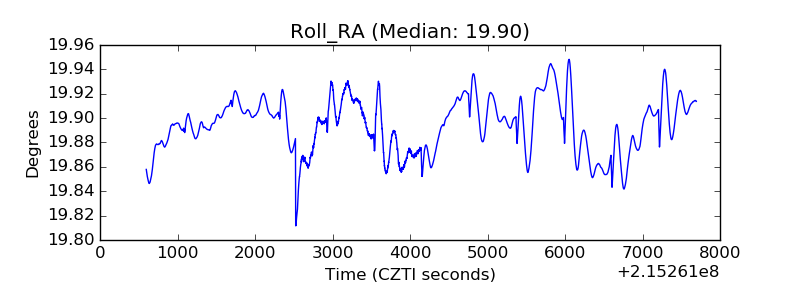 |
| Veto Counter | 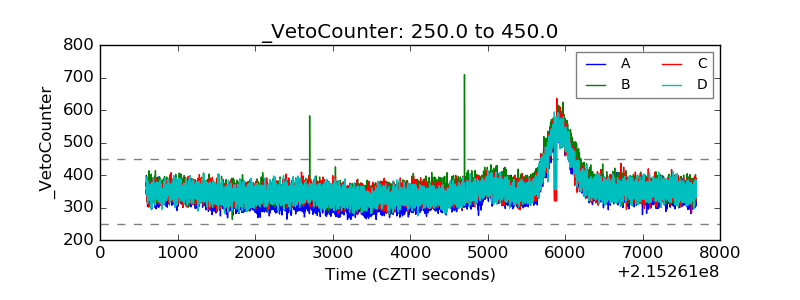 |