| Param | Original file | Final file |
|---|---|---|
| Filename | modeM0/AS1G06_039T01_9000000758_05853cztM0_level2.evt | modeM0/AS1G06_039T01_9000000758_05853cztM0_level2_quad_clean.evt |
| Size (bytes) | 452,949,120 | 107,038,080 |
| Size | 432.0 MB | 102.1 MB |
| Events in quadrant A | 3,062,406 | 710,611 |
| Events in quadrant B | 3,121,611 | 705,670 |
| Events in quadrant C | 2,970,939 | 691,601 |
| Events in quadrant D | 4,095,049 | 654,776 |
| Mode M0 | |||
|---|---|---|---|
| Quadrant | BADHDUFLAG | Total packets | Discarded packets |
| A | 0 | 14090 | 46 |
| B | 0 | 14090 | 42 |
| C | 0 | 13984 | 25 |
| D | 0 | 16957 | 65 |
| Mode SS | |||
|---|---|---|---|
| Quadrant | BADHDUFLAG | Total packets | Discarded packets |
| A | 0 | 140 | 0 |
| B | 0 | 140 | 0 |
| C | 0 | 140 | 0 |
| D | 0 | 140 | 0 |
| Mode M9 | |||
|---|---|---|---|
| Quadrant | BADHDUFLAG | Total packets | Discarded packets |
| A | 0 | 3 | 0 |
| B | 0 | 3 | 0 |
| C | 0 | 3 | 0 |
| D | 0 | 3 | 0 |
| Quadrant | Total seconds | Saturated seconds | Saturation percentage |
|---|---|---|---|
| A | 6870 | 39 | 0.567686% |
| B | 6873 | 52 | 0.756584% |
| C | 6881 | 32 | 0.465049% |
| D | 6873 | 112 | 1.629565% |
Noise dominated data is calculated using 1-second bins in cleaned event files. If a bin has >2000 counts, and if more than 50% of those come from <1% of pixels, then it is considered to be noise-dominated and hence unusable.
| Quadrant | # 1 sec bins | Bins with >0 counts | Bins with >2000 counts | High rate bins dominated by noise | Noise dominated (total time) | Noise dominated (detector-on time) | Marked lightcurve |
|---|---|---|---|---|---|---|---|
| A | 7173 | 6893 | 4 | 4 | 0.06% | 0.06% | 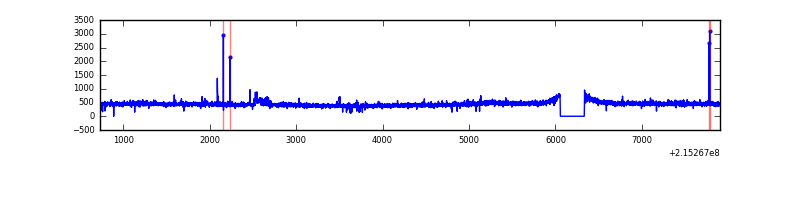 |
| B | 7173 | 6894 | 2 | 2 | 0.03% | 0.03% |  |
| C | 7173 | 6894 | 0 | 0 | 0.00% | 0.00% |  |
| D | 7173 | 6892 | 68 | 68 | 0.95% | 0.99% |  |
Top three noisy pixels from each quadrant. If the there are fewer than three noisy pixels in the level2.evt file, extra rows are filled as -1
| Pixel properties | Quadrant properties | ||||||
|---|---|---|---|---|---|---|---|
| Quadrant | DetID | PixID | Counts | Sigma | Mean | Median | Sigma |
| A | 15 | 234 | 42982 | 265.16 | 778 | 760 | 159.2 |
| A | 15 | 174 | 13998 | 83.14 | 778 | 760 | 159.2 |
| A | 0 | 12 | 10813 | 63.13 | 778 | 760 | 159.2 |
| B | 15 | 85 | 28397 | 182.92 | 782 | 761 | 151.1 |
| B | 4 | 48 | 18790 | 119.33 | 782 | 761 | 151.1 |
| B | 0 | 214 | 18489 | 117.34 | 782 | 761 | 151.1 |
| C | 8 | 128 | 10574 | 55.84 | 755 | 757 | 175.8 |
| C | 8 | 112 | 6461 | 32.44 | 755 | 757 | 175.8 |
| C | 13 | 61 | 6036 | 30.03 | 755 | 757 | 175.8 |
| D | 1 | 239 | 541025 | 2917.47 | 749 | 723 | 185.2 |
| D | 12 | 233 | 537163 | 2896.61 | 749 | 723 | 185.2 |
| D | 11 | 241 | 58981 | 314.58 | 749 | 723 | 185.2 |
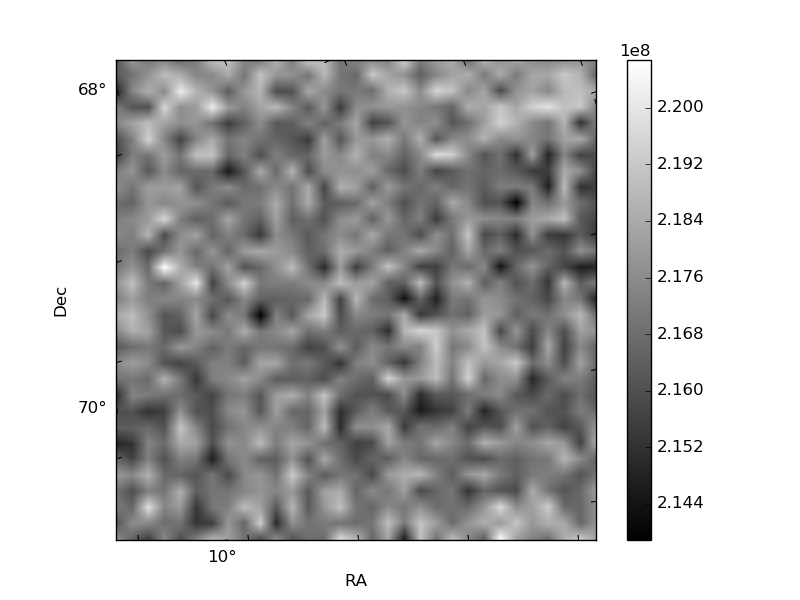
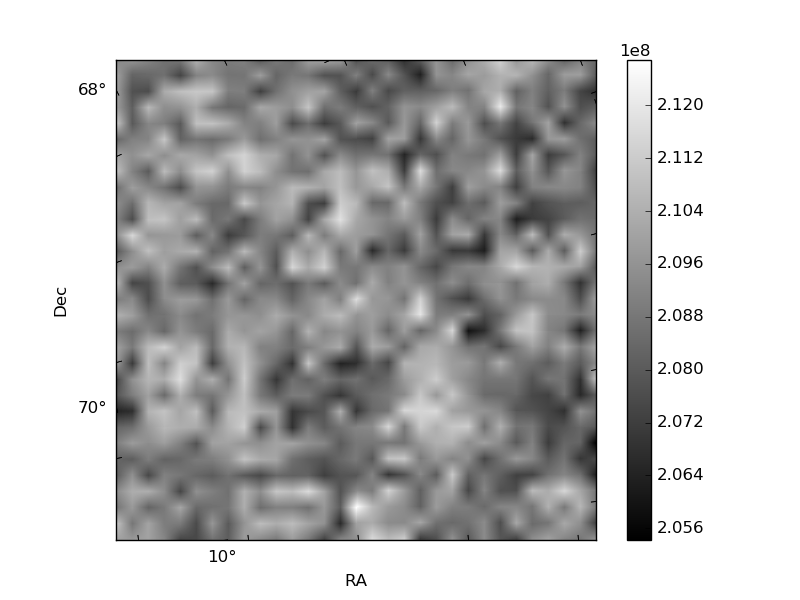
Histogram calculated using DETX and DETY for each event in the final _common_clean file
| Quadrant A | 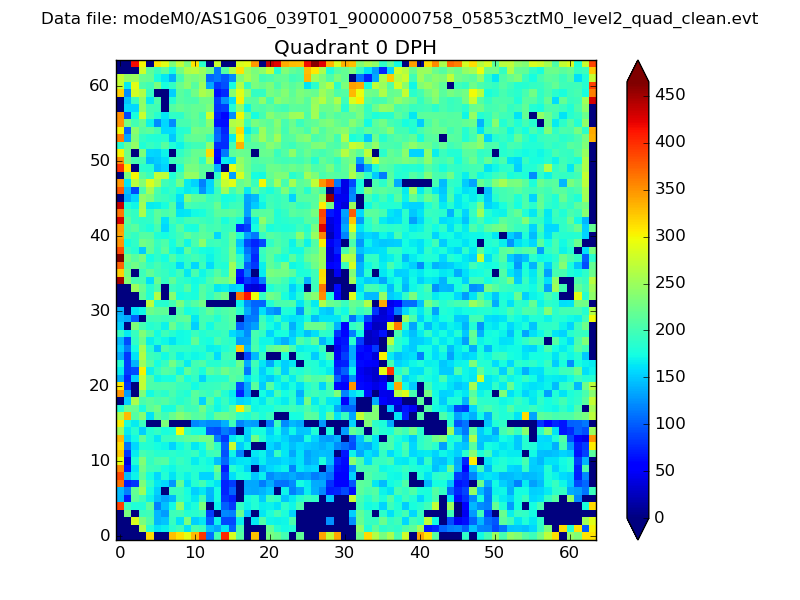 |
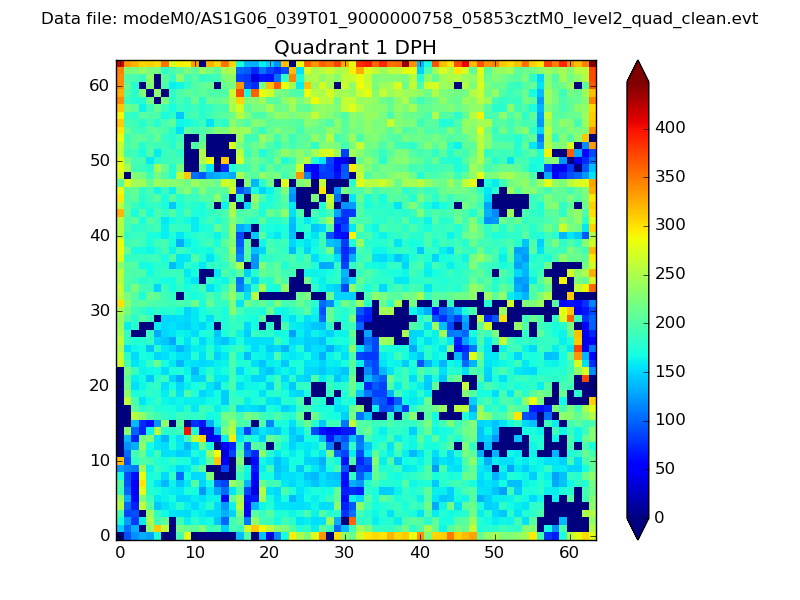 |
Quadrant B |
|---|---|---|---|
| Quadrant D | 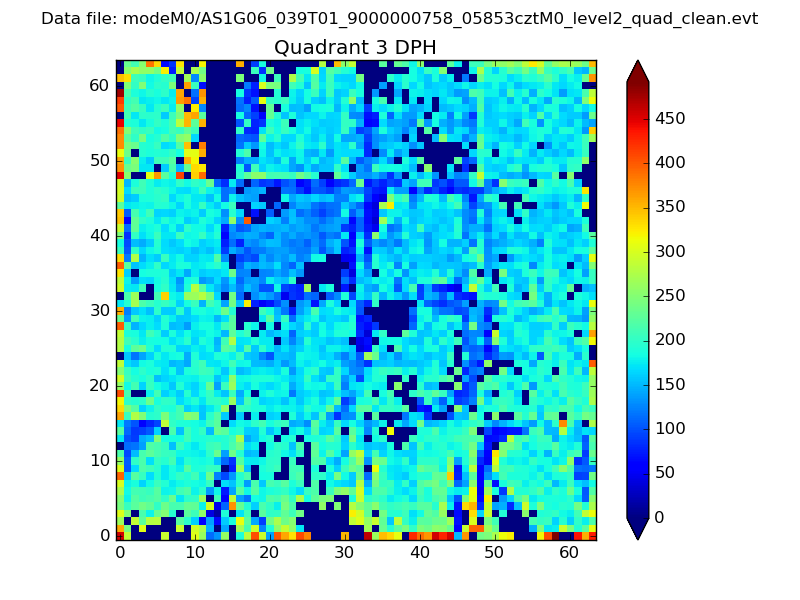 |
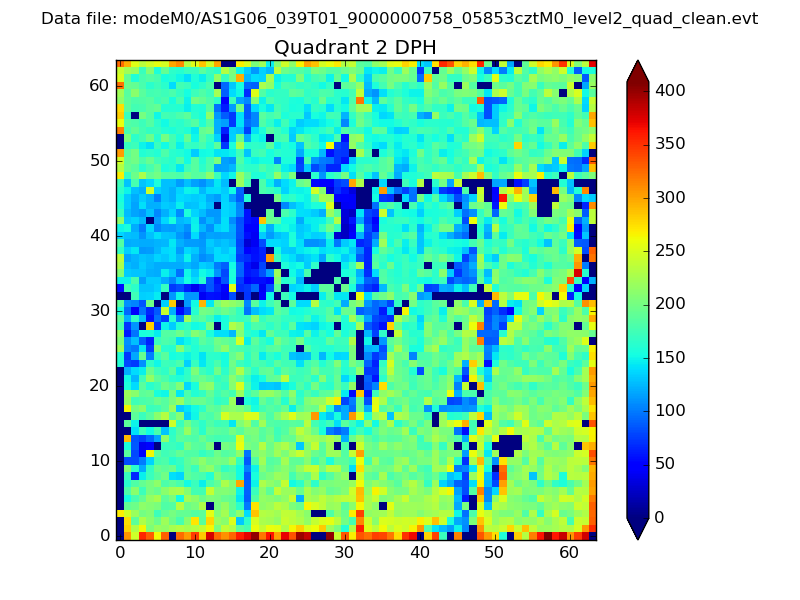 |
Quadrant C |
| Plot type | Count rate plots | Images |
|---|---|---|
| Comparison with Poisson distribution Blue bars denote a histogram of data divided into 1 sec bins. Red curve is a Poisson curve with rate = median count rate of data. |
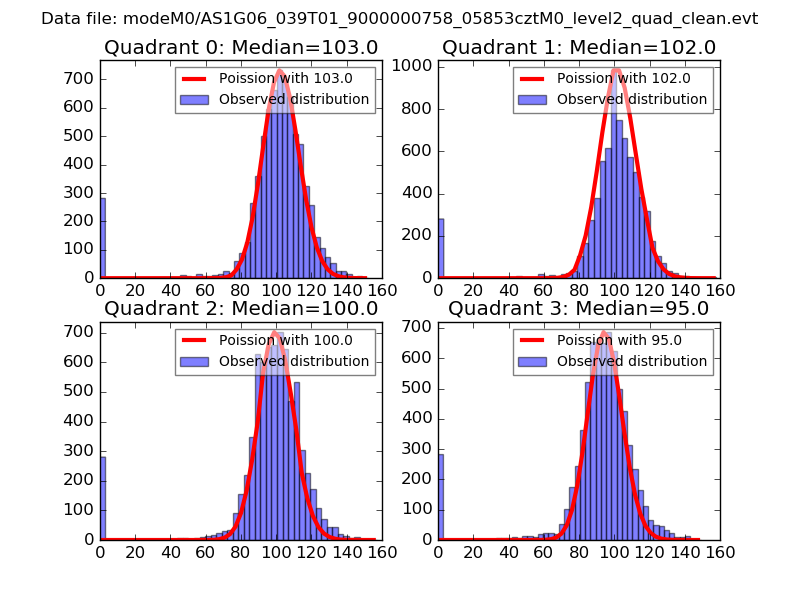 |
 |
| Quadrant-wise count rates Data is divided into 100 sec bins |
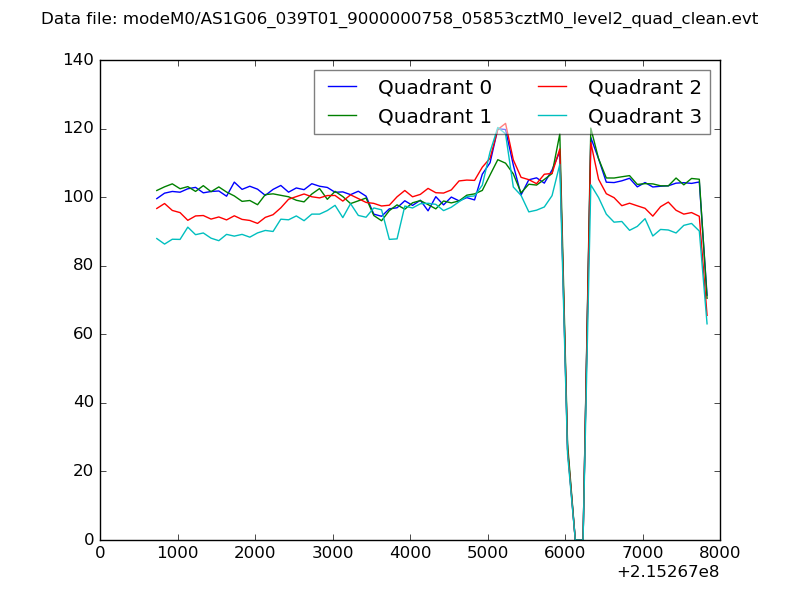 |
|
| Module-wise count rates for Quadrant A Data is divided into 100 sec bins |
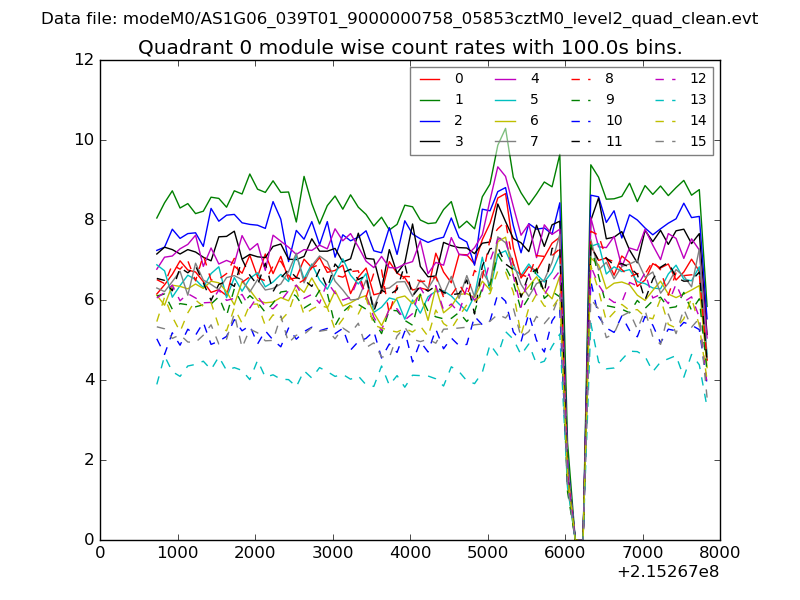 |
 |
| Module-wise count rates for Quadrant B Data is divided into 100 sec bins |
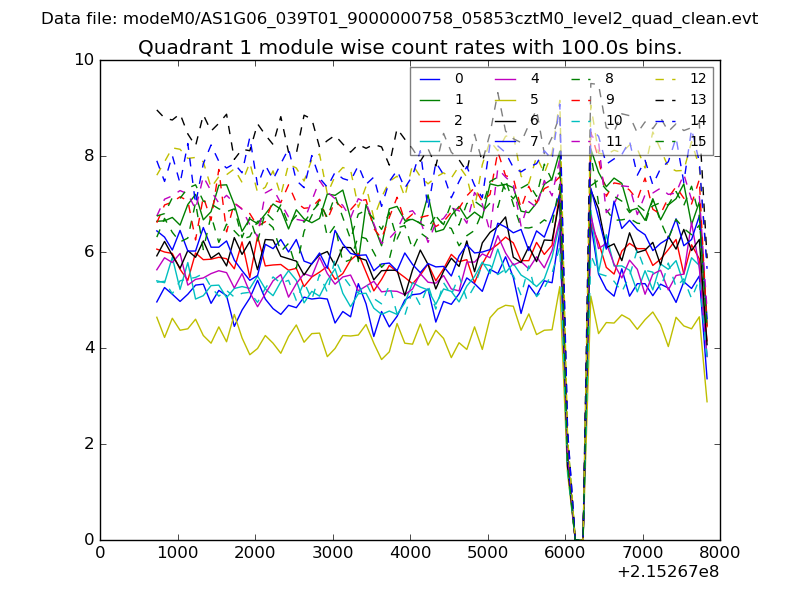 |
 |
| Module-wise count rates for Quadrant C Data is divided into 100 sec bins |
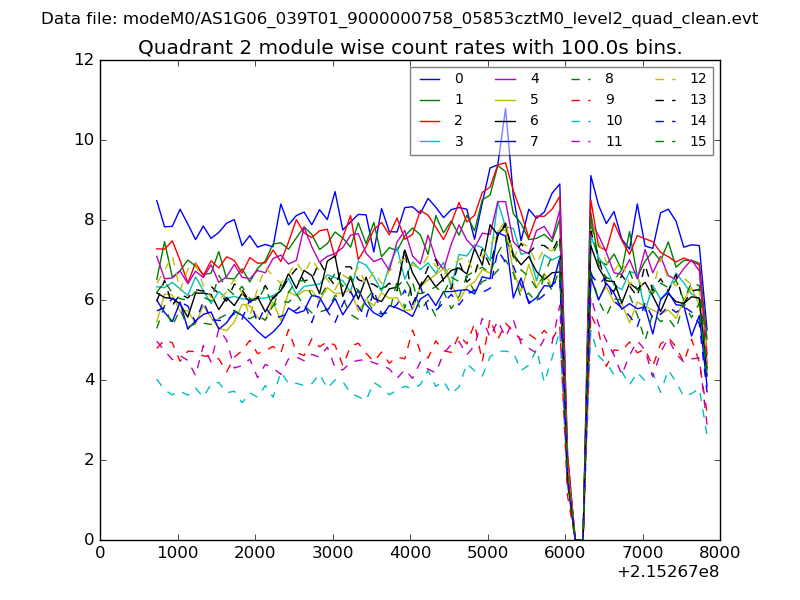 |
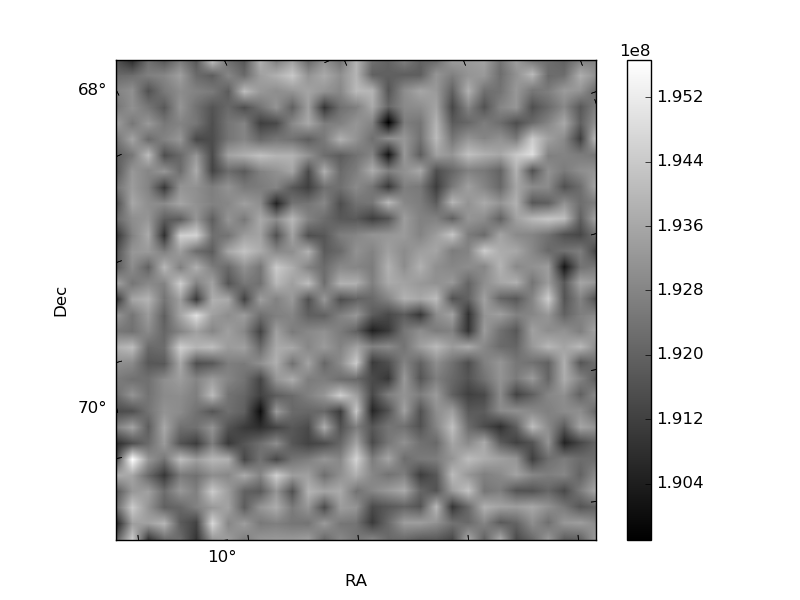 |
| Module-wise count rates for Quadrant D Data is divided into 100 sec bins |
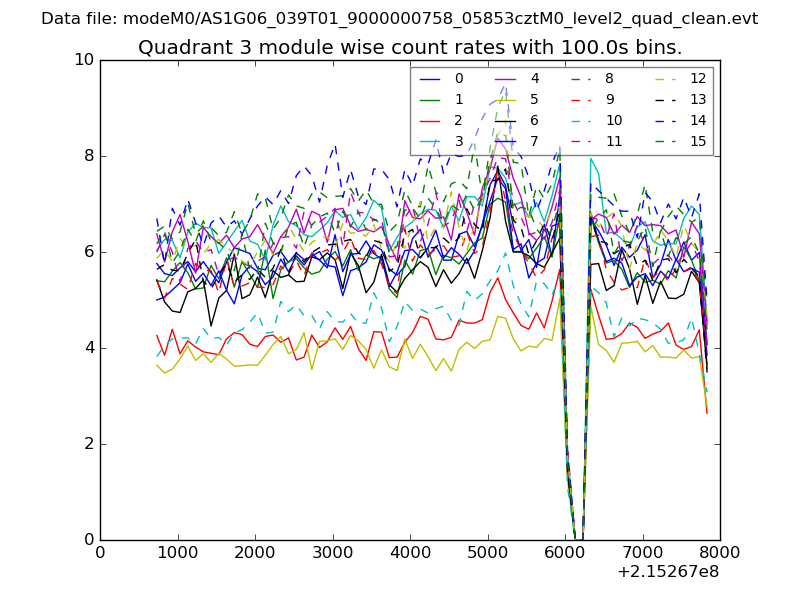 |
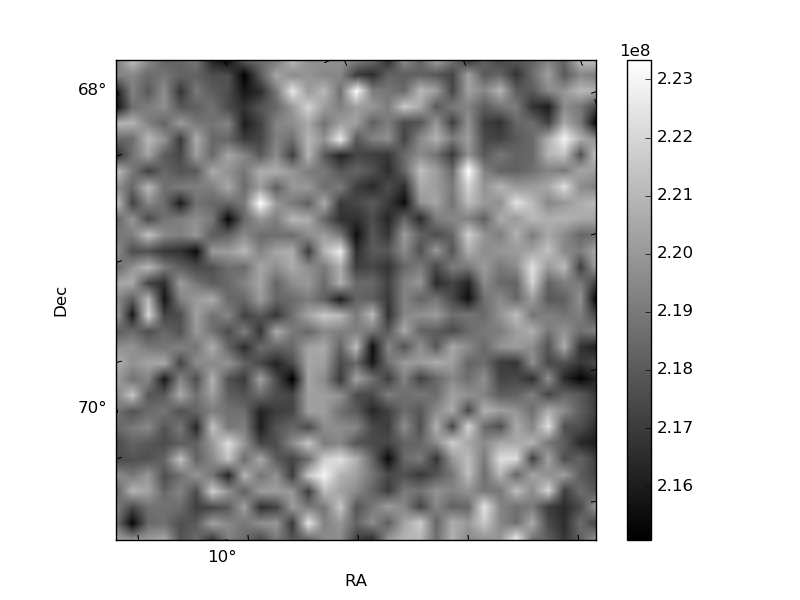 |
| Parameter | Plot |
|---|---|
| CZT HV Monitor | 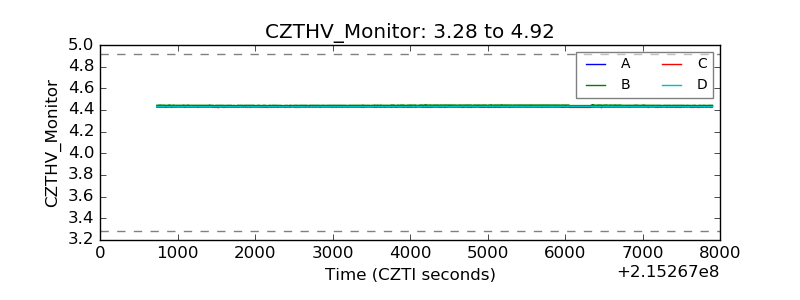 |
| D_VDD | 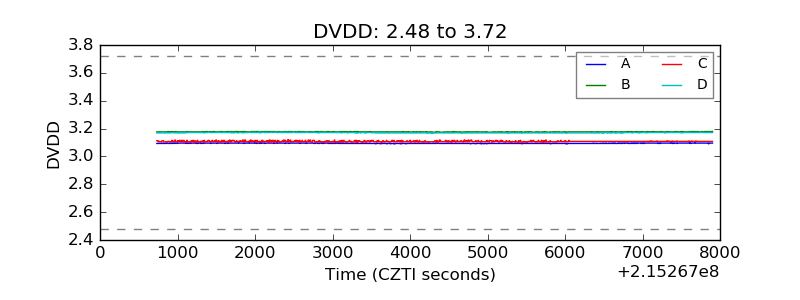 |
| Temperature 1 | 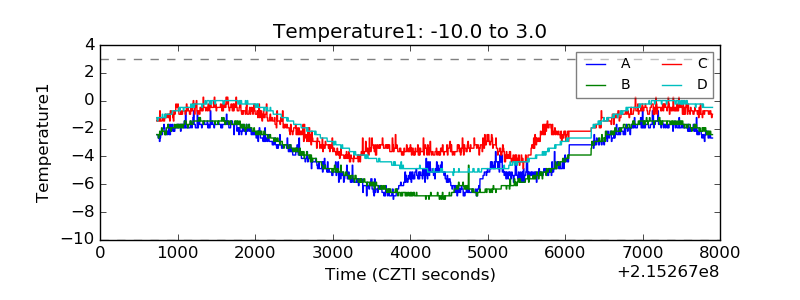 |
| Veto HV Monitor | 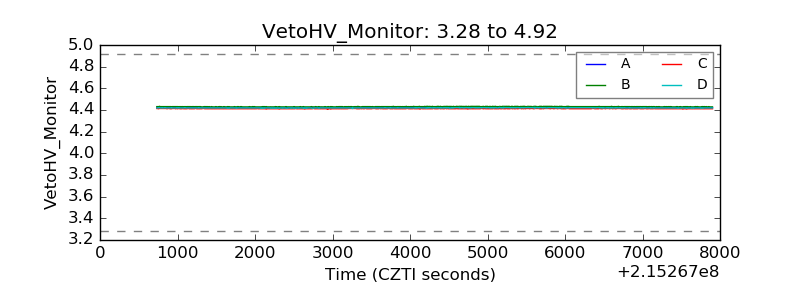 |
| Veto LLD | 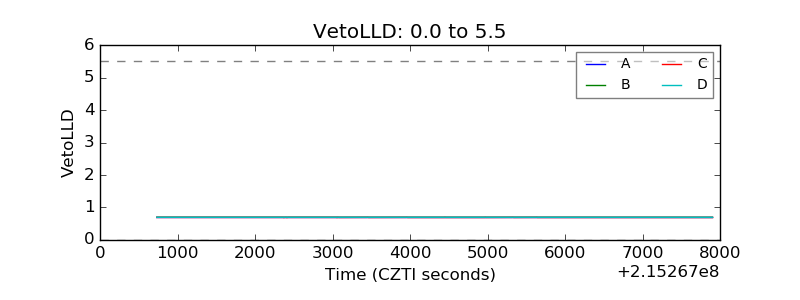 |
| Alpha Counter | 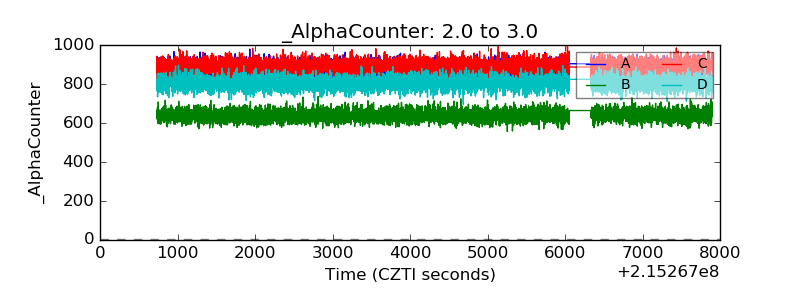 |
| _CPM_Rate | 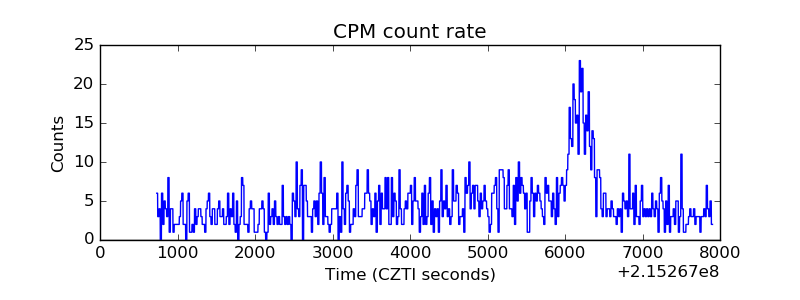 |
| CZT Counter | 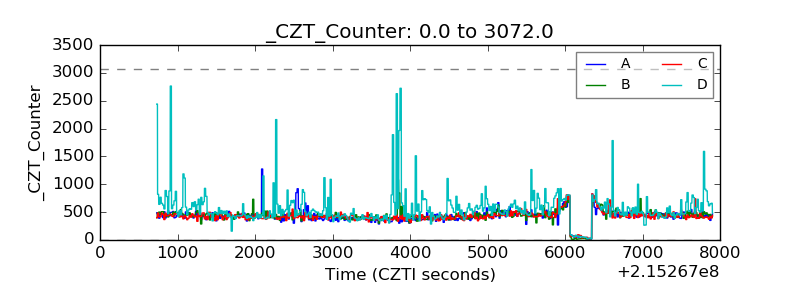 |
| +2.5 Volts monitor |  |
| +5 Volts monitor |  |
| _ROLL_ROT | 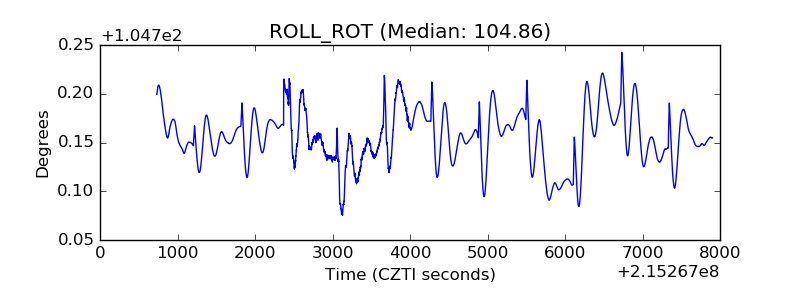 |
| _Roll_DEC | 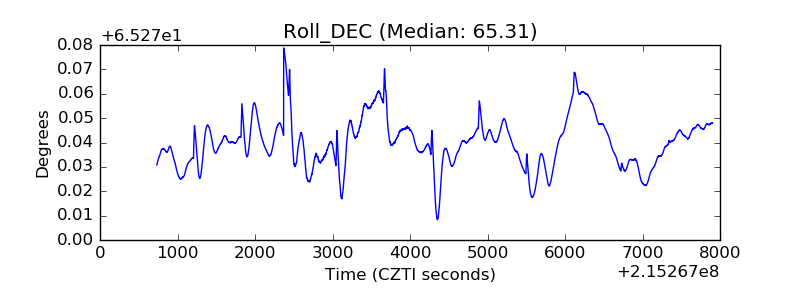 |
| _Roll_RA | 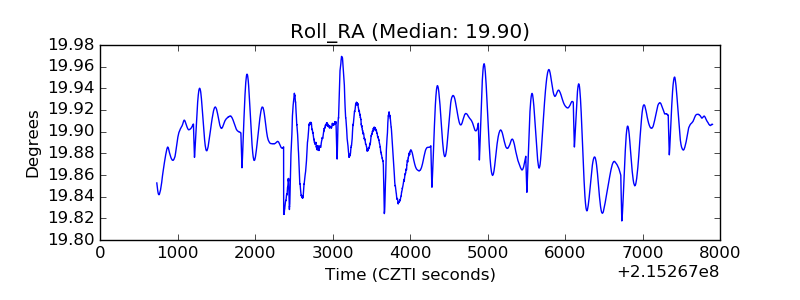 |
| Veto Counter | 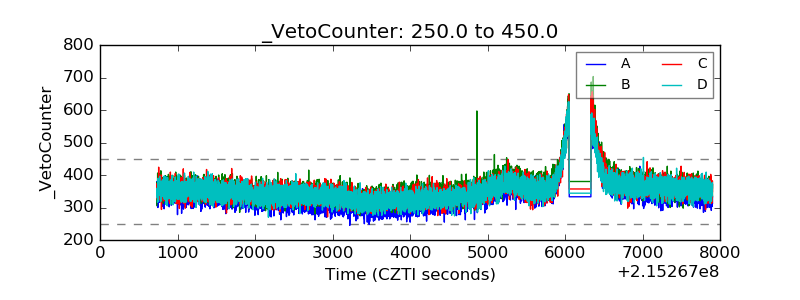 |