| Param | Original file | Final file |
|---|---|---|
| Filename | modeM0/AS1G06_033T01_9000000760_05861cztM0_level2.evt | modeM0/AS1G06_033T01_9000000760_05861cztM0_level2_quad_clean.evt |
| Size (bytes) | 469,175,040 | 55,100,160 |
| Size | 447.4 MB | 52.5 MB |
| Events in quadrant A | 3,160,564 | 308,151 |
| Events in quadrant B | 3,305,934 | 310,345 |
| Events in quadrant C | 3,109,349 | 309,698 |
| Events in quadrant D | 4,193,100 | 287,682 |
| Mode SS | |||
|---|---|---|---|
| Quadrant | BADHDUFLAG | Total packets | Discarded packets |
| A | 0 | 132 | 0 |
| B | 0 | 132 | 0 |
| C | 0 | 132 | 0 |
| D | 0 | 132 | 0 |
| Mode M0 | |||
|---|---|---|---|
| Quadrant | BADHDUFLAG | Total packets | Discarded packets |
| A | 0 | 13403 | 3 |
| B | 0 | 13772 | 2 |
| C | 0 | 13388 | 2 |
| D | 0 | 16693 | 2 |
| Mode M9 | |||
|---|---|---|---|
| Quadrant | BADHDUFLAG | Total packets | Discarded packets |
| A | 0 | 16 | 0 |
| B | 0 | 16 | 0 |
| C | 0 | 16 | 0 |
| D | 0 | 17 | 0 |
| Quadrant | Total seconds | Saturated seconds | Saturation percentage |
|---|---|---|---|
| A | 6479 | 50 | 0.771724% |
| B | 6479 | 76 | 1.173021% |
| C | 6479 | 39 | 0.601945% |
| D | 6479 | 156 | 2.407779% |
Noise dominated data is calculated using 1-second bins in cleaned event files. If a bin has >2000 counts, and if more than 50% of those come from <1% of pixels, then it is considered to be noise-dominated and hence unusable.
| Quadrant | # 1 sec bins | Bins with >0 counts | Bins with >2000 counts | High rate bins dominated by noise | Noise dominated (total time) | Noise dominated (detector-on time) | Marked lightcurve |
|---|---|---|---|---|---|---|---|
| A | 7744 | 6480 | 0 | 0 | 0.00% | 0.00% | 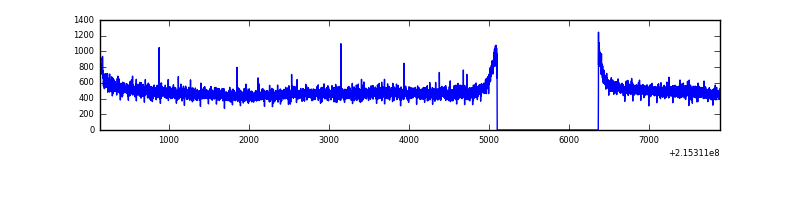 |
| B | 7744 | 6480 | 2 | 2 | 0.03% | 0.03% | 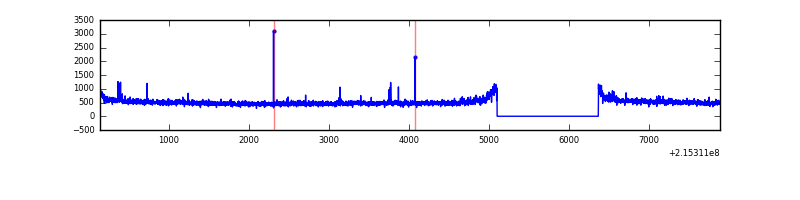 |
| C | 7744 | 6480 | 0 | 0 | 0.00% | 0.00% | 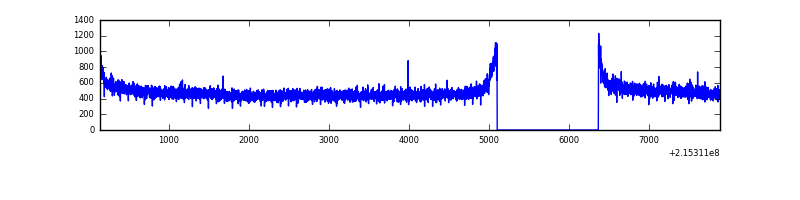 |
| D | 7744 | 6480 | 95 | 95 | 1.23% | 1.47% | 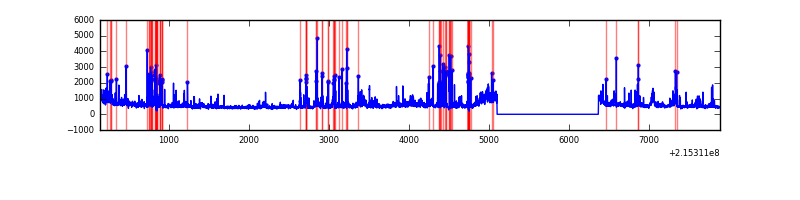 |
Top three noisy pixels from each quadrant. If the there are fewer than three noisy pixels in the level2.evt file, extra rows are filled as -1
| Pixel properties | Quadrant properties | ||||||
|---|---|---|---|---|---|---|---|
| Quadrant | DetID | PixID | Counts | Sigma | Mean | Median | Sigma |
| A | 0 | 226 | 8009 | 43.18 | 820 | 804 | 166.9 |
| A | 12 | 194 | 7859 | 42.28 | 820 | 804 | 166.9 |
| A | 13 | 254 | 3670 | 17.18 | 820 | 804 | 166.9 |
| B | 15 | 204 | 24537 | 151.01 | 832 | 815 | 157.1 |
| B | 0 | 219 | 23844 | 146.6 | 832 | 815 | 157.1 |
| B | 12 | 111 | 14377 | 86.33 | 832 | 815 | 157.1 |
| C | 13 | 61 | 6626 | 31.6 | 794 | 801 | 184.4 |
| C | 14 | 67 | 5088 | 23.25 | 794 | 801 | 184.4 |
| C | 1 | 16 | 3469 | 14.47 | 794 | 801 | 184.4 |
| D | 2 | 152 | 385983 | 2019.92 | 783 | 761 | 190.7 |
| D | 1 | 239 | 231749 | 1211.19 | 783 | 761 | 190.7 |
| D | 12 | 110 | 127814 | 666.21 | 783 | 761 | 190.7 |
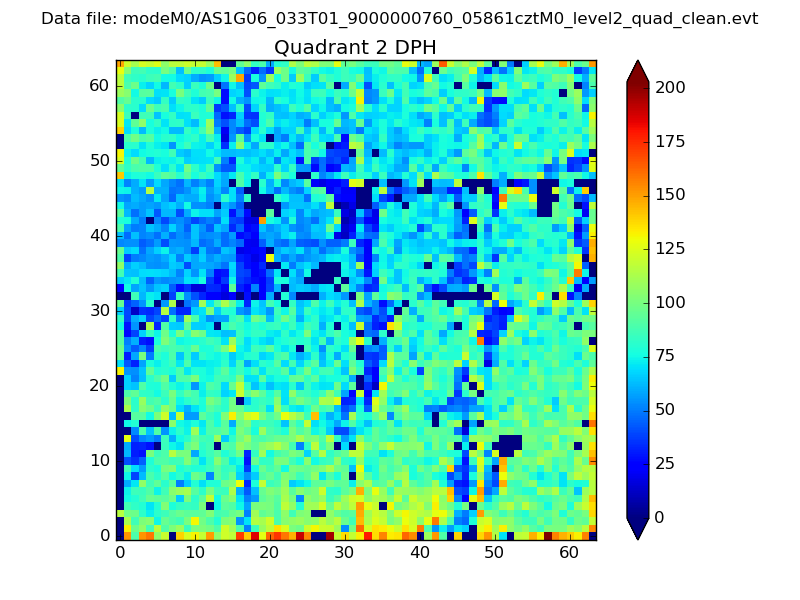
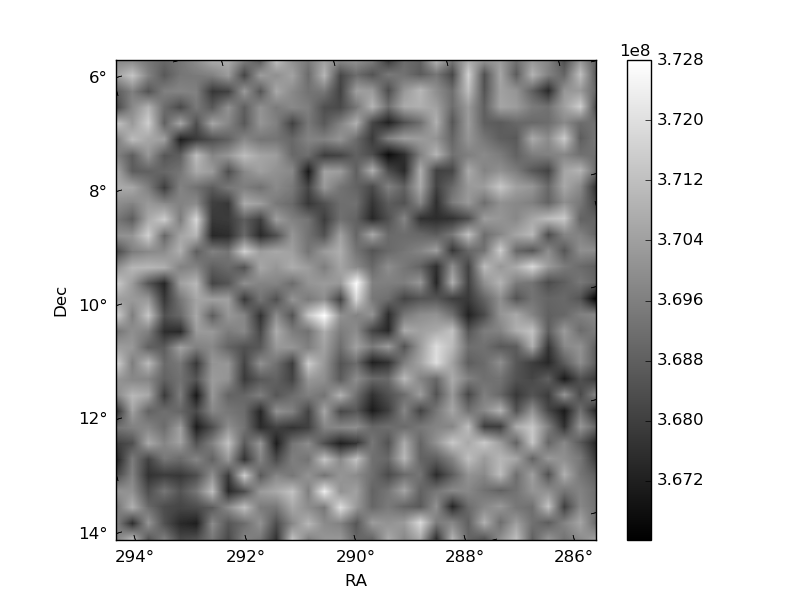
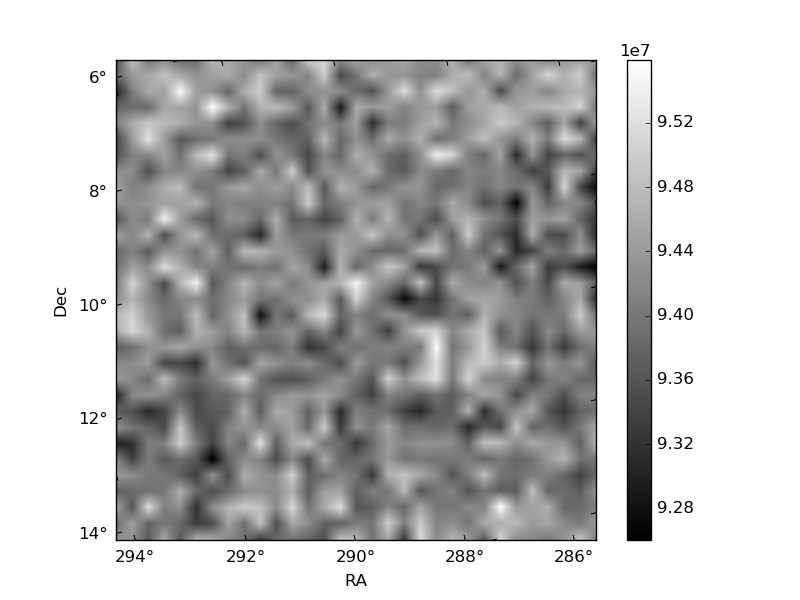
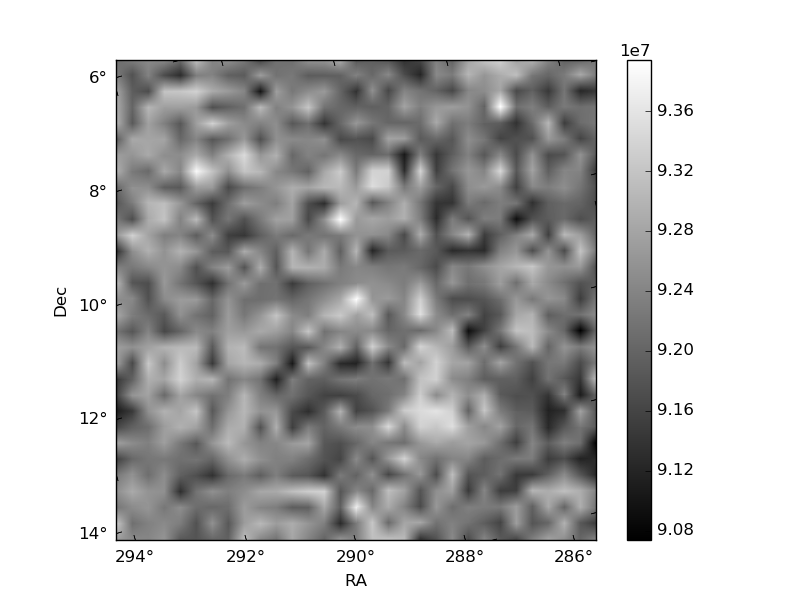
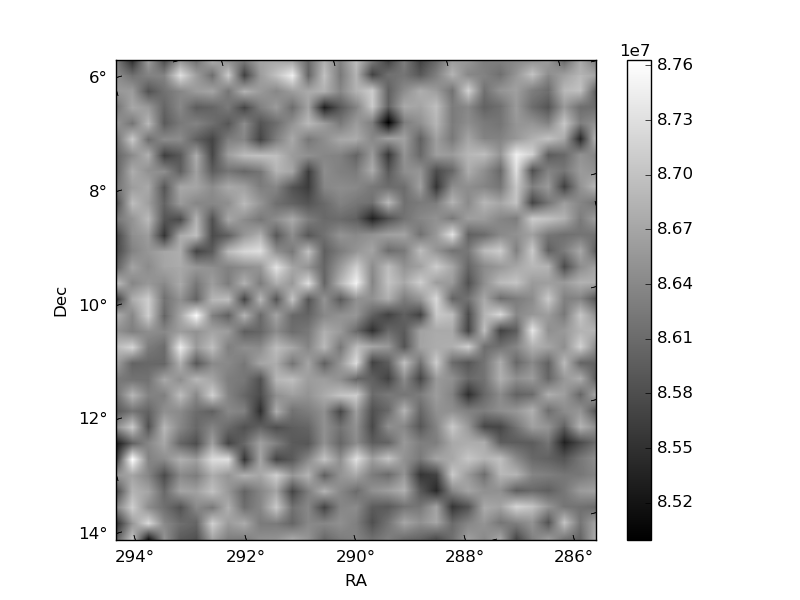
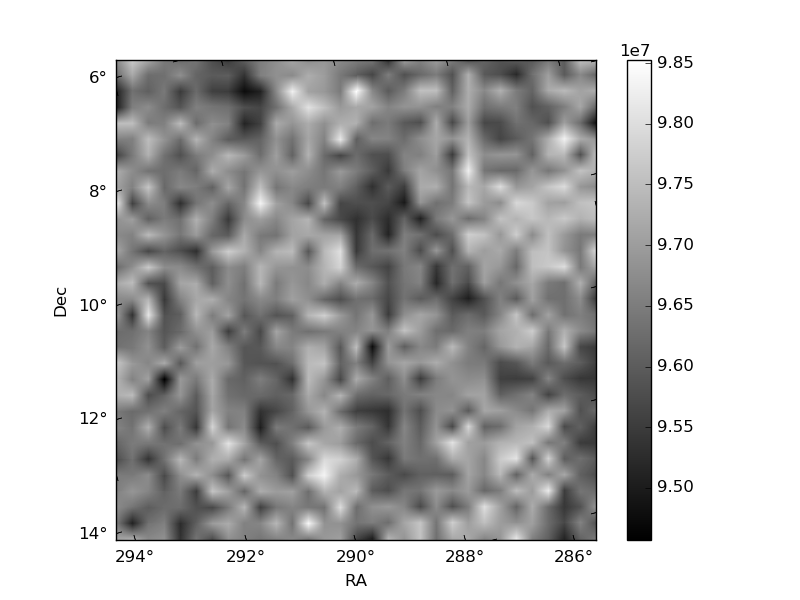
Histogram calculated using DETX and DETY for each event in the final _common_clean file
| Quadrant A | 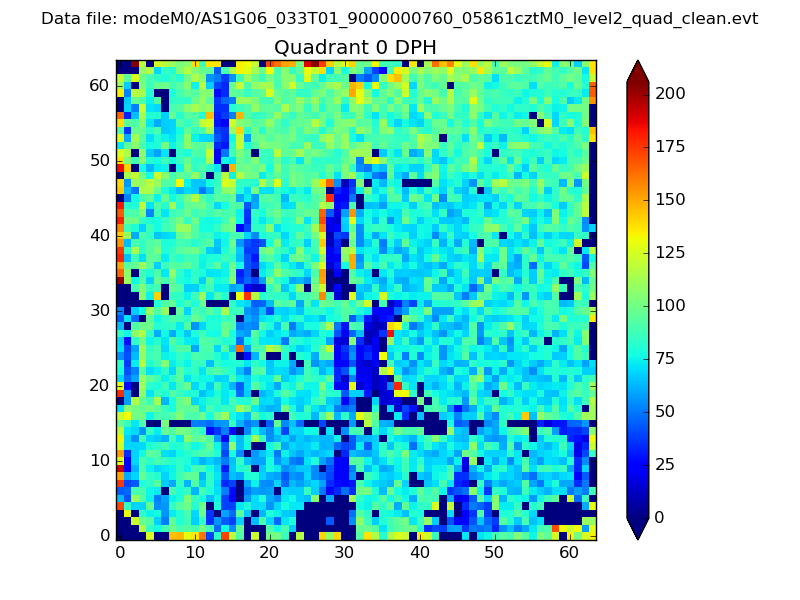 |
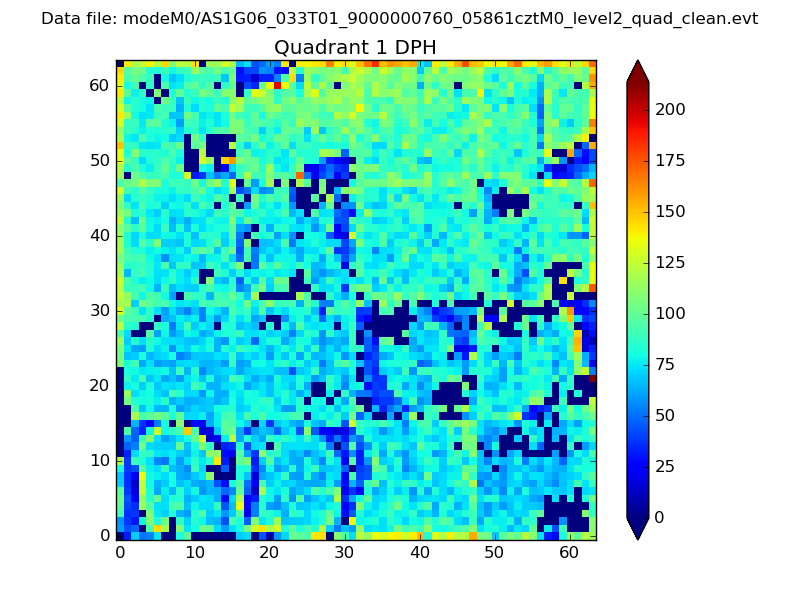 |
Quadrant B |
|---|---|---|---|
| Quadrant D | 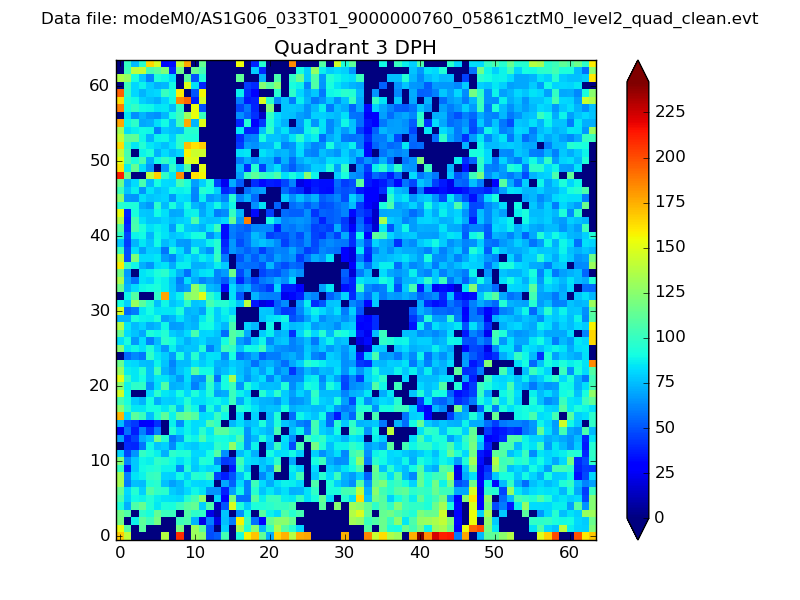 |
 |
Quadrant C |
| Plot type | Count rate plots | Images |
|---|---|---|
| Comparison with Poisson distribution Blue bars denote a histogram of data divided into 1 sec bins. Red curve is a Poisson curve with rate = median count rate of data. |
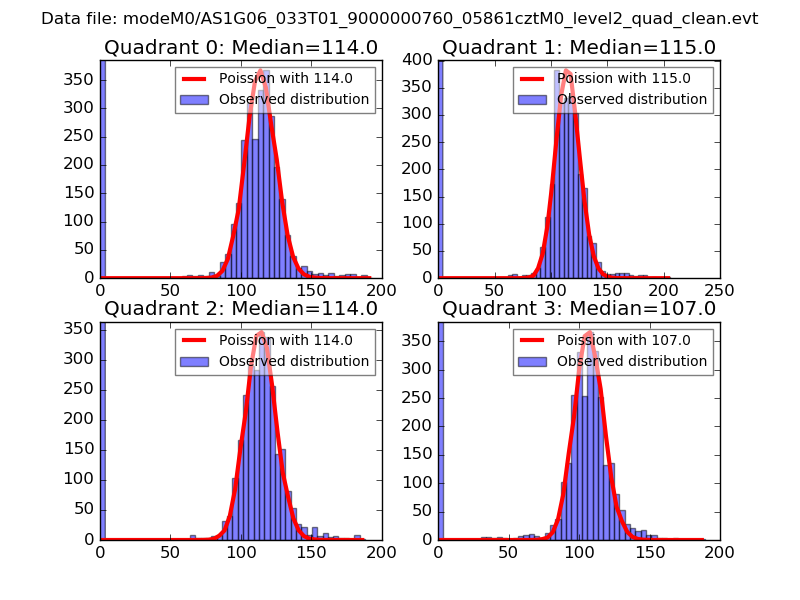 |
 |
| Quadrant-wise count rates Data is divided into 100 sec bins |
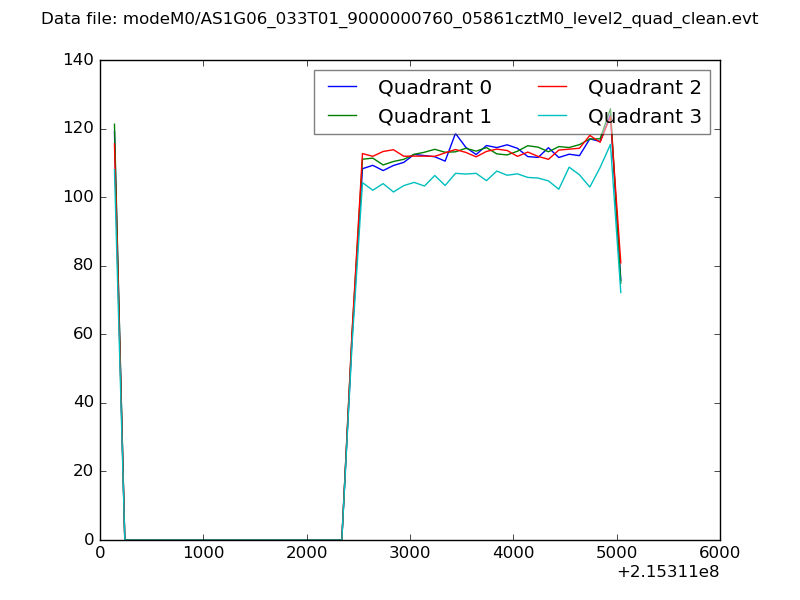 |
|
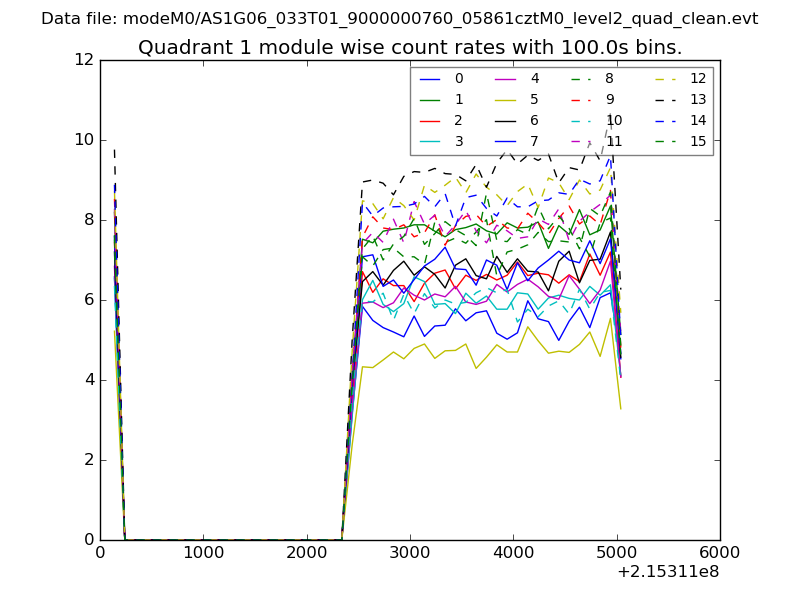
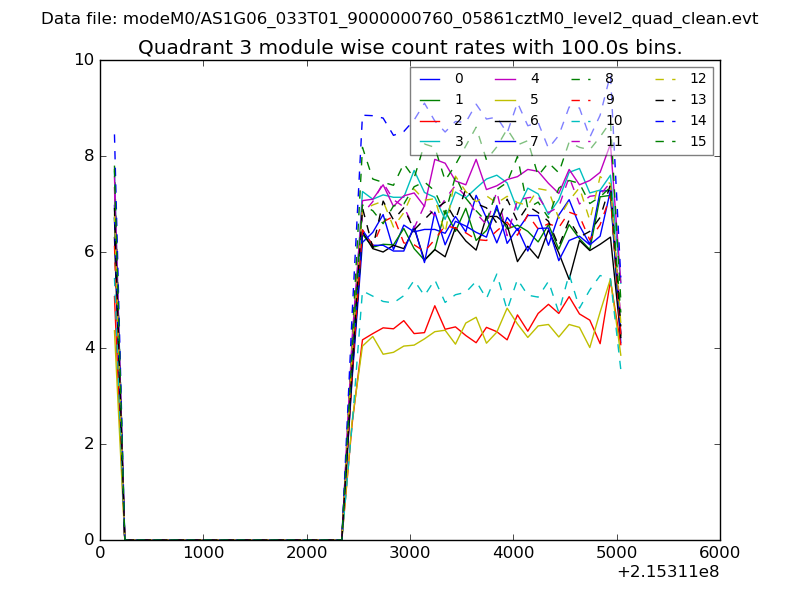
| Module-wise count rates for Quadrant A Data is divided into 100 sec bins |
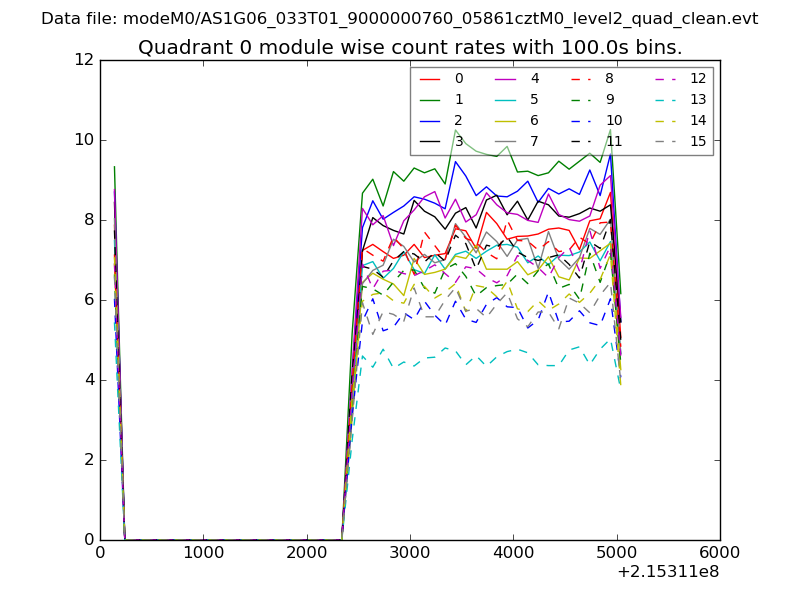 |
 |
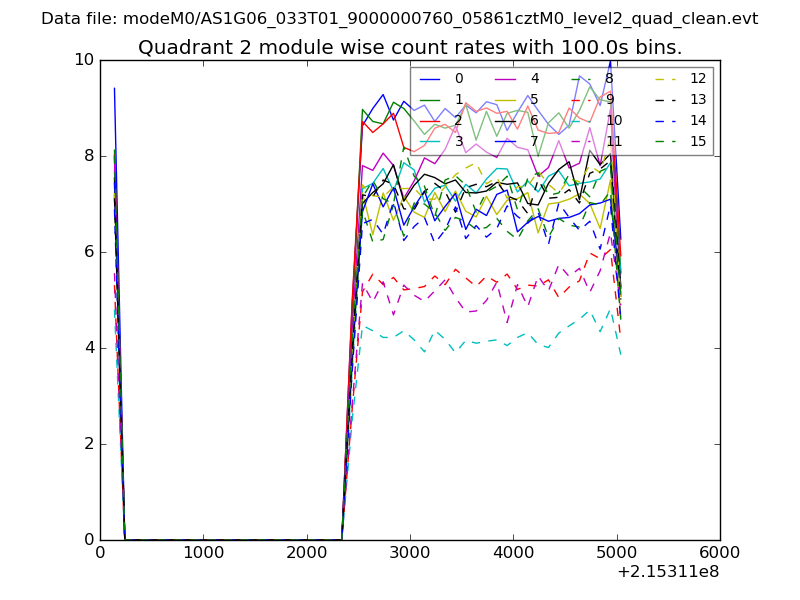
| Module-wise count rates for Quadrant B Data is divided into 100 sec bins |
 |
 |
| Module-wise count rates for Quadrant C Data is divided into 100 sec bins |
 |
 |
| Module-wise count rates for Quadrant D Data is divided into 100 sec bins |
 |
 |
| Parameter | Plot |
|---|---|
| CZT HV Monitor |  |
| D_VDD | 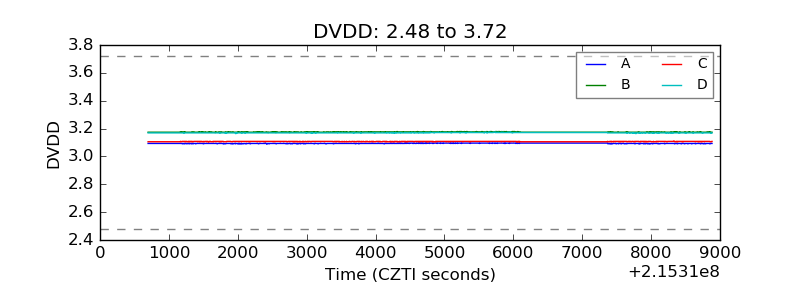 |
| Temperature 1 | 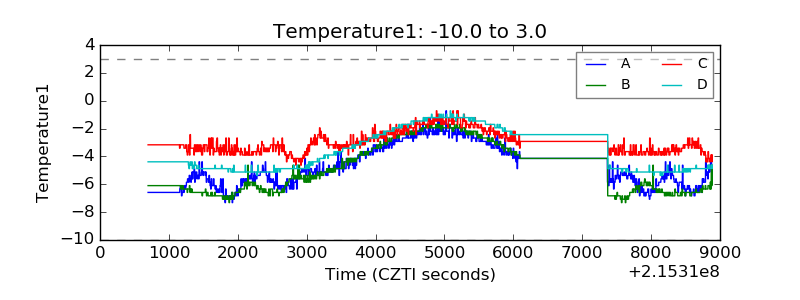 |
| Veto HV Monitor | 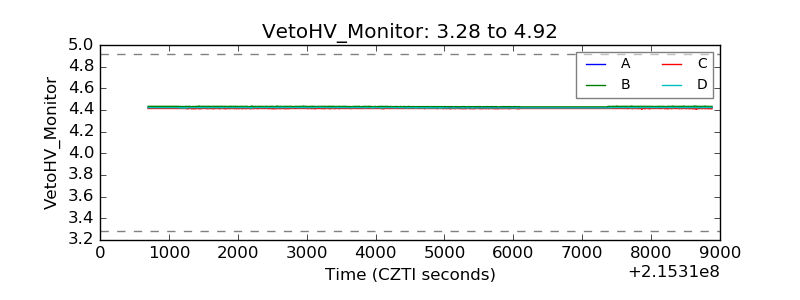 |
| Veto LLD | 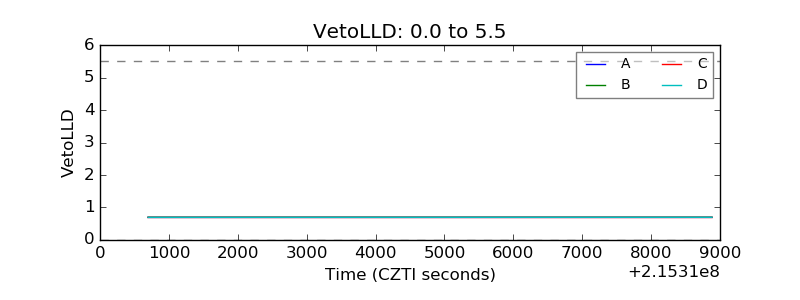 |
| Alpha Counter | 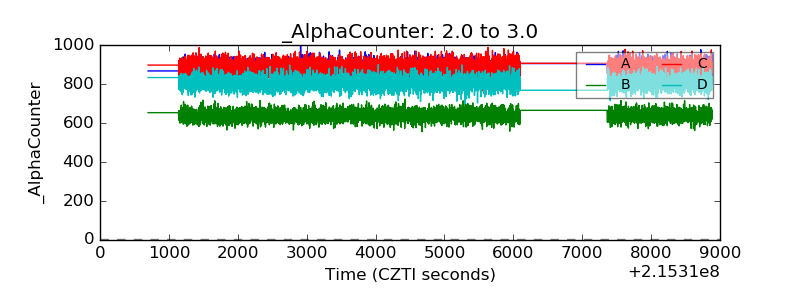 |
| _CPM_Rate | 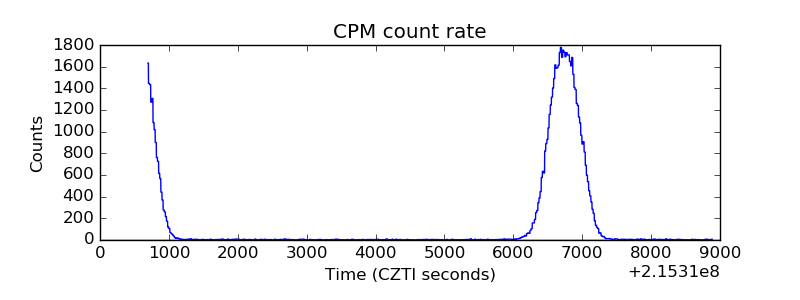 |
| CZT Counter | 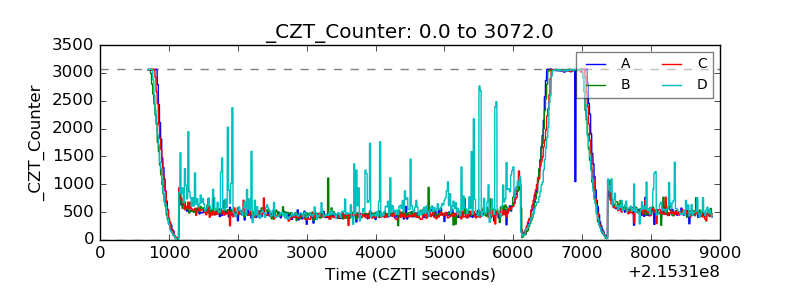 |
| +2.5 Volts monitor |  |
| +5 Volts monitor |  |
| _ROLL_ROT | 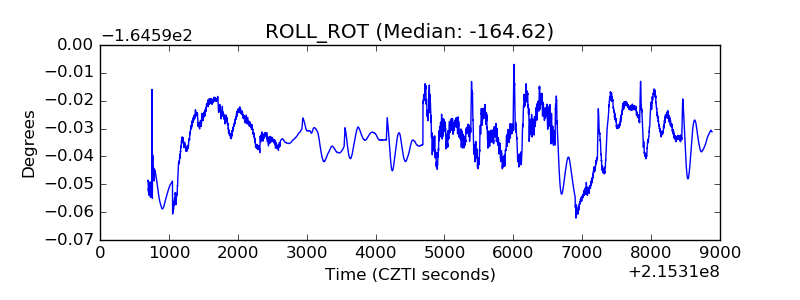 |
| _Roll_DEC | 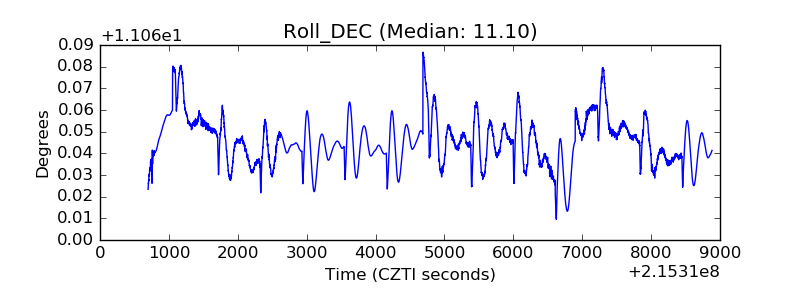 |
| _Roll_RA | 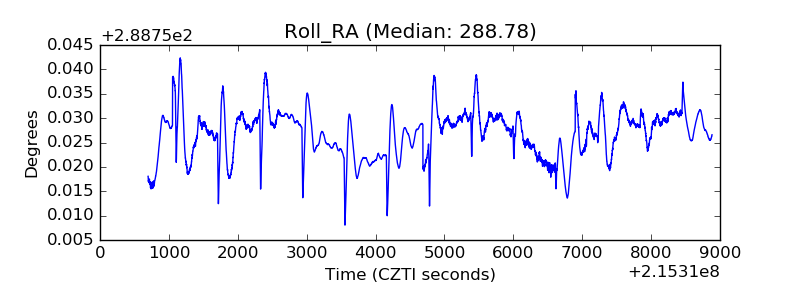 |
| Veto Counter | 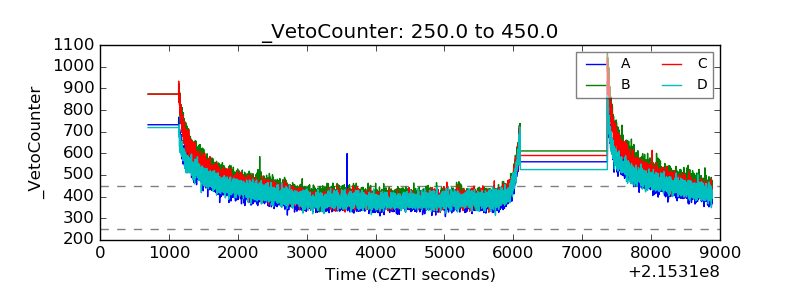 |