| Param | Original file | Final file |
|---|---|---|
| Filename | modeM0/AS1G06_033T01_9000000760_05862cztM0_level2.evt | modeM0/AS1G06_033T01_9000000760_05862cztM0_level2_quad_clean.evt |
| Size (bytes) | 425,678,400 | 59,037,120 |
| Size | 406.0 MB | 56.3 MB |
| Events in quadrant A | 2,947,642 | 346,998 |
| Events in quadrant B | 3,075,671 | 350,607 |
| Events in quadrant C | 2,838,298 | 348,390 |
| Events in quadrant D | 3,625,841 | 325,977 |
| Mode SS | |||
|---|---|---|---|
| Quadrant | BADHDUFLAG | Total packets | Discarded packets |
| A | 0 | 120 | 0 |
| B | 0 | 120 | 0 |
| C | 0 | 120 | 0 |
| D | 0 | 120 | 0 |
| Mode M0 | |||
|---|---|---|---|
| Quadrant | BADHDUFLAG | Total packets | Discarded packets |
| A | 0 | 12437 | 2 |
| B | 0 | 12680 | 1 |
| C | 0 | 12266 | 1 |
| D | 0 | 14540 | 1 |
| Mode M9 | |||
|---|---|---|---|
| Quadrant | BADHDUFLAG | Total packets | Discarded packets |
| A | 0 | 13 | 0 |
| B | 0 | 13 | 0 |
| C | 0 | 13 | 0 |
| D | 0 | 13 | 0 |
| Quadrant | Total seconds | Saturated seconds | Saturation percentage |
|---|---|---|---|
| A | 5947 | 76 | 1.277955% |
| B | 5947 | 92 | 1.546998% |
| C | 5947 | 57 | 0.958466% |
| D | 5947 | 146 | 2.455019% |
Noise dominated data is calculated using 1-second bins in cleaned event files. If a bin has >2000 counts, and if more than 50% of those come from <1% of pixels, then it is considered to be noise-dominated and hence unusable.
| Quadrant | # 1 sec bins | Bins with >0 counts | Bins with >2000 counts | High rate bins dominated by noise | Noise dominated (total time) | Noise dominated (detector-on time) | Marked lightcurve |
|---|---|---|---|---|---|---|---|
| A | 7222 | 5948 | 5 | 5 | 0.07% | 0.08% | 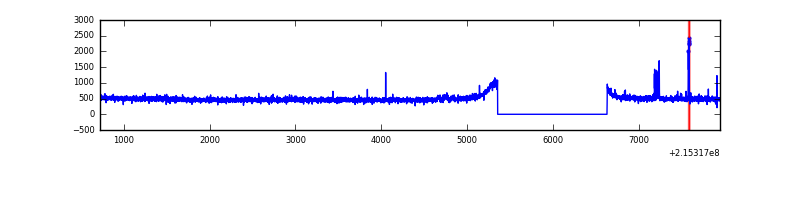 |
| B | 7222 | 5948 | 5 | 5 | 0.07% | 0.08% |  |
| C | 7222 | 5948 | 0 | 0 | 0.00% | 0.00% | 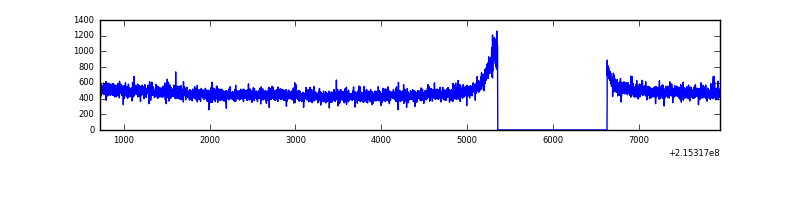 |
| D | 7222 | 5948 | 76 | 76 | 1.05% | 1.28% | 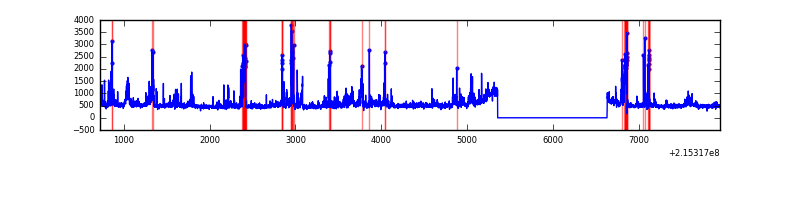 |
Top three noisy pixels from each quadrant. If the there are fewer than three noisy pixels in the level2.evt file, extra rows are filled as -1
| Pixel properties | Quadrant properties | ||||||
|---|---|---|---|---|---|---|---|
| Quadrant | DetID | PixID | Counts | Sigma | Mean | Median | Sigma |
| A | 15 | 234 | 45337 | 294.93 | 750 | 736 | 151.2 |
| A | 15 | 174 | 11989 | 74.41 | 750 | 736 | 151.2 |
| A | 0 | 226 | 7320 | 43.54 | 750 | 736 | 151.2 |
| B | 15 | 204 | 66435 | 447.91 | 762 | 745 | 146.7 |
| B | 15 | 255 | 23933 | 158.11 | 762 | 745 | 146.7 |
| B | 0 | 219 | 21937 | 144.5 | 762 | 745 | 146.7 |
| C | 14 | 67 | 6008 | 31.51 | 726 | 732 | 167.4 |
| C | 13 | 61 | 6007 | 31.51 | 726 | 732 | 167.4 |
| C | 3 | 202 | 1814 | 6.46 | 726 | 732 | 167.4 |
| D | 2 | 152 | 252793 | 1423.56 | 721 | 701 | 177.1 |
| D | 12 | 233 | 190919 | 1074.16 | 721 | 701 | 177.1 |
| D | 2 | 63 | 174361 | 980.65 | 721 | 701 | 177.1 |
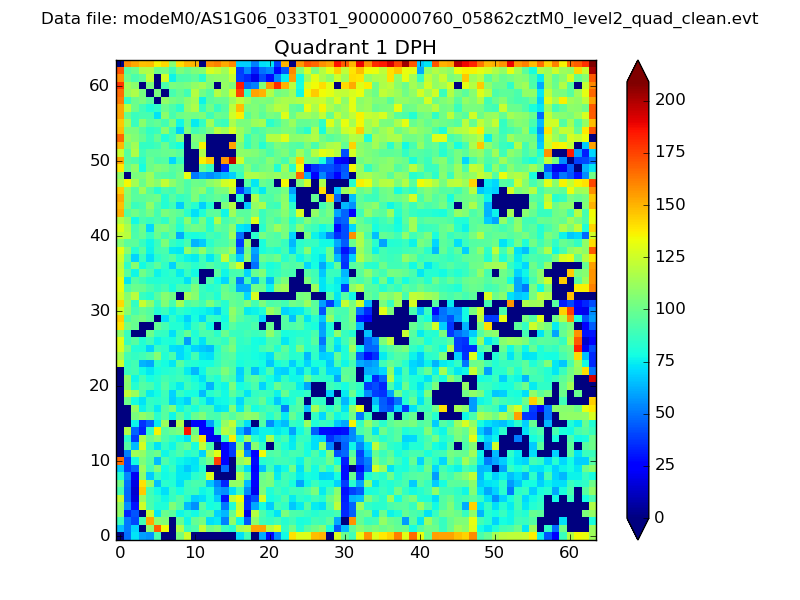
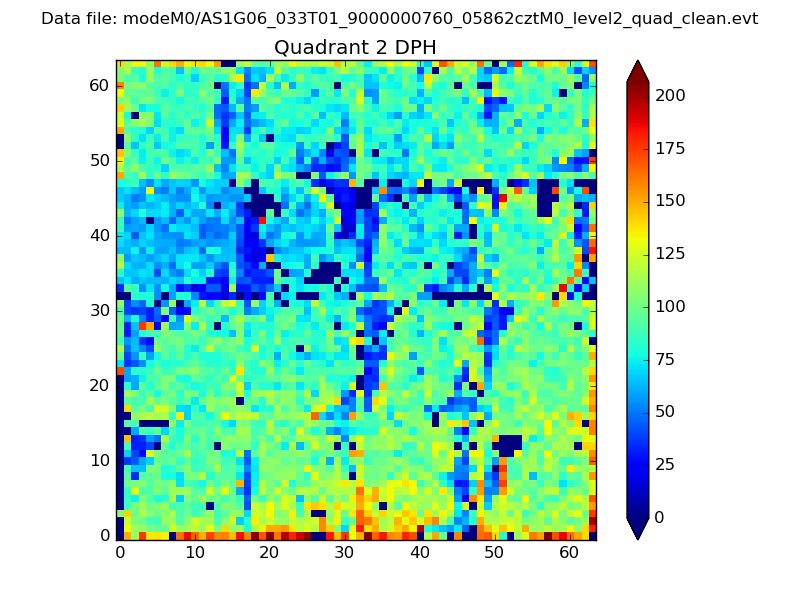
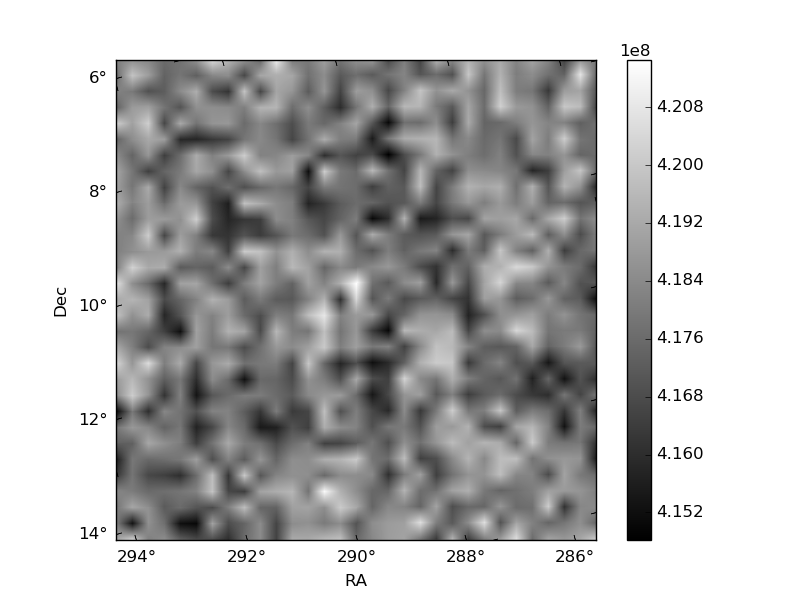
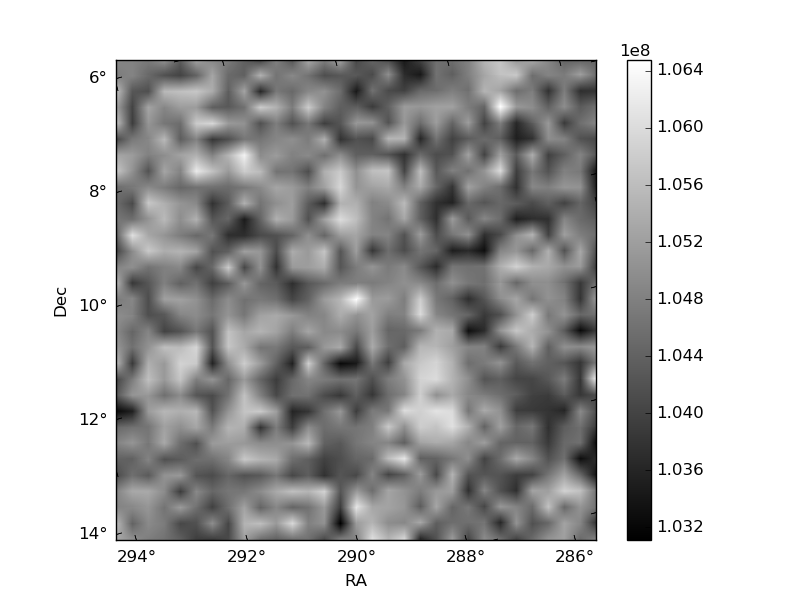
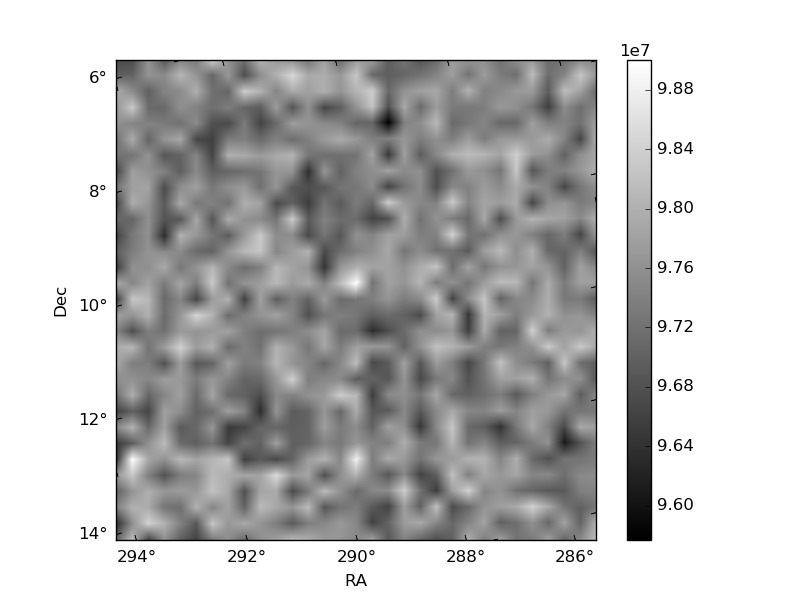
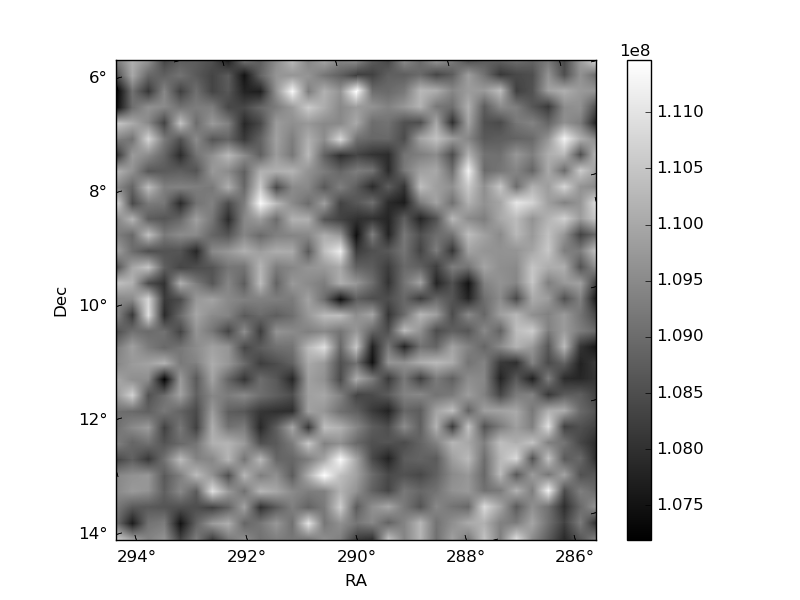
Histogram calculated using DETX and DETY for each event in the final _common_clean file
| Quadrant A | 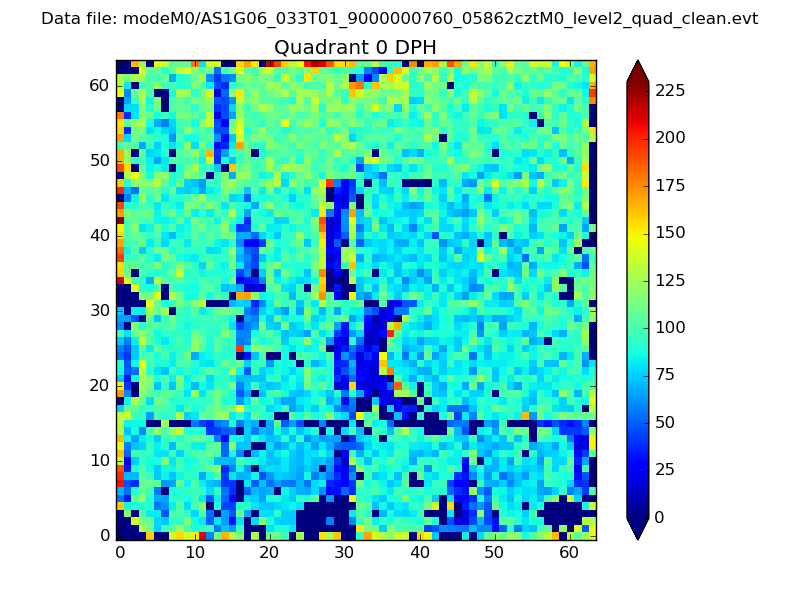 |
 |
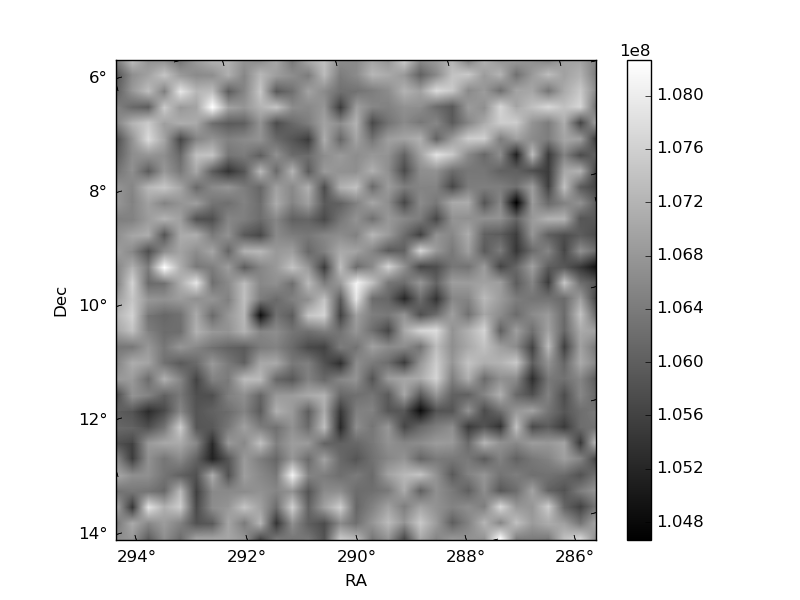
Quadrant B |
|---|---|---|---|
| Quadrant D | 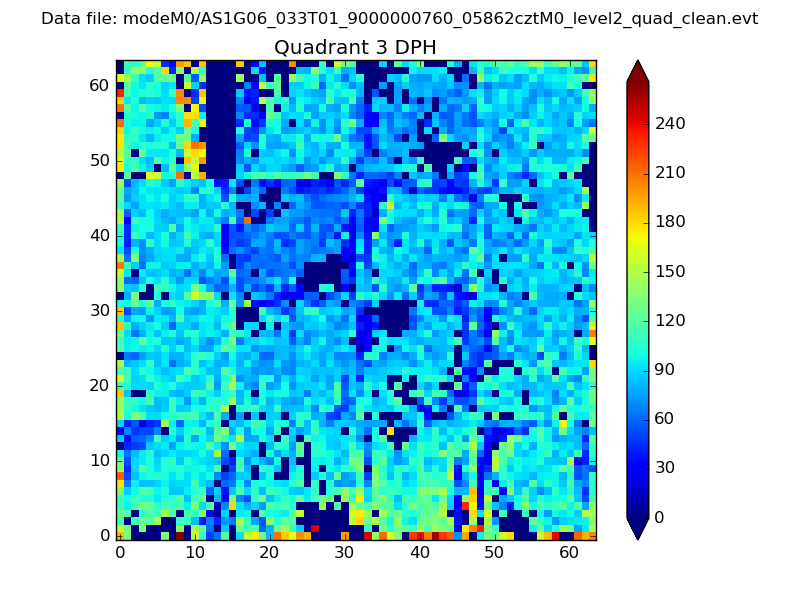 |
 |
Quadrant C |
| Plot type | Count rate plots | Images |
|---|---|---|
| Comparison with Poisson distribution Blue bars denote a histogram of data divided into 1 sec bins. Red curve is a Poisson curve with rate = median count rate of data. |
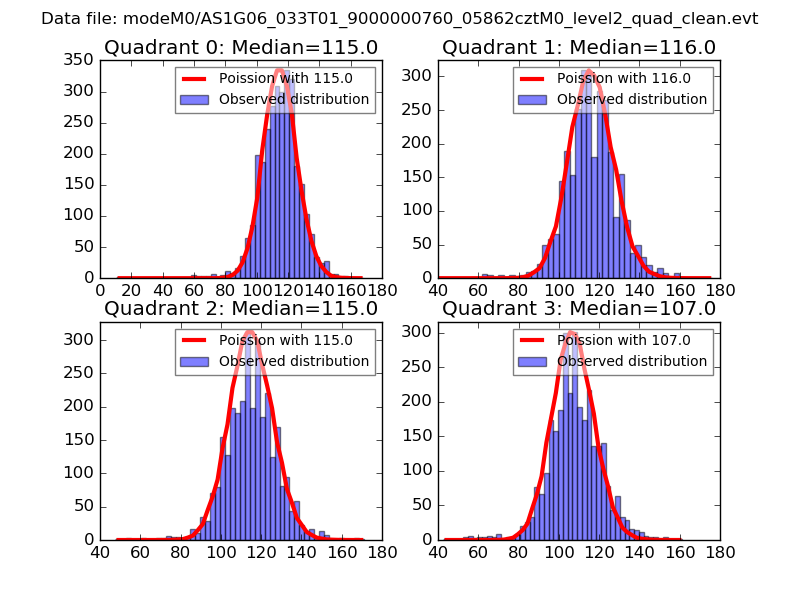 |
 |
| Quadrant-wise count rates Data is divided into 100 sec bins |
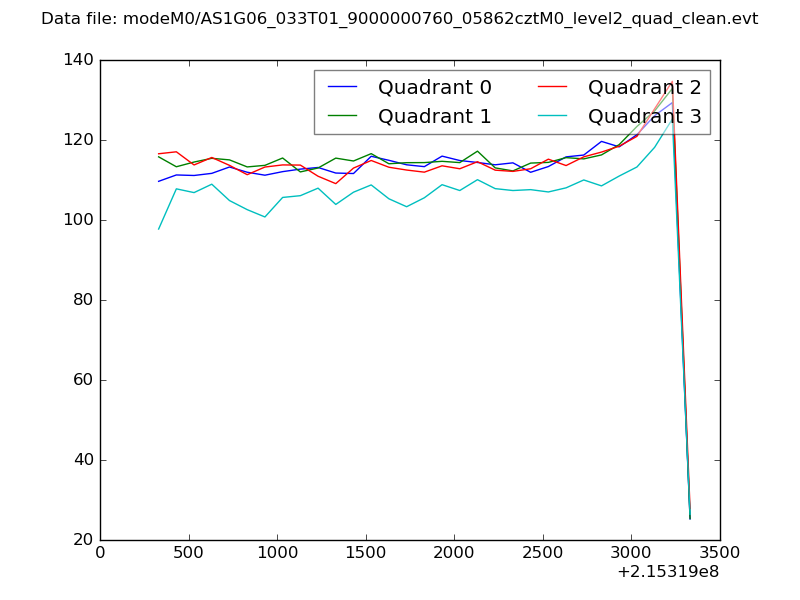 |
|
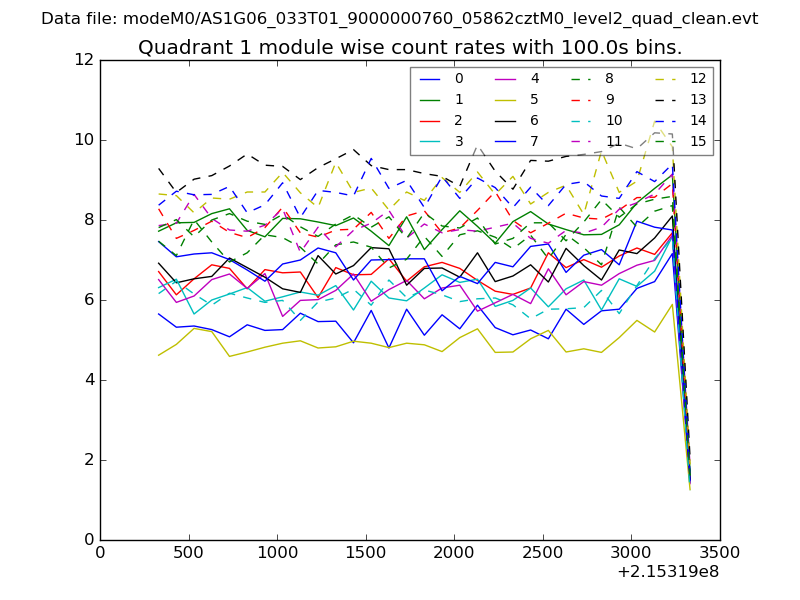
| Module-wise count rates for Quadrant A Data is divided into 100 sec bins |
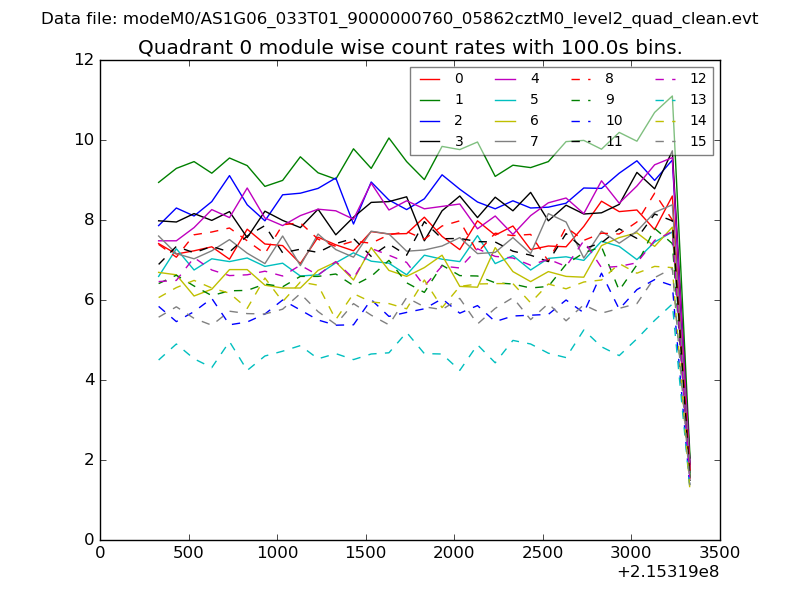 |
 |
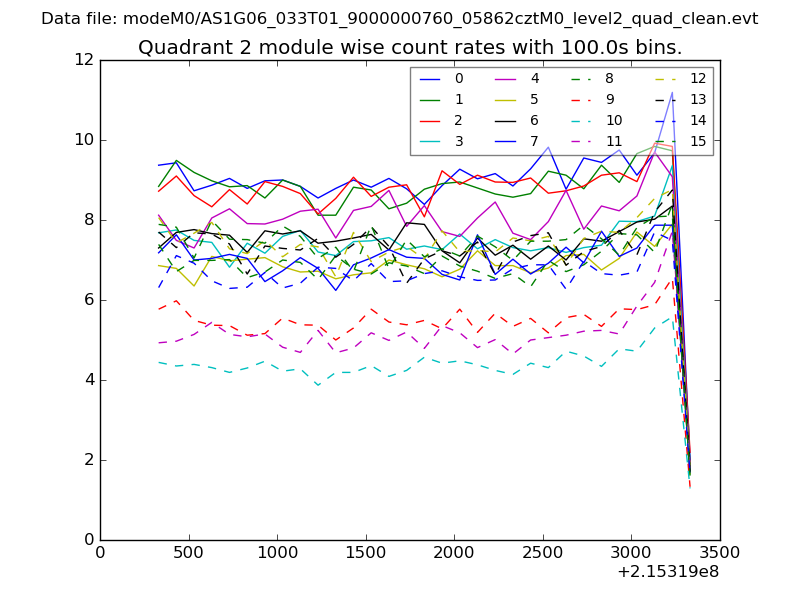
| Module-wise count rates for Quadrant B Data is divided into 100 sec bins |
 |
 |
| Module-wise count rates for Quadrant C Data is divided into 100 sec bins |
 |
 |
| Module-wise count rates for Quadrant D Data is divided into 100 sec bins |
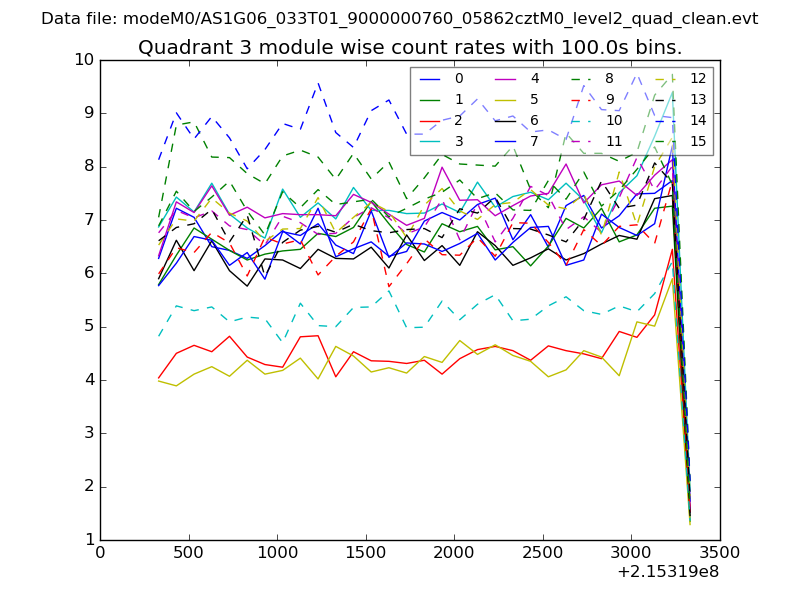 |
 |
| Parameter | Plot |
|---|---|
| CZT HV Monitor | 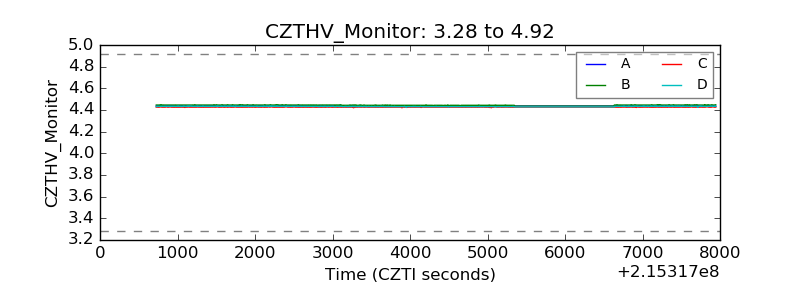 |
| D_VDD | 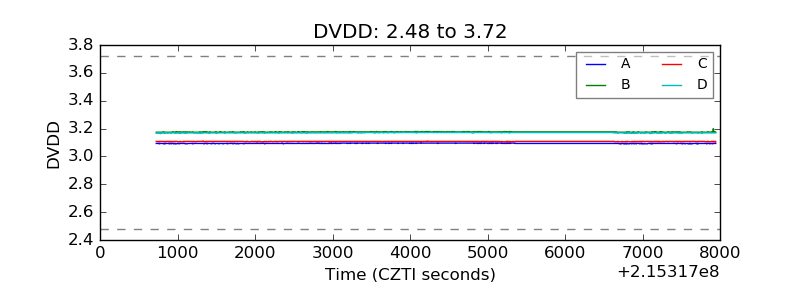 |
| Temperature 1 | 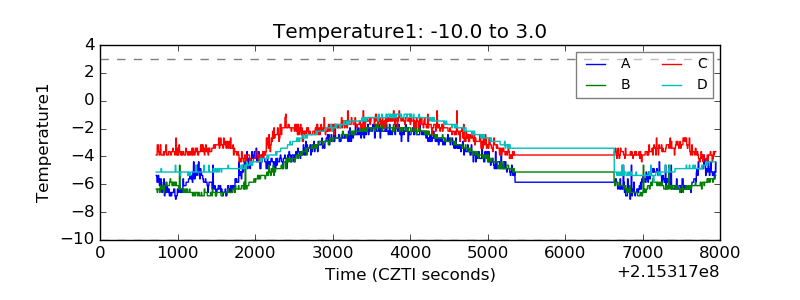 |
| Veto HV Monitor | 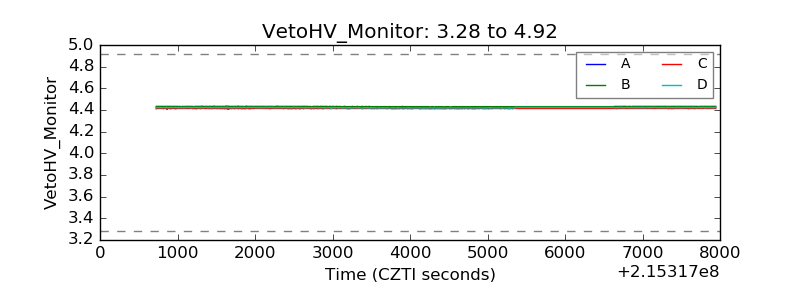 |
| Veto LLD | 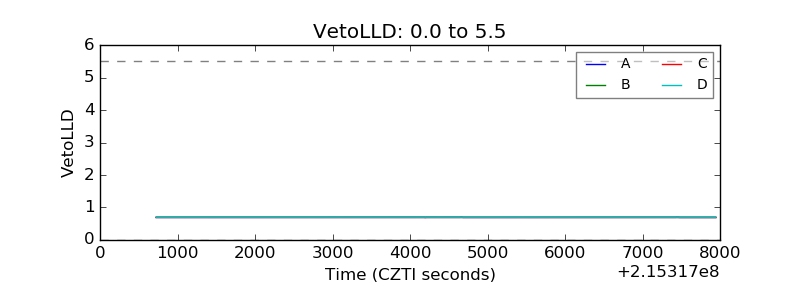 |
| Alpha Counter | 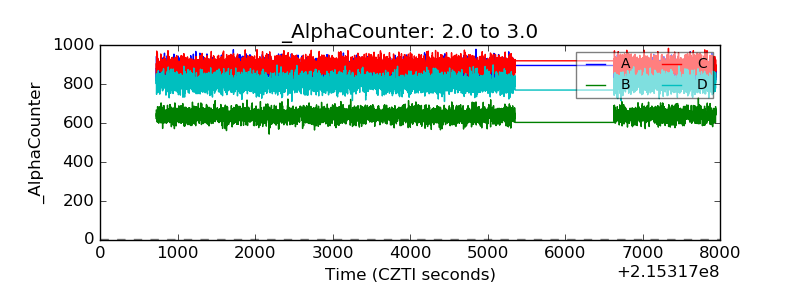 |
| _CPM_Rate | 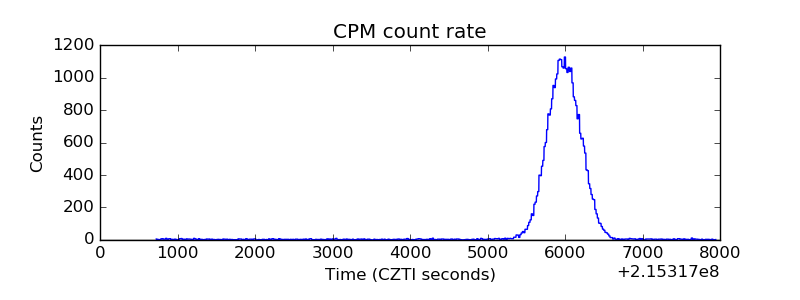 |
| CZT Counter | 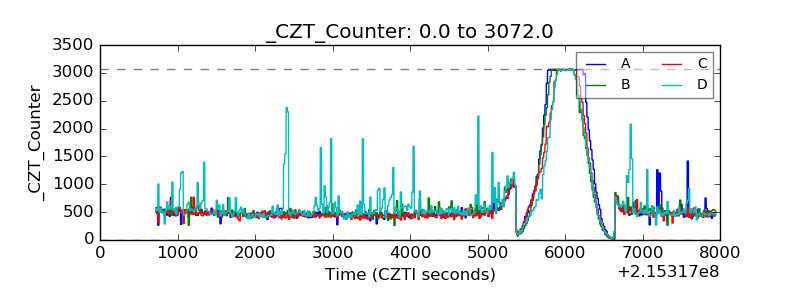 |
| +2.5 Volts monitor | 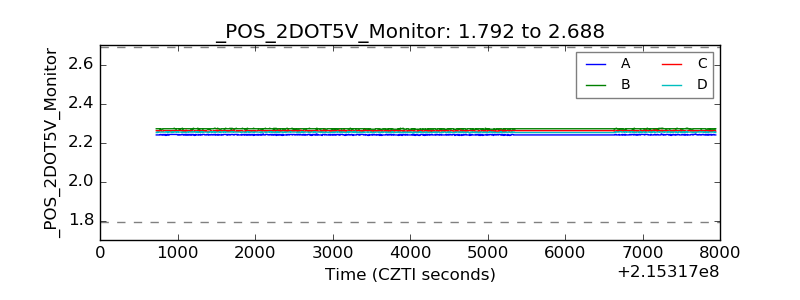 |
| +5 Volts monitor |  |
| _ROLL_ROT | 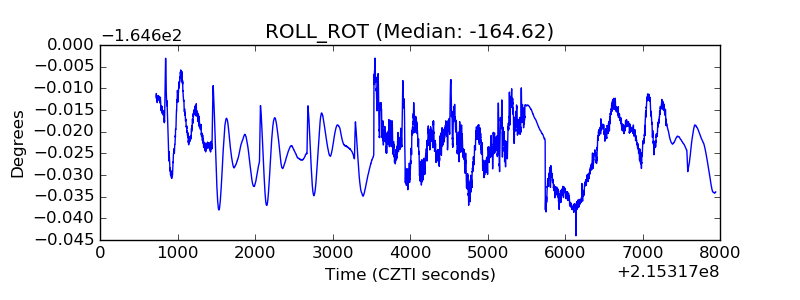 |
| _Roll_DEC | 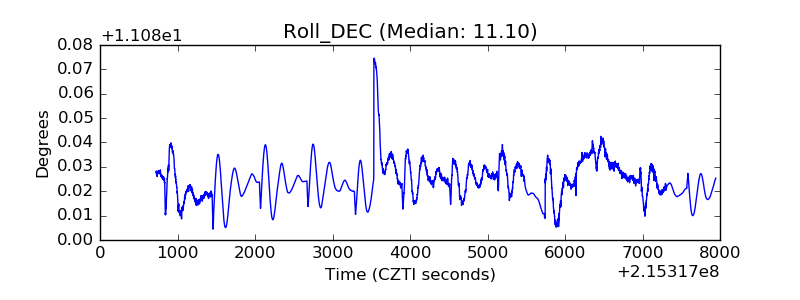 |
| _Roll_RA | 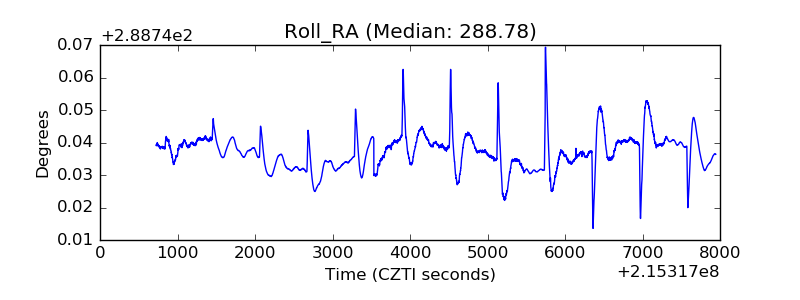 |
| Veto Counter | 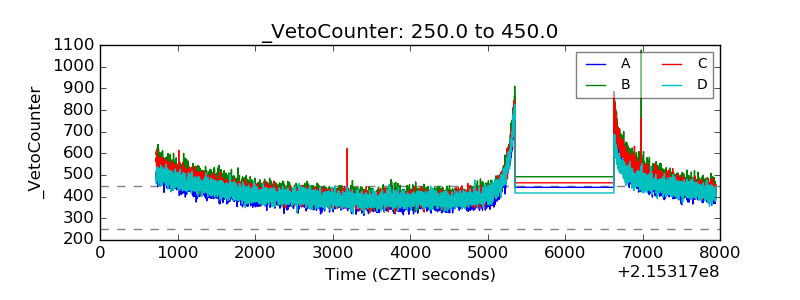 |