| Param | Original file | Final file |
|---|---|---|
| Filename | modeM0/AS1G06_033T01_9000000760_05864cztM0_level2.evt | modeM0/AS1G06_033T01_9000000760_05864cztM0_level2_quad_clean.evt |
| Size (bytes) | 520,136,640 | 75,864,960 |
| Size | 496.0 MB | 72.4 MB |
| Events in quadrant A | 3,269,005 | 464,311 |
| Events in quadrant B | 3,488,712 | 465,855 |
| Events in quadrant C | 3,220,667 | 463,880 |
| Events in quadrant D | 5,310,121 | 427,361 |
| Mode SS | |||
|---|---|---|---|
| Quadrant | BADHDUFLAG | Total packets | Discarded packets |
| A | 0 | 138 | 2 |
| B | 0 | 138 | 0 |
| C | 0 | 138 | 0 |
| D | 0 | 138 | 0 |
| Mode M0 | |||
|---|---|---|---|
| Quadrant | BADHDUFLAG | Total packets | Discarded packets |
| A | 0 | 14192 | 5 |
| B | 0 | 14591 | 11 |
| C | 0 | 14162 | 2 |
| D | 0 | 20265 | 13 |
| Mode M9 | |||
|---|---|---|---|
| Quadrant | BADHDUFLAG | Total packets | Discarded packets |
| A | 0 | 13 | 0 |
| B | 0 | 13 | 0 |
| C | 0 | 13 | 0 |
| D | 0 | 14 | 0 |
| Quadrant | Total seconds | Saturated seconds | Saturation percentage |
|---|---|---|---|
| A | 6831 | 175 | 2.561850% |
| B | 6828 | 210 | 3.075571% |
| C | 6832 | 132 | 1.932084% |
| D | 6830 | 843 | 12.342606% |
Noise dominated data is calculated using 1-second bins in cleaned event files. If a bin has >2000 counts, and if more than 50% of those come from <1% of pixels, then it is considered to be noise-dominated and hence unusable.
| Quadrant | # 1 sec bins | Bins with >0 counts | Bins with >2000 counts | High rate bins dominated by noise | Noise dominated (total time) | Noise dominated (detector-on time) | Marked lightcurve |
|---|---|---|---|---|---|---|---|
| A | 7697 | 6832 | 0 | 0 | 0.00% | 0.00% | 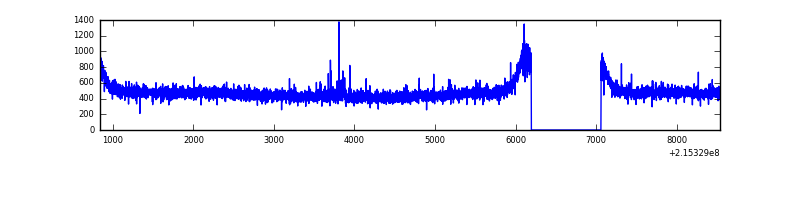 |
| B | 7697 | 6833 | 5 | 5 | 0.06% | 0.07% | 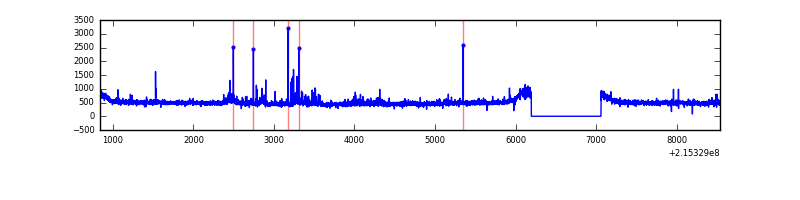 |
| C | 7697 | 6833 | 1 | 1 | 0.01% | 0.01% | 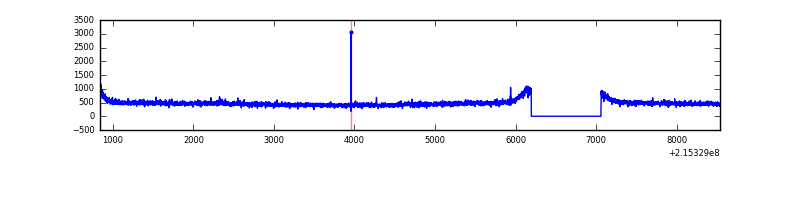 |
| D | 7697 | 6832 | 650 | 650 | 8.44% | 9.51% |  |
Top three noisy pixels from each quadrant. If the there are fewer than three noisy pixels in the level2.evt file, extra rows are filled as -1
| Pixel properties | Quadrant properties | ||||||
|---|---|---|---|---|---|---|---|
| Quadrant | DetID | PixID | Counts | Sigma | Mean | Median | Sigma |
| A | 7 | 16 | 8377 | 43.45 | 846 | 830 | 173.7 |
| A | 12 | 194 | 8160 | 42.2 | 846 | 830 | 173.7 |
| A | 0 | 226 | 8049 | 41.56 | 846 | 830 | 173.7 |
| B | 15 | 204 | 96657 | 579.87 | 850 | 832 | 165.3 |
| B | 15 | 85 | 31777 | 187.26 | 850 | 832 | 165.3 |
| B | 0 | 214 | 21190 | 123.19 | 850 | 832 | 165.3 |
| C | 14 | 67 | 12537 | 61.55 | 816 | 821 | 190.4 |
| C | 13 | 61 | 6525 | 29.96 | 816 | 821 | 190.4 |
| C | 8 | 128 | 6306 | 28.81 | 816 | 821 | 190.4 |
| D | 1 | 20 | 1940938 | 10145.25 | 770 | 744 | 191.2 |
| D | 2 | 152 | 255615 | 1332.72 | 770 | 744 | 191.2 |
| D | 2 | 63 | 51630 | 266.08 | 770 | 744 | 191.2 |
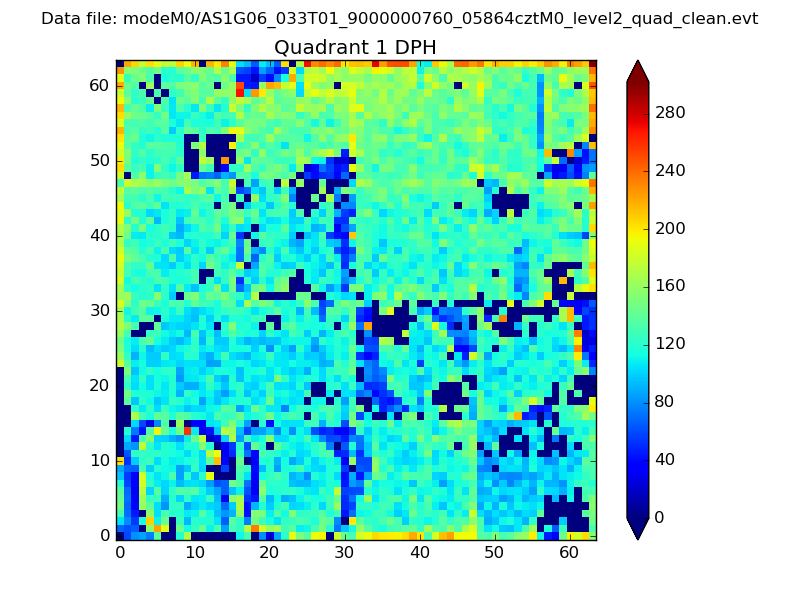
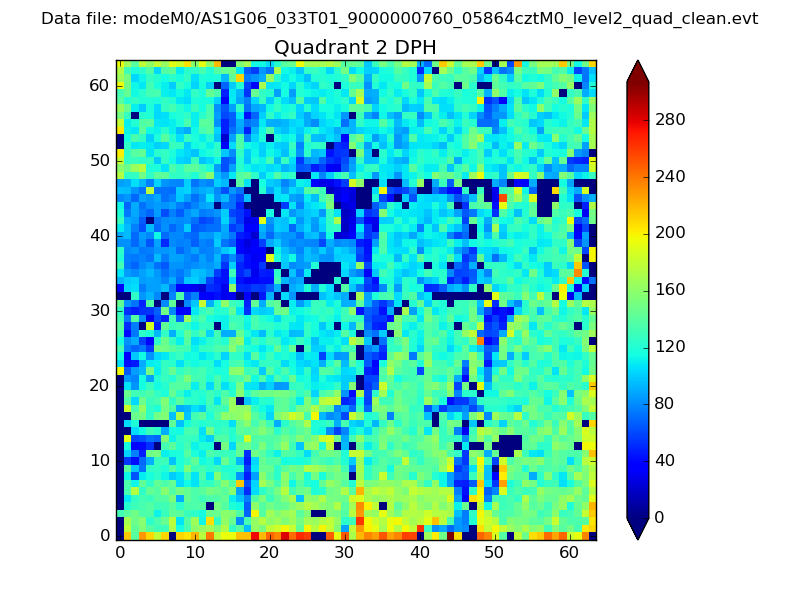
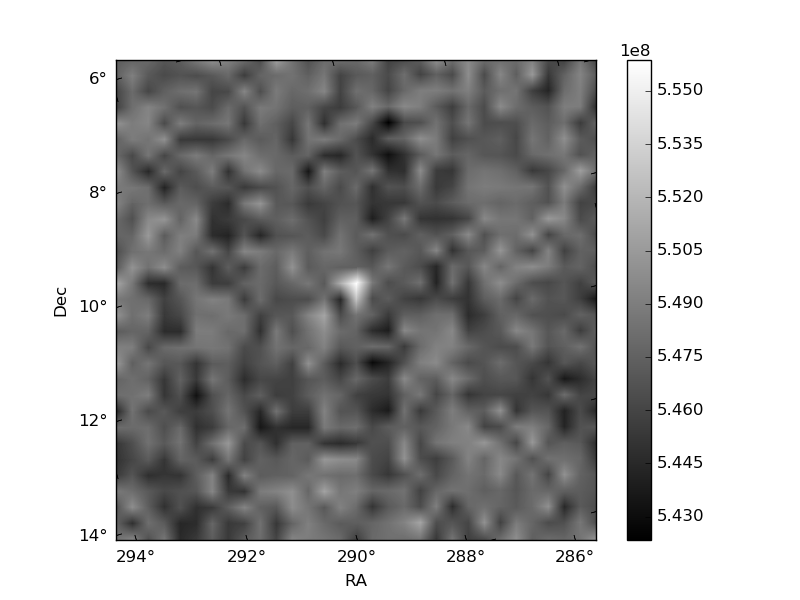
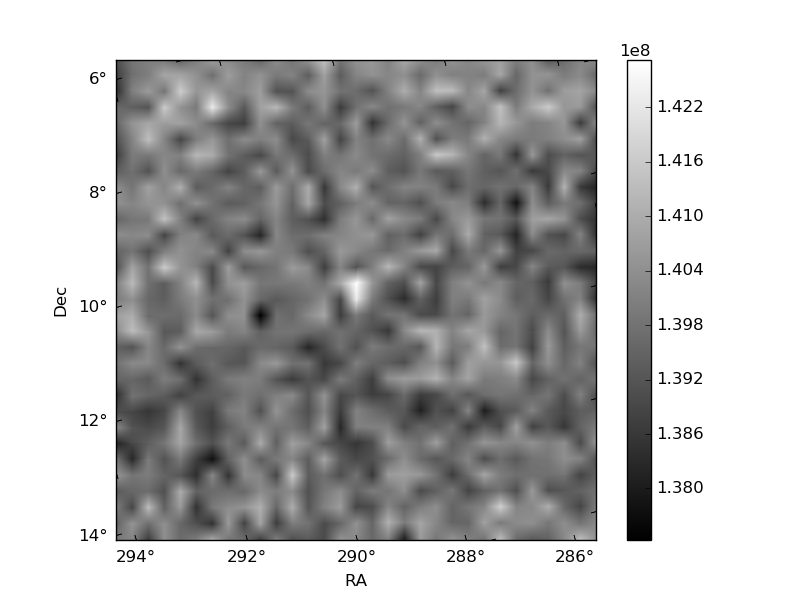
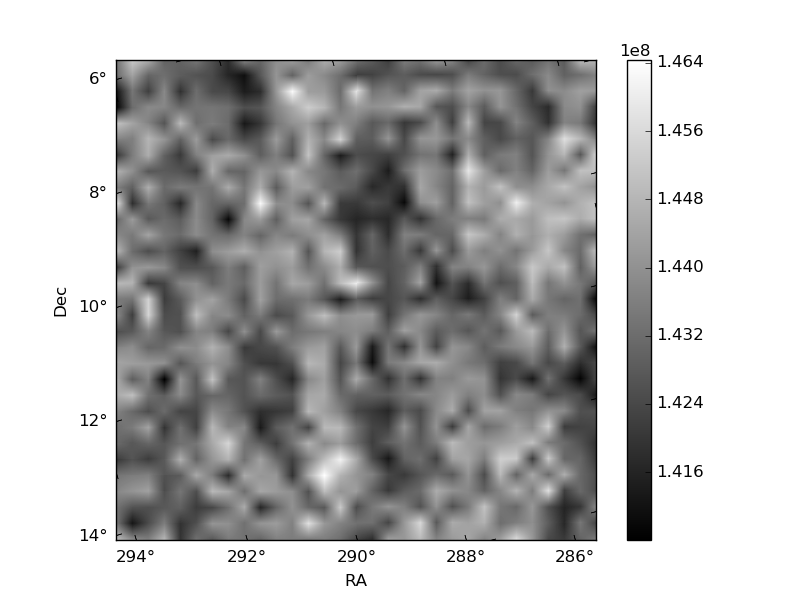
Histogram calculated using DETX and DETY for each event in the final _common_clean file
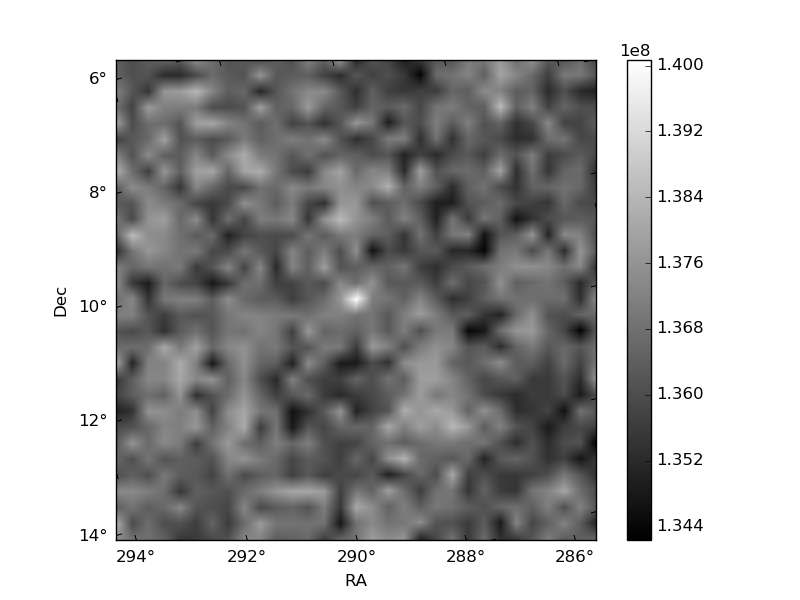
| Quadrant A | 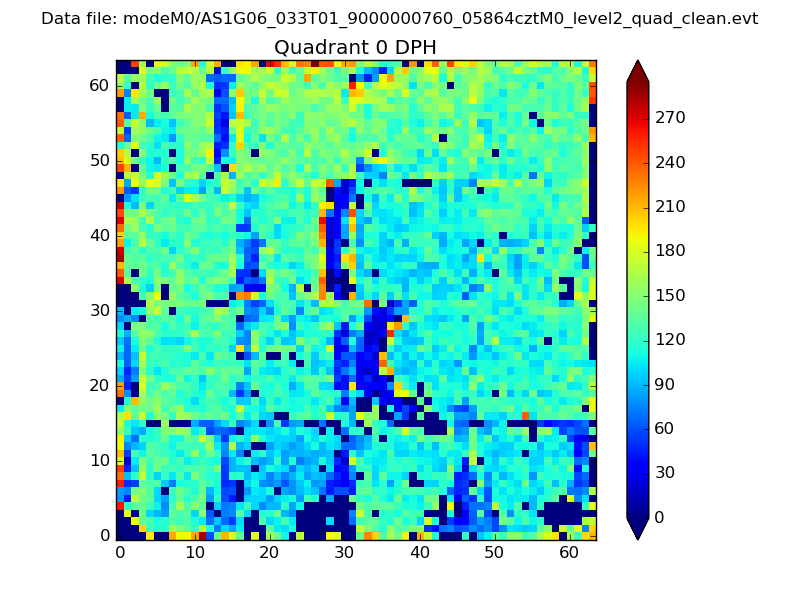 |
 |
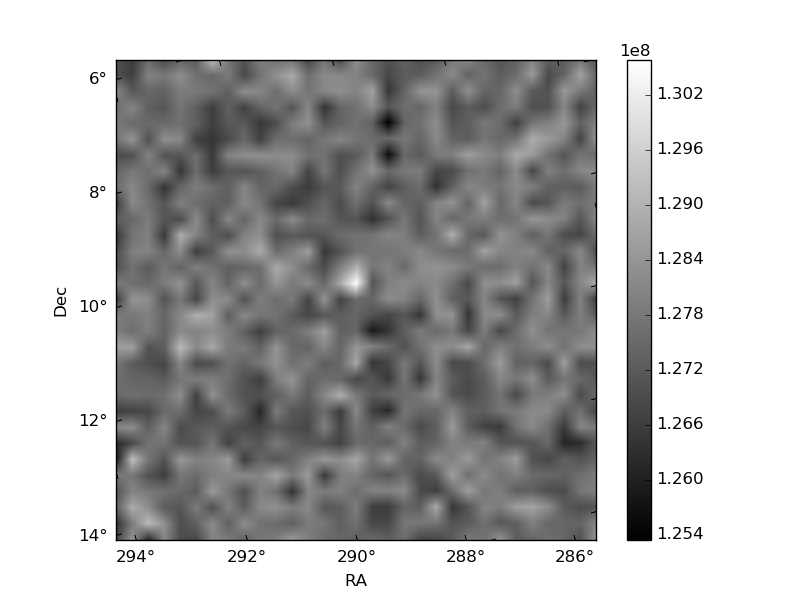
Quadrant B |
|---|---|---|---|
| Quadrant D | 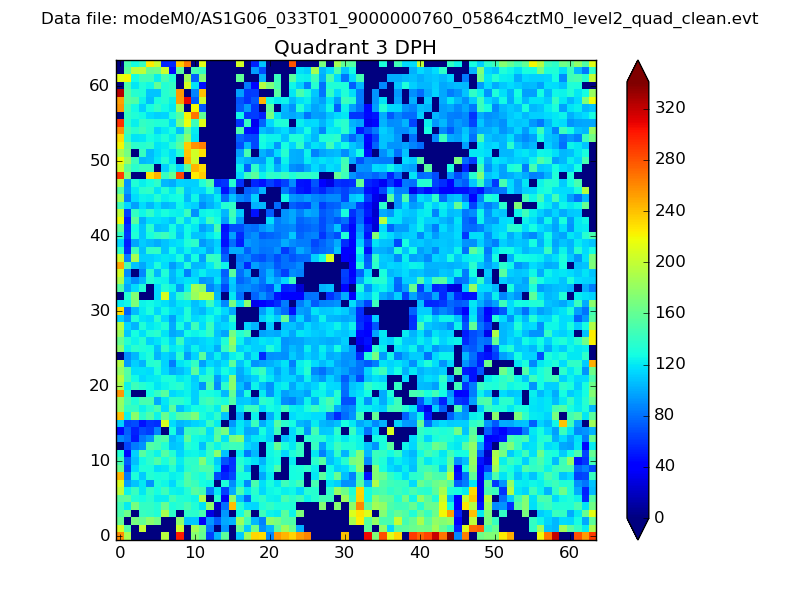 |
 |
Quadrant C |
| Plot type | Count rate plots | Images |
|---|---|---|
| Comparison with Poisson distribution Blue bars denote a histogram of data divided into 1 sec bins. Red curve is a Poisson curve with rate = median count rate of data. |
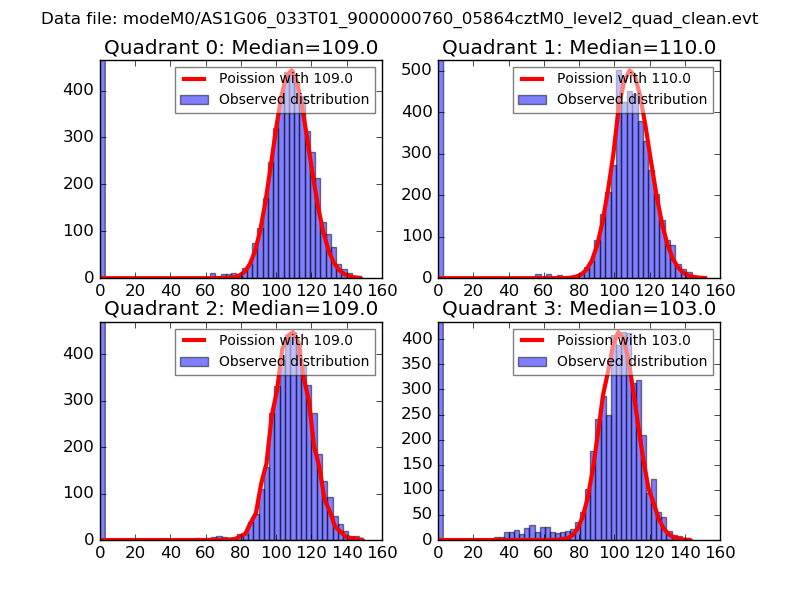 |
 |
| Quadrant-wise count rates Data is divided into 100 sec bins |
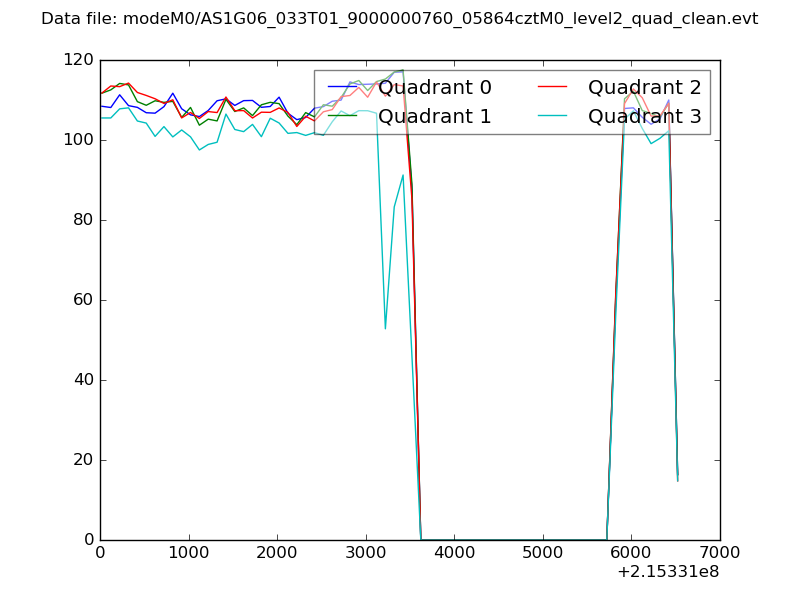 |
|
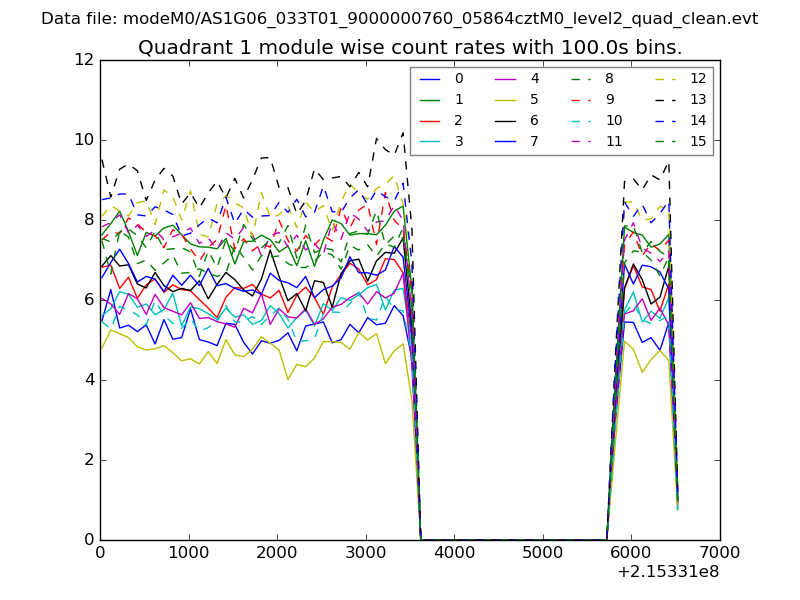
| Module-wise count rates for Quadrant A Data is divided into 100 sec bins |
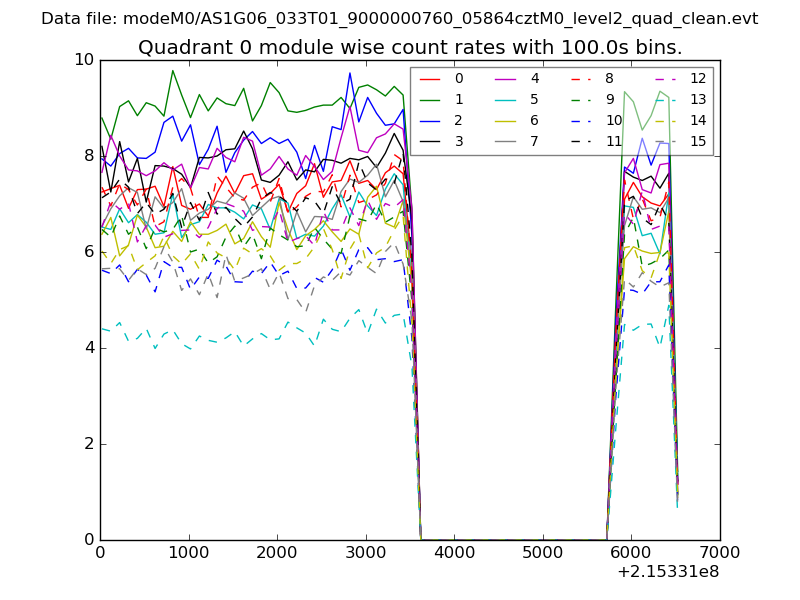 |
 |
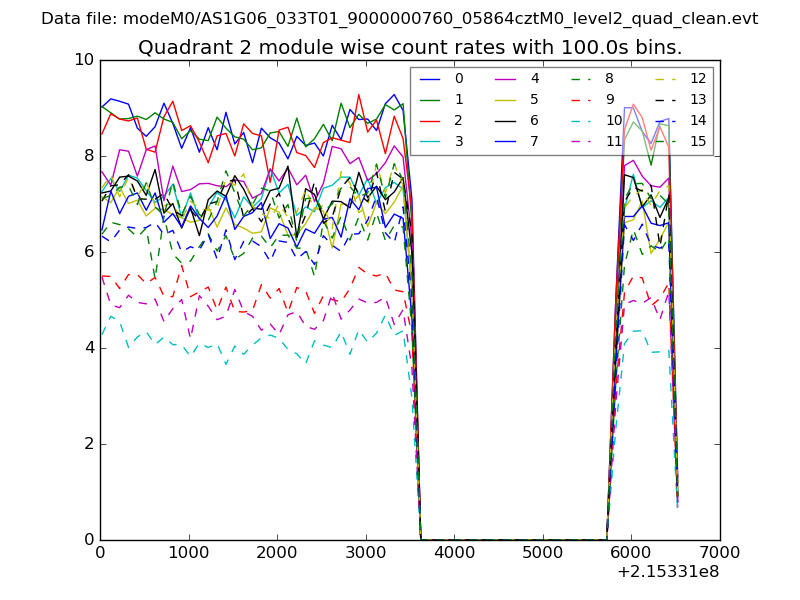
| Module-wise count rates for Quadrant B Data is divided into 100 sec bins |
 |
 |
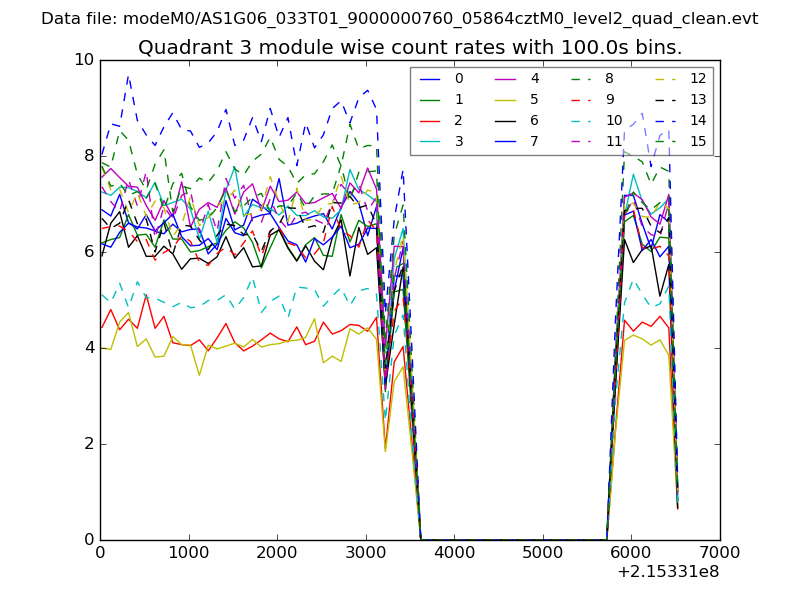
| Module-wise count rates for Quadrant C Data is divided into 100 sec bins |
 |
 |
| Module-wise count rates for Quadrant D Data is divided into 100 sec bins |
 |
 |
| Parameter | Plot |
|---|---|
| CZT HV Monitor | 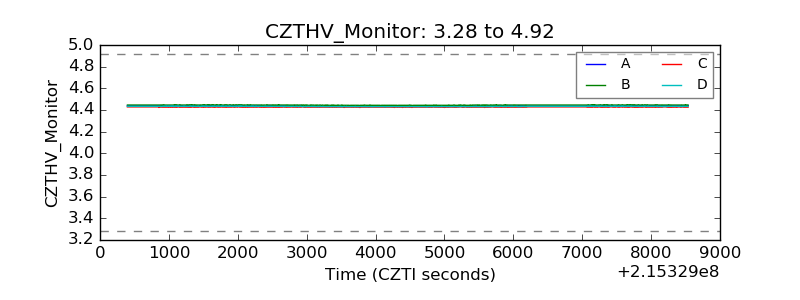 |
| D_VDD |  |
| Temperature 1 | 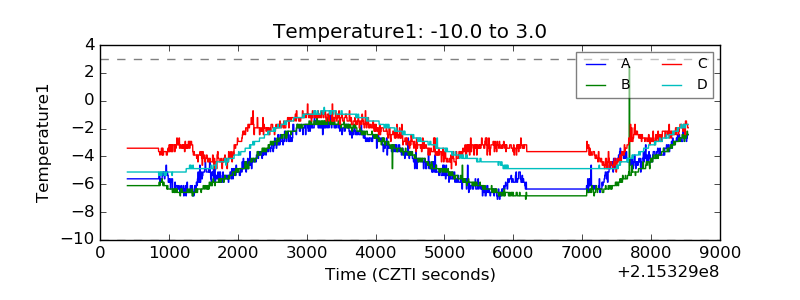 |
| Veto HV Monitor | 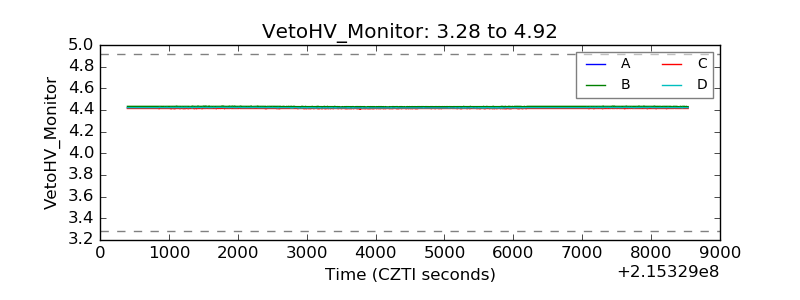 |
| Veto LLD | 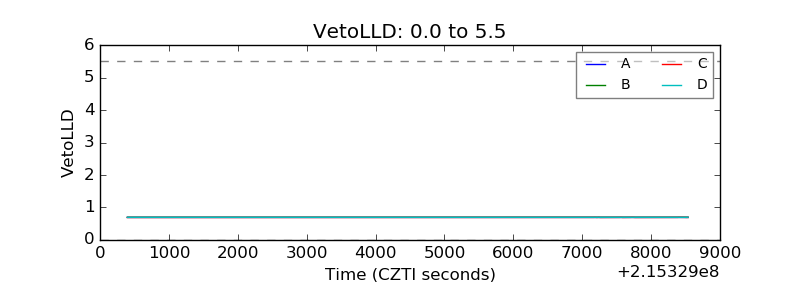 |
| Alpha Counter | 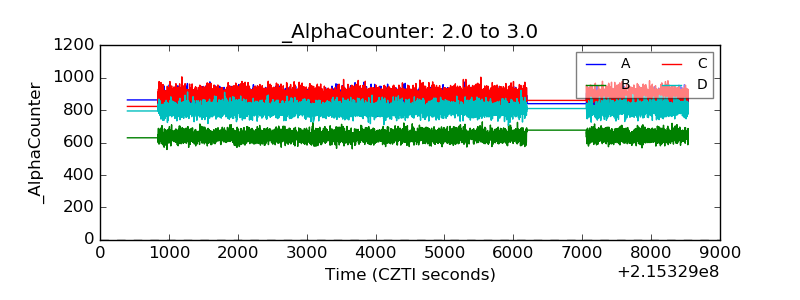 |
| _CPM_Rate | 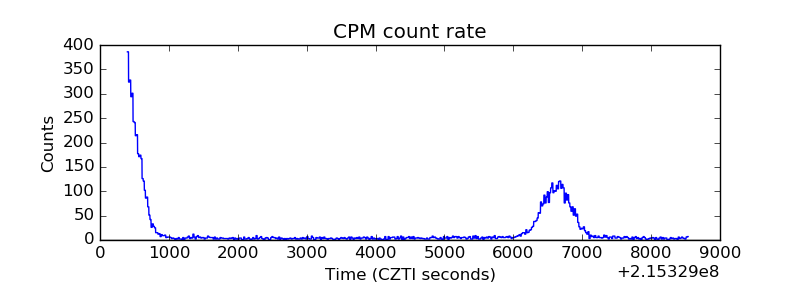 |
| CZT Counter | 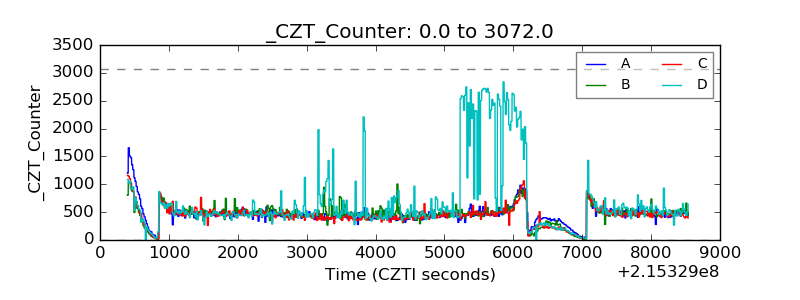 |
| +2.5 Volts monitor |  |
| +5 Volts monitor |  |
| _ROLL_ROT | 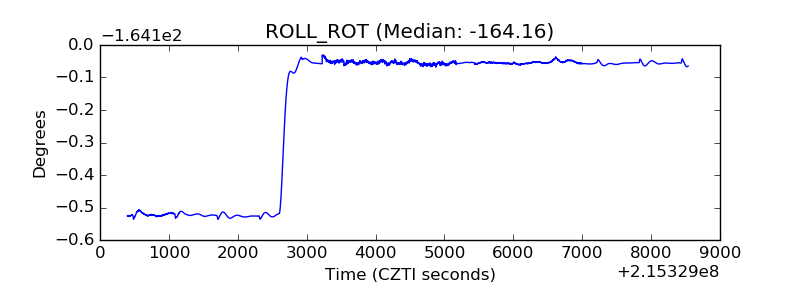 |
| _Roll_DEC | 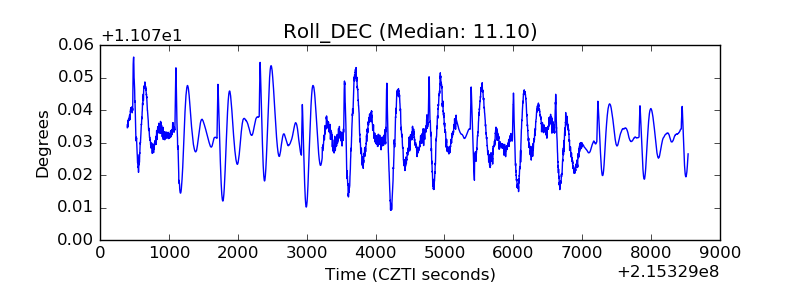 |
| _Roll_RA | 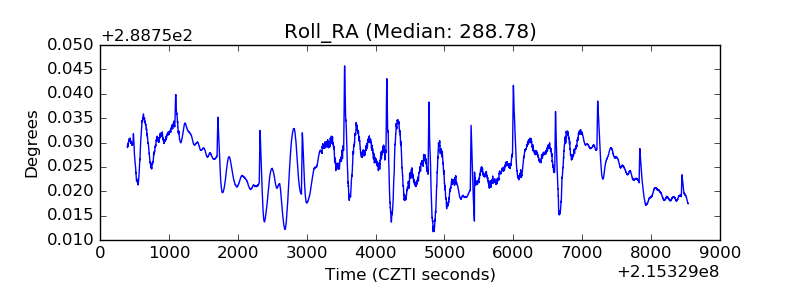 |
| Veto Counter | 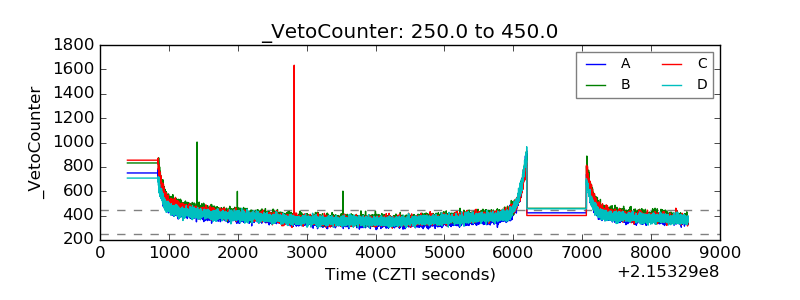 |