| Param | Original file | Final file |
|---|---|---|
| Filename | modeM0/AS1G06_033T01_9000000760_05865cztM0_level2.evt | modeM0/AS1G06_033T01_9000000760_05865cztM0_level2_quad_clean.evt |
| Size (bytes) | 533,712,960 | 77,699,520 |
| Size | 509.0 MB | 74.1 MB |
| Events in quadrant A | 2,998,987 | 492,810 |
| Events in quadrant B | 3,126,481 | 493,391 |
| Events in quadrant C | 2,943,081 | 493,590 |
| Events in quadrant D | 6,655,464 | 421,600 |
| Mode SS | |||
|---|---|---|---|
| Quadrant | BADHDUFLAG | Total packets | Discarded packets |
| A | 0 | 134 | 0 |
| B | 0 | 134 | 0 |
| C | 0 | 134 | 0 |
| D | 0 | 134 | 0 |
| Mode M0 | |||
|---|---|---|---|
| Quadrant | BADHDUFLAG | Total packets | Discarded packets |
| A | 0 | 13357 | 32 |
| B | 0 | 13551 | 45 |
| C | 0 | 13294 | 21 |
| D | 0 | 23957 | 44 |
| Mode M9 | |||
|---|---|---|---|
| Quadrant | BADHDUFLAG | Total packets | Discarded packets |
| A | 0 | 4 | 0 |
| B | 0 | 4 | 0 |
| C | 0 | 4 | 0 |
| D | 0 | 4 | 0 |
| Quadrant | Total seconds | Saturated seconds | Saturation percentage |
|---|---|---|---|
| A | 6460 | 153 | 2.368421% |
| B | 6453 | 144 | 2.231520% |
| C | 6465 | 61 | 0.943542% |
| D | 6458 | 1444 | 22.359864% |
Noise dominated data is calculated using 1-second bins in cleaned event files. If a bin has >2000 counts, and if more than 50% of those come from <1% of pixels, then it is considered to be noise-dominated and hence unusable.
| Quadrant | # 1 sec bins | Bins with >0 counts | Bins with >2000 counts | High rate bins dominated by noise | Noise dominated (total time) | Noise dominated (detector-on time) | Marked lightcurve |
|---|---|---|---|---|---|---|---|
| A | 6920 | 6475 | 5 | 5 | 0.07% | 0.08% |  |
| B | 6920 | 6472 | 3 | 3 | 0.04% | 0.05% | 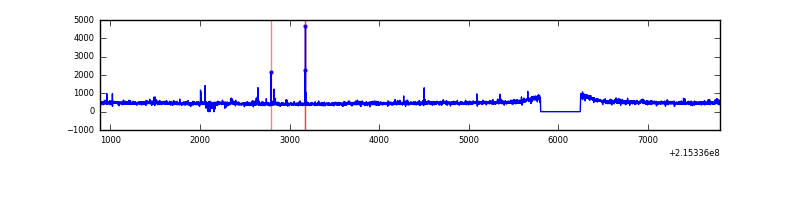 |
| C | 6920 | 6476 | 0 | 0 | 0.00% | 0.00% |  |
| D | 6920 | 6476 | 1254 | 1254 | 18.12% | 19.36% | 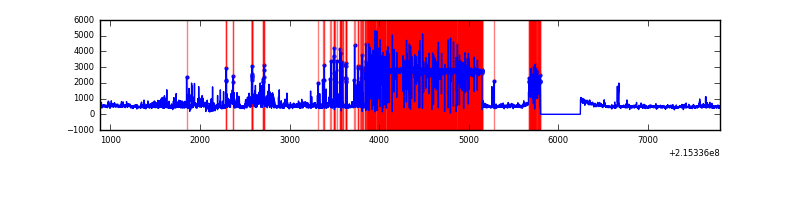 |
Top three noisy pixels from each quadrant. If the there are fewer than three noisy pixels in the level2.evt file, extra rows are filled as -1
| Pixel properties | Quadrant properties | ||||||
|---|---|---|---|---|---|---|---|
| Quadrant | DetID | PixID | Counts | Sigma | Mean | Median | Sigma |
| A | 15 | 234 | 15718 | 94.25 | 770 | 752 | 158.8 |
| A | 15 | 174 | 12403 | 73.38 | 770 | 752 | 158.8 |
| A | 15 | 236 | 8441 | 48.42 | 770 | 752 | 158.8 |
| B | 15 | 204 | 57497 | 373.93 | 774 | 756 | 151.7 |
| B | 0 | 219 | 36006 | 232.3 | 774 | 756 | 151.7 |
| B | 12 | 111 | 13991 | 87.22 | 774 | 756 | 151.7 |
| C | 8 | 128 | 11322 | 60.53 | 746 | 749 | 174.7 |
| C | 1 | 16 | 9582 | 50.57 | 746 | 749 | 174.7 |
| C | 8 | 112 | 6288 | 31.71 | 746 | 749 | 174.7 |
| D | 1 | 20 | 3571532 | 22770.81 | 635 | 614 | 156.8 |
| D | 2 | 14 | 206297 | 1311.59 | 635 | 614 | 156.8 |
| D | 2 | 63 | 184034 | 1169.62 | 635 | 614 | 156.8 |
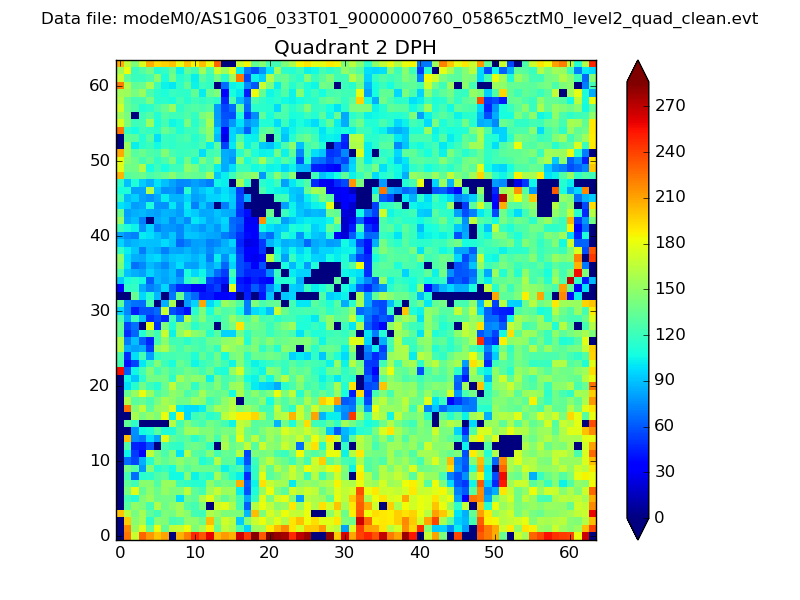
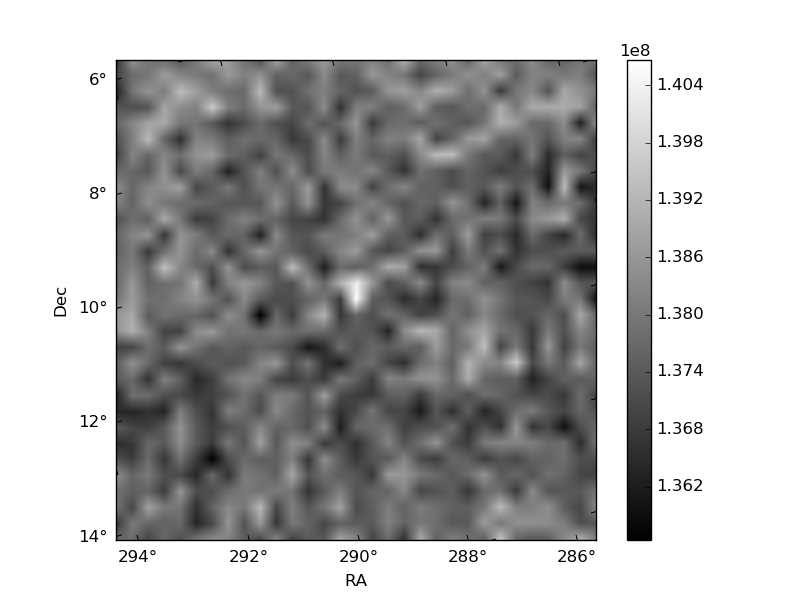
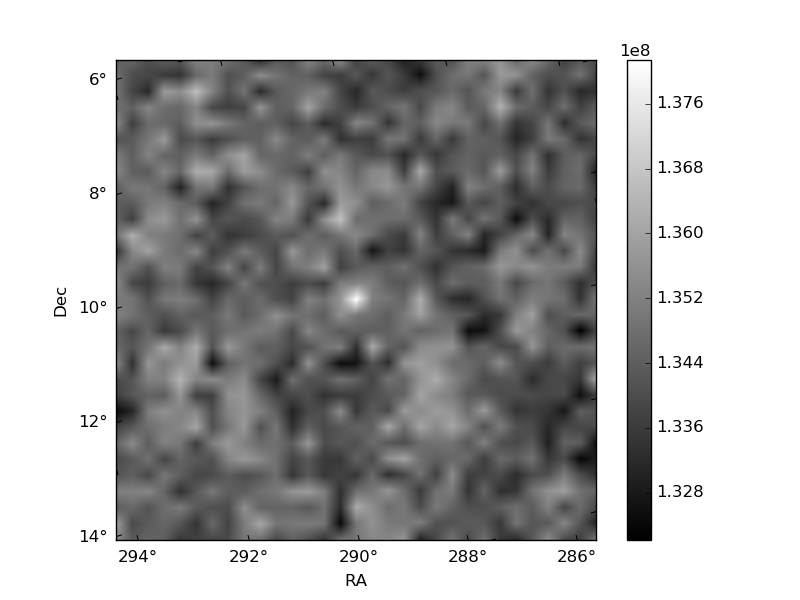
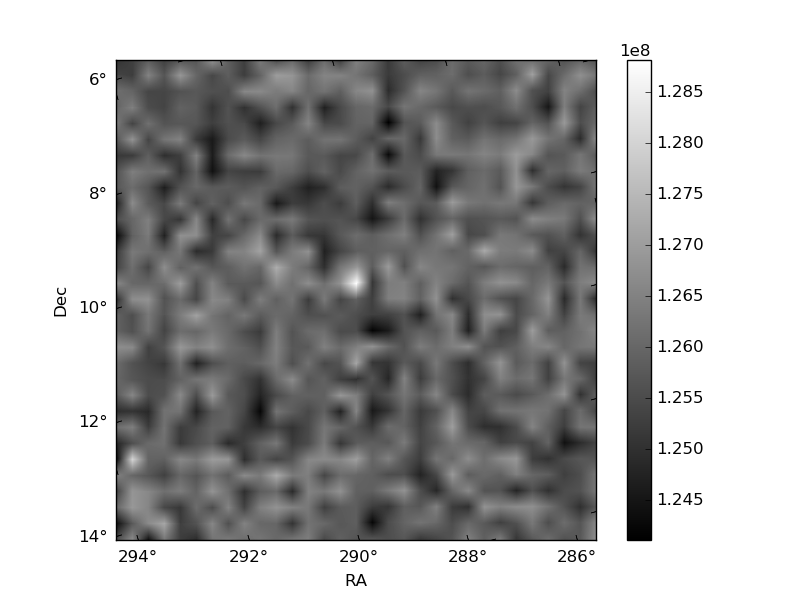
Histogram calculated using DETX and DETY for each event in the final _common_clean file
| Quadrant A | 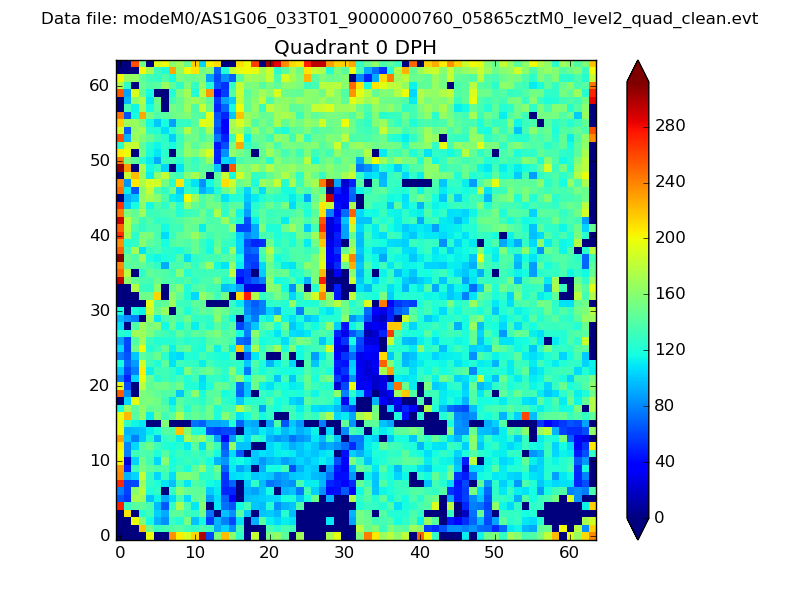 |
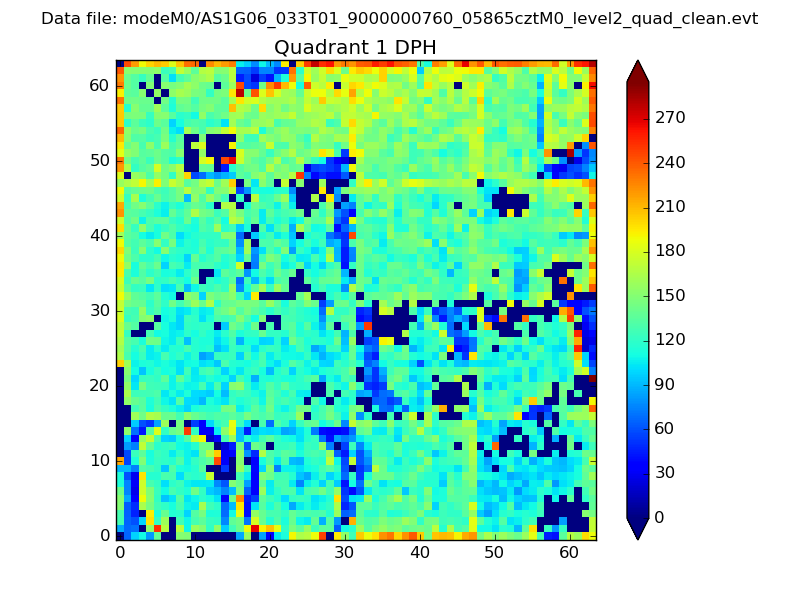 |
Quadrant B |
|---|---|---|---|
| Quadrant D | 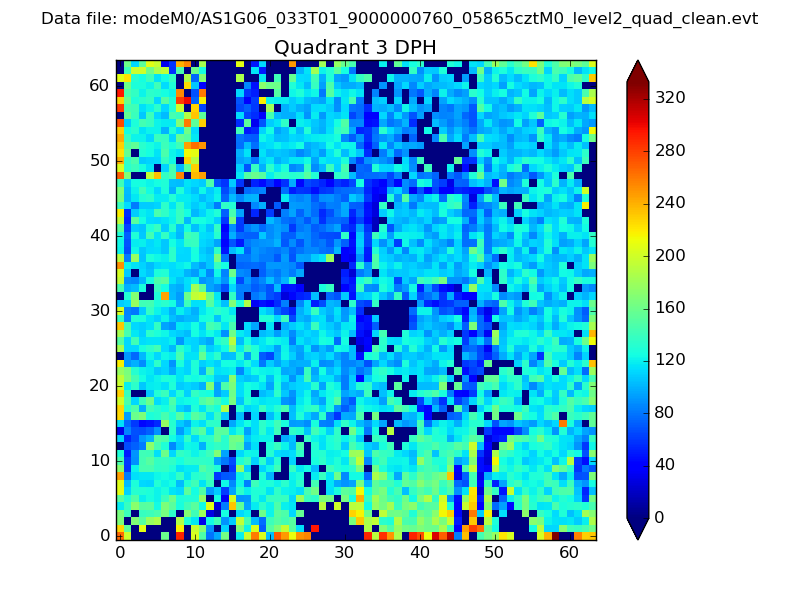 |
 |
Quadrant C |
| Plot type | Count rate plots | Images |
|---|---|---|
| Comparison with Poisson distribution Blue bars denote a histogram of data divided into 1 sec bins. Red curve is a Poisson curve with rate = median count rate of data. |
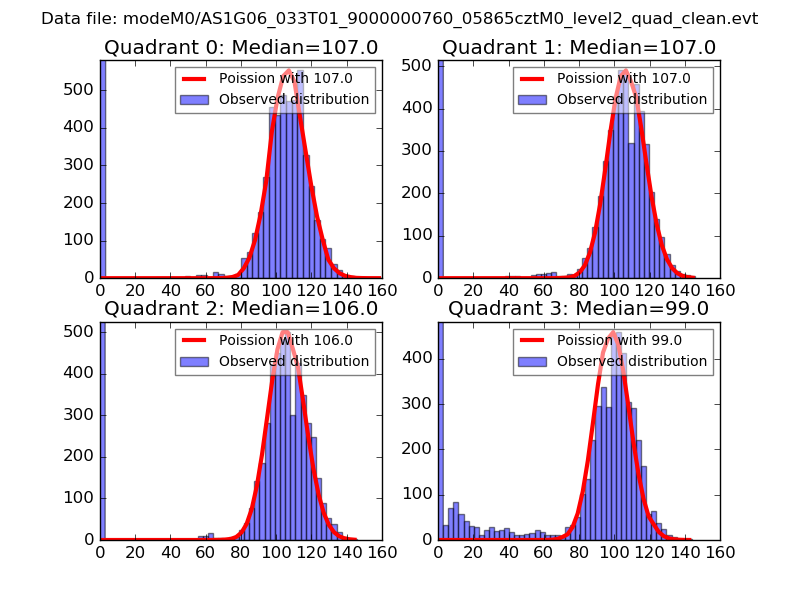 |
 |
| Quadrant-wise count rates Data is divided into 100 sec bins |
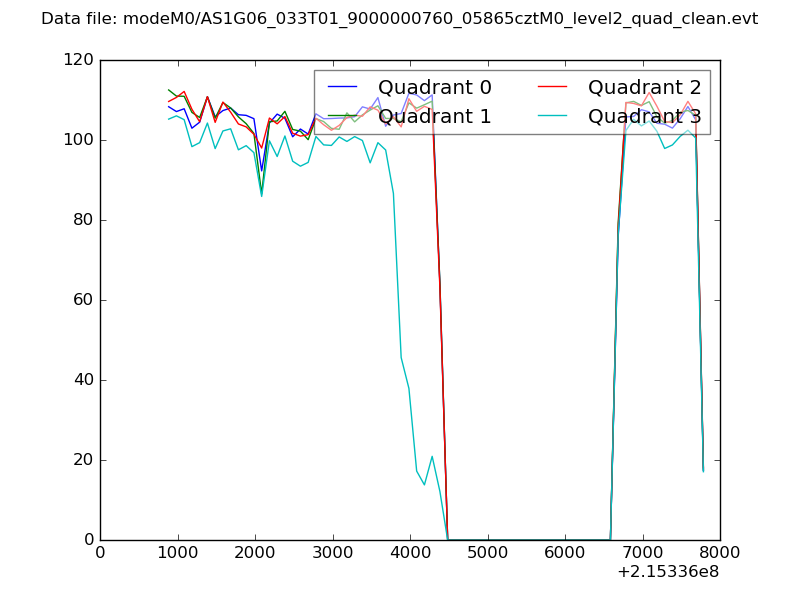 |
|
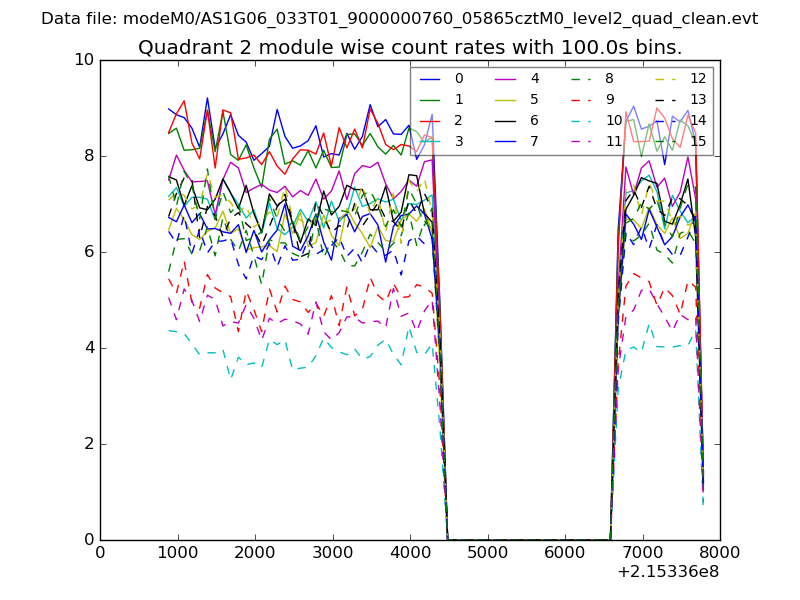
| Module-wise count rates for Quadrant A Data is divided into 100 sec bins |
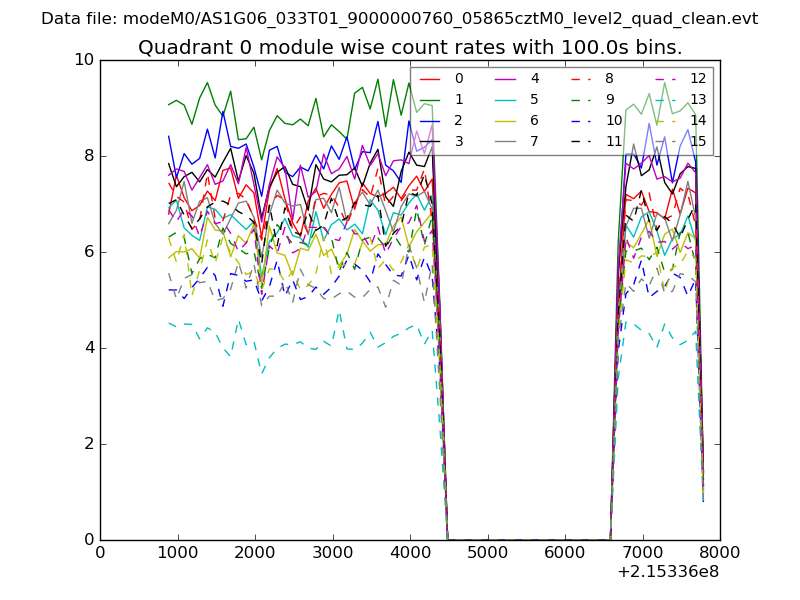 |
 |
| Module-wise count rates for Quadrant B Data is divided into 100 sec bins |
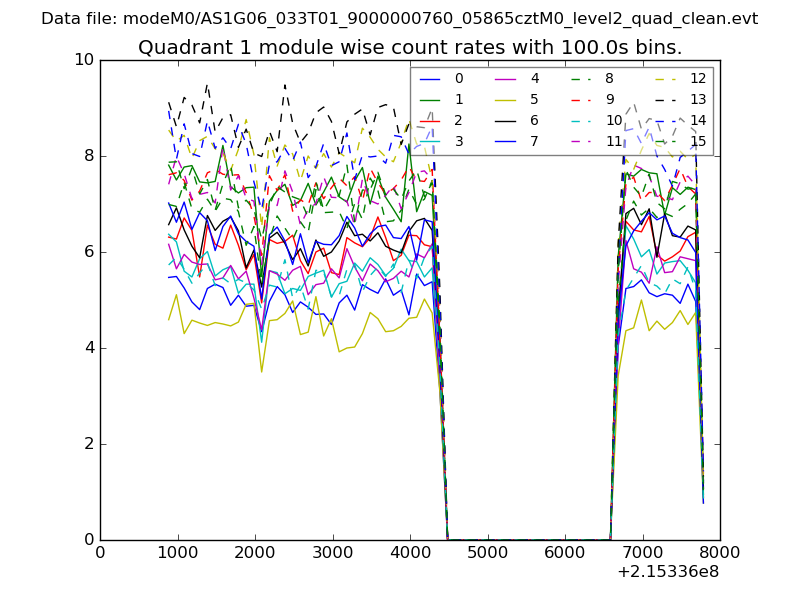 |
 |
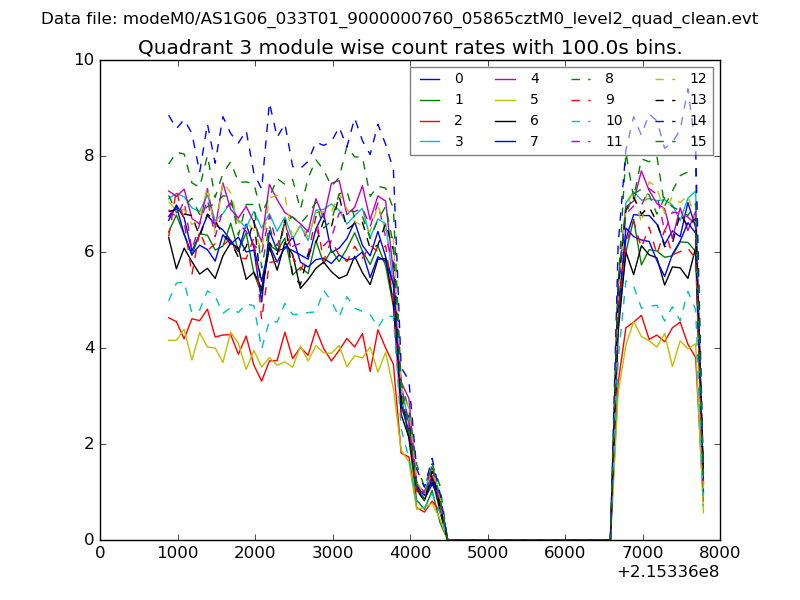
| Module-wise count rates for Quadrant C Data is divided into 100 sec bins |
 |
 |
| Module-wise count rates for Quadrant D Data is divided into 100 sec bins |
 |
 |
| Parameter | Plot |
|---|---|
| CZT HV Monitor | 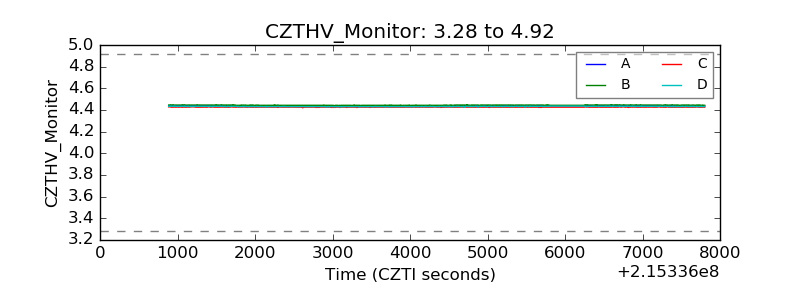 |
| D_VDD | 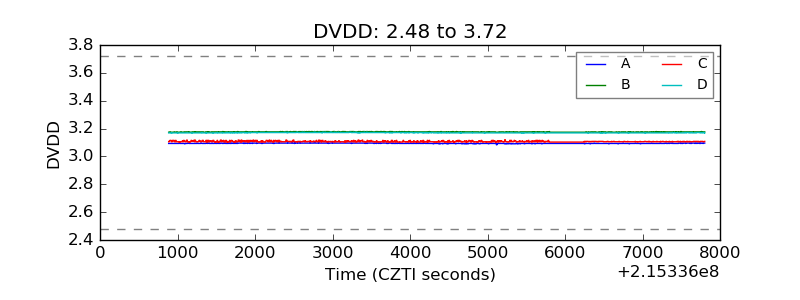 |
| Temperature 1 | 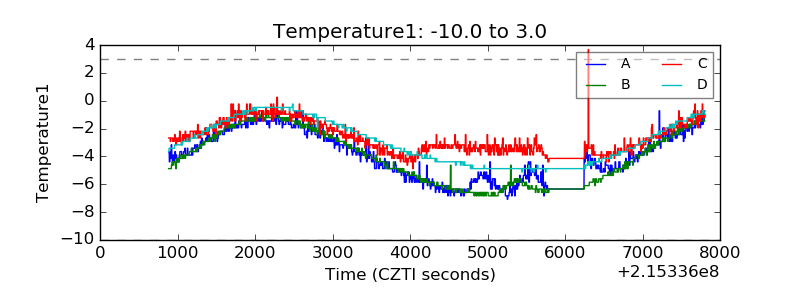 |
| Veto HV Monitor | 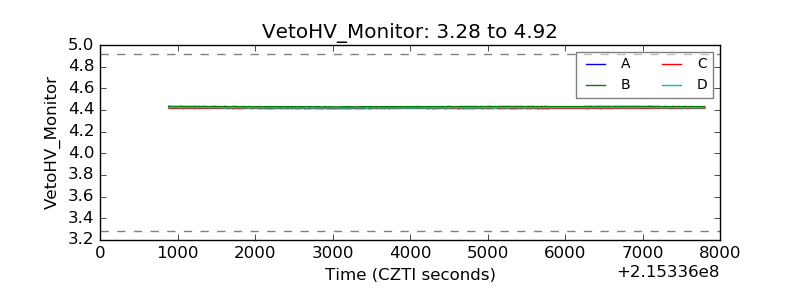 |
| Veto LLD | 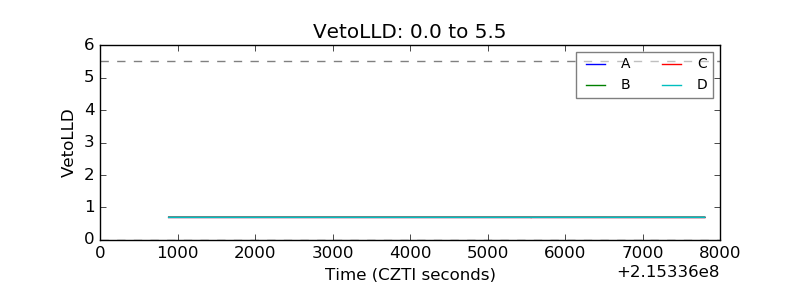 |
| Alpha Counter | 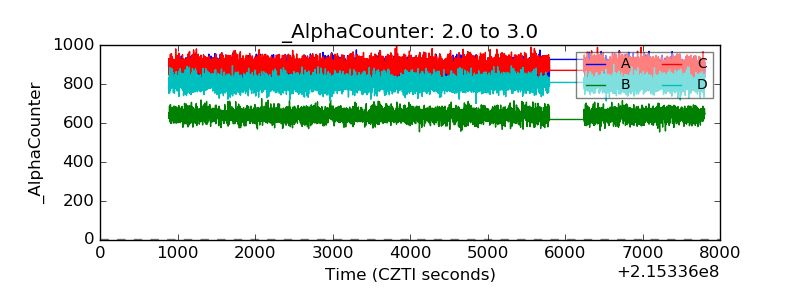 |
| _CPM_Rate | 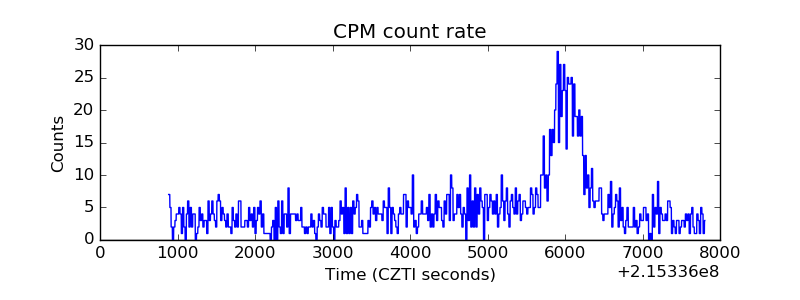 |
| CZT Counter | 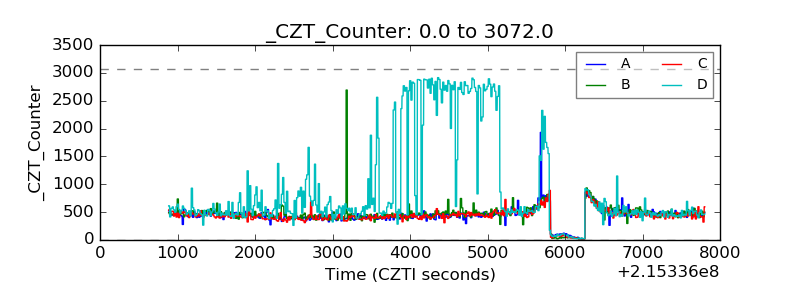 |
| +2.5 Volts monitor |  |
| +5 Volts monitor |  |
| _ROLL_ROT | 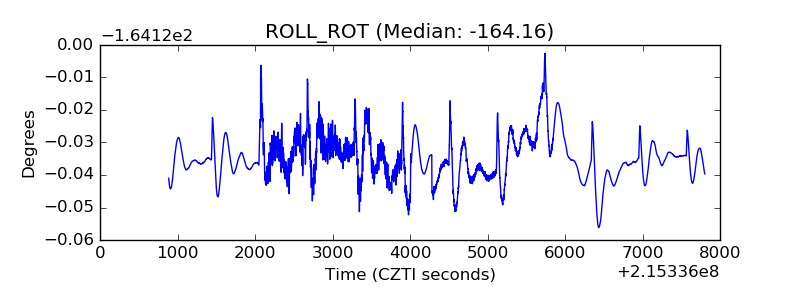 |
| _Roll_DEC | 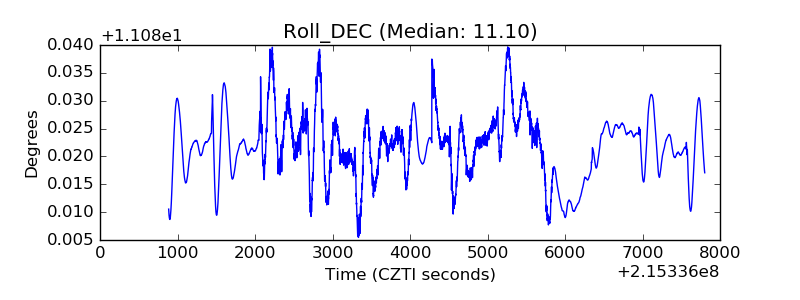 |
| _Roll_RA | 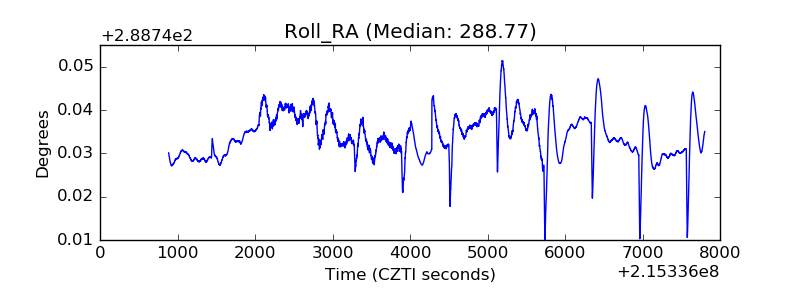 |
| Veto Counter | 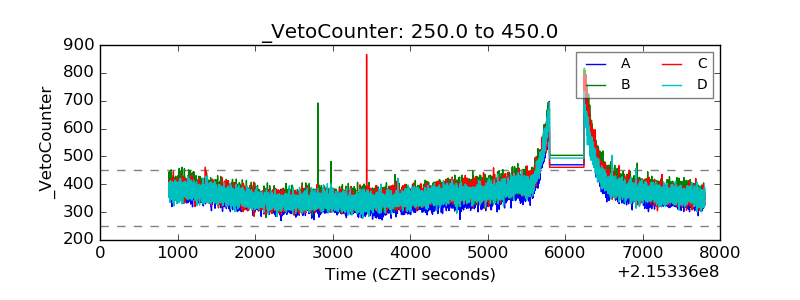 |