| Param | Original file | Final file |
|---|---|---|
| Filename | modeM0/AS1G06_033T01_9000000760_05866cztM0_level2.evt | modeM0/AS1G06_033T01_9000000760_05866cztM0_level2_quad_clean.evt |
| Size (bytes) | 462,015,360 | 80,844,480 |
| Size | 440.6 MB | 77.1 MB |
| Events in quadrant A | 3,255,898 | 495,878 |
| Events in quadrant B | 3,416,759 | 497,714 |
| Events in quadrant C | 3,184,083 | 497,426 |
| Events in quadrant D | 3,662,829 | 472,962 |
| Mode SS | |||
|---|---|---|---|
| Quadrant | BADHDUFLAG | Total packets | Discarded packets |
| A | 0 | 140 | 0 |
| B | 0 | 140 | 0 |
| C | 0 | 140 | 0 |
| D | 0 | 140 | 0 |
| Mode M0 | |||
|---|---|---|---|
| Quadrant | BADHDUFLAG | Total packets | Discarded packets |
| A | 0 | 14546 | 16 |
| B | 0 | 14718 | 27 |
| C | 0 | 14468 | 19 |
| D | 0 | 15442 | 21 |
| Quadrant | Total seconds | Saturated seconds | Saturation percentage |
|---|---|---|---|
| A | 6949 | 154 | 2.216146% |
| B | 6943 | 165 | 2.376494% |
| C | 6947 | 54 | 0.777314% |
| D | 6945 | 87 | 1.252700% |
Noise dominated data is calculated using 1-second bins in cleaned event files. If a bin has >2000 counts, and if more than 50% of those come from <1% of pixels, then it is considered to be noise-dominated and hence unusable.
| Quadrant | # 1 sec bins | Bins with >0 counts | Bins with >2000 counts | High rate bins dominated by noise | Noise dominated (total time) | Noise dominated (detector-on time) | Marked lightcurve |
|---|---|---|---|---|---|---|---|
| A | 6985 | 6956 | 2 | 2 | 0.03% | 0.03% | 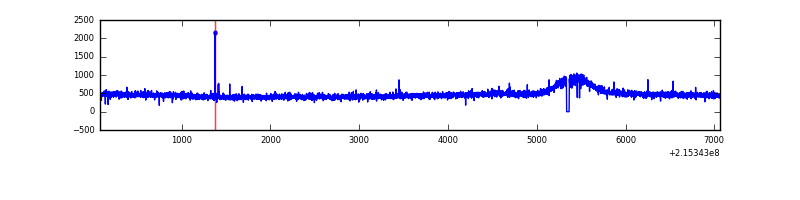 |
| B | 6985 | 6956 | 2 | 2 | 0.03% | 0.03% | 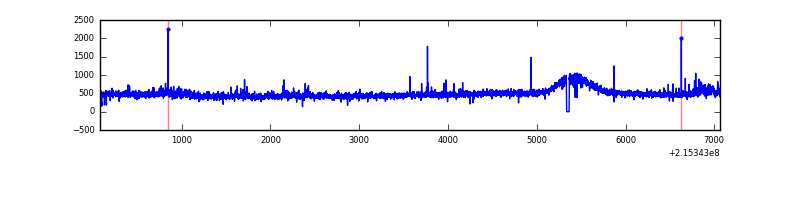 |
| C | 6985 | 6956 | 0 | 0 | 0.00% | 0.00% | 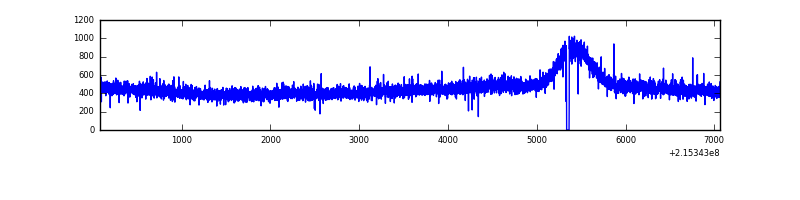 |
| D | 6985 | 6956 | 18 | 18 | 0.26% | 0.26% | 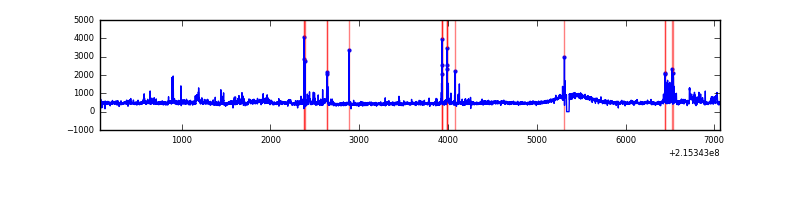 |
Top three noisy pixels from each quadrant. If the there are fewer than three noisy pixels in the level2.evt file, extra rows are filled as -1
| Pixel properties | Quadrant properties | ||||||
|---|---|---|---|---|---|---|---|
| Quadrant | DetID | PixID | Counts | Sigma | Mean | Median | Sigma |
| A | 15 | 236 | 10467 | 55.72 | 840 | 821 | 173.1 |
| A | 7 | 16 | 9657 | 51.04 | 840 | 821 | 173.1 |
| A | 12 | 194 | 8361 | 43.55 | 840 | 821 | 173.1 |
| B | 15 | 204 | 59549 | 356.82 | 843 | 823 | 164.6 |
| B | 0 | 219 | 34954 | 207.38 | 843 | 823 | 164.6 |
| B | 4 | 81 | 30721 | 181.66 | 843 | 823 | 164.6 |
| C | 13 | 61 | 6576 | 30.08 | 813 | 818 | 191.4 |
| C | 8 | 128 | 5072 | 22.22 | 813 | 818 | 191.4 |
| C | 8 | 112 | 2768 | 10.19 | 813 | 818 | 191.4 |
| D | 2 | 152 | 172761 | 857.3 | 817 | 795 | 200.6 |
| D | 11 | 241 | 151183 | 749.73 | 817 | 795 | 200.6 |
| D | 2 | 136 | 149567 | 741.67 | 817 | 795 | 200.6 |
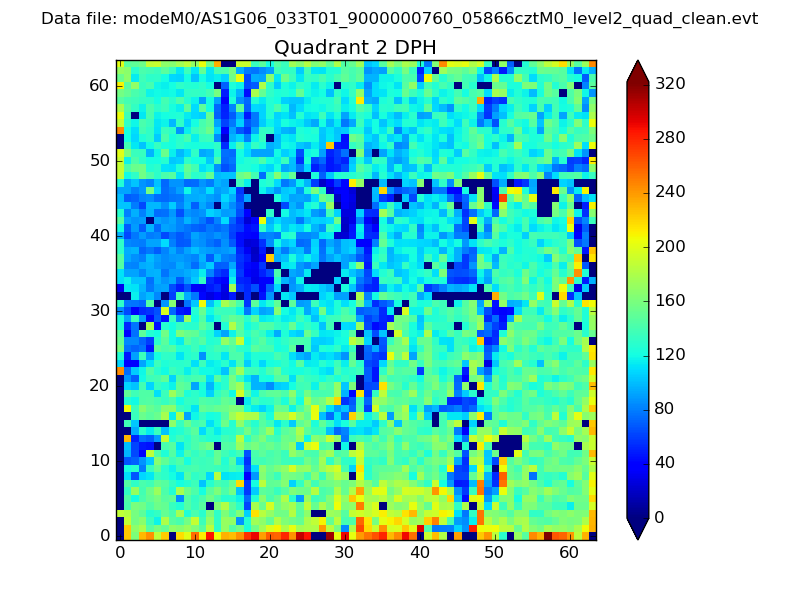
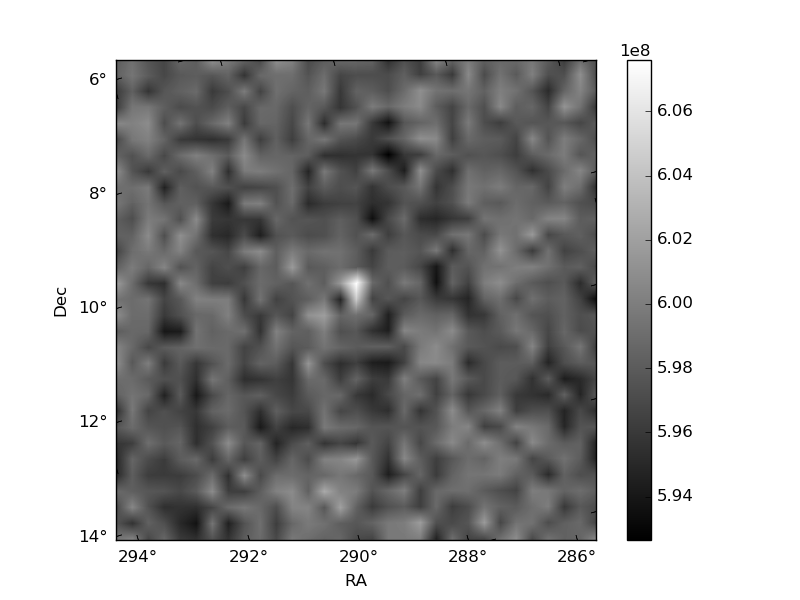
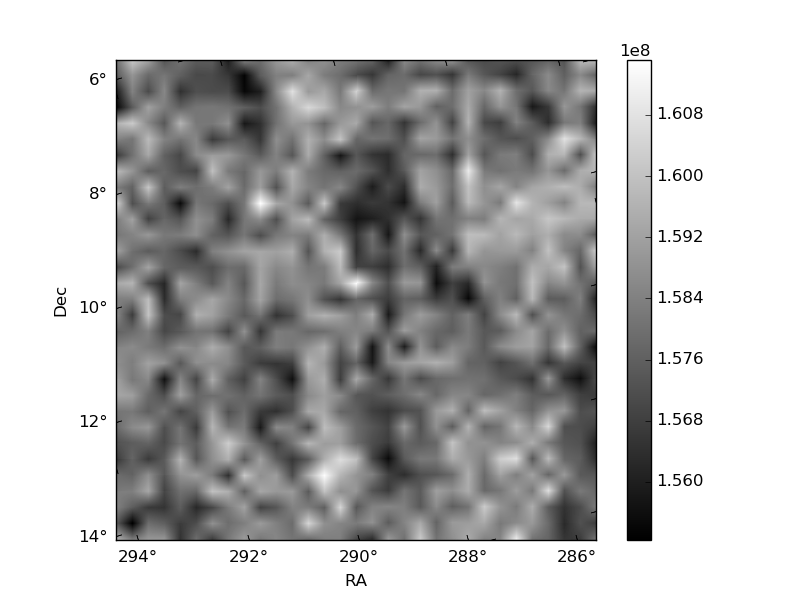
Histogram calculated using DETX and DETY for each event in the final _common_clean file
| Quadrant A | 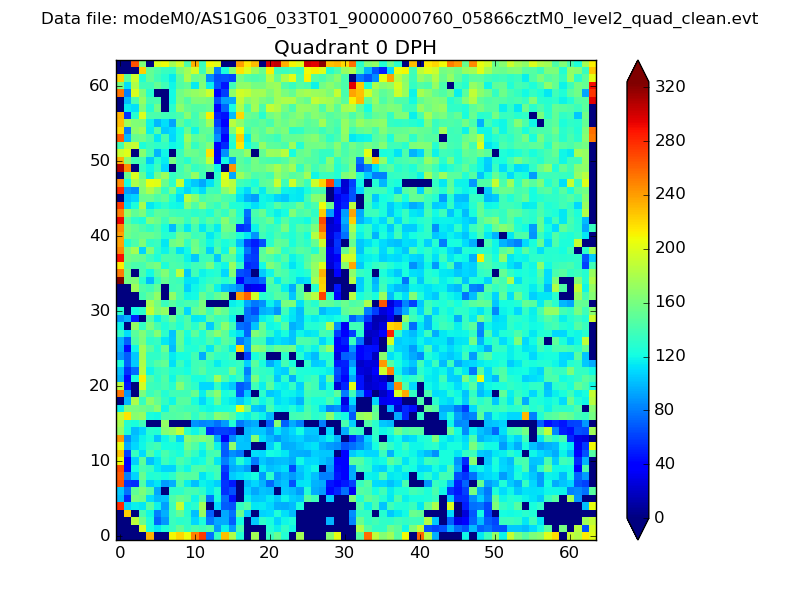 |
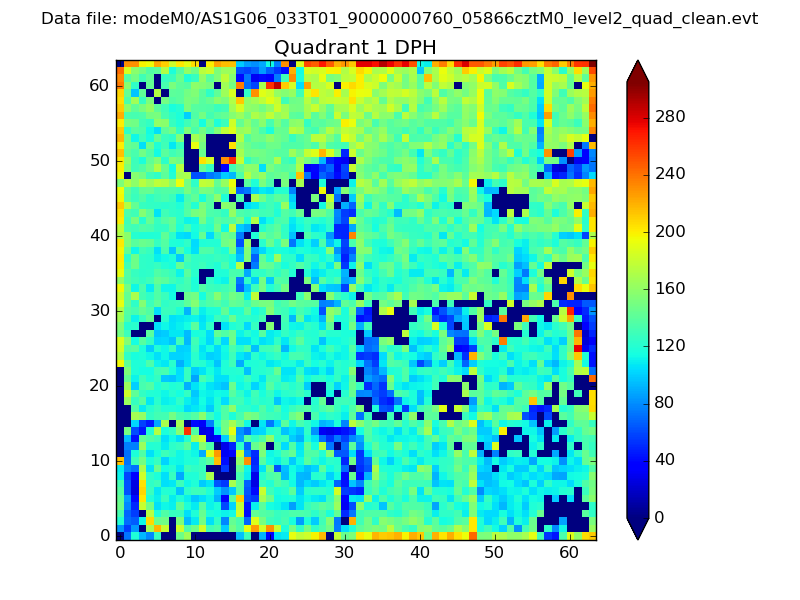 |
Quadrant B |
|---|---|---|---|
| Quadrant D | 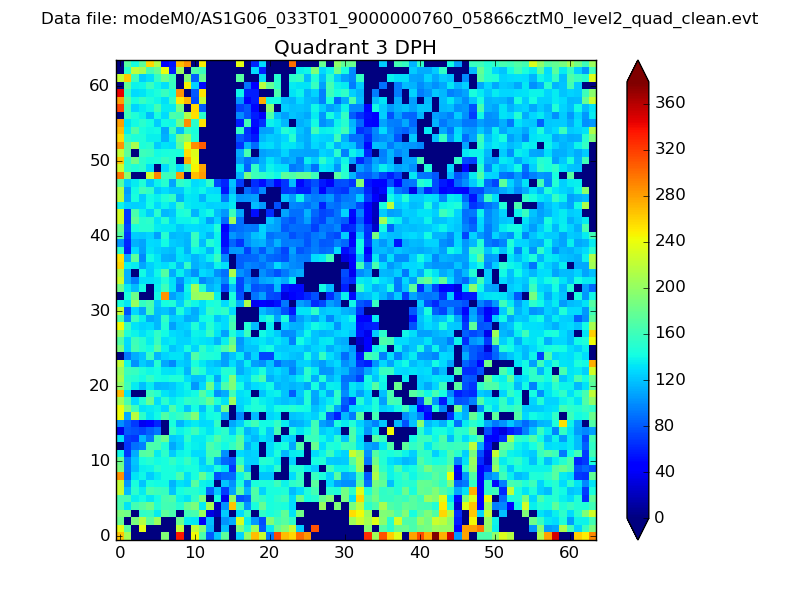 |
 |
Quadrant C |
| Plot type | Count rate plots | Images |
|---|---|---|
| Comparison with Poisson distribution Blue bars denote a histogram of data divided into 1 sec bins. Red curve is a Poisson curve with rate = median count rate of data. |
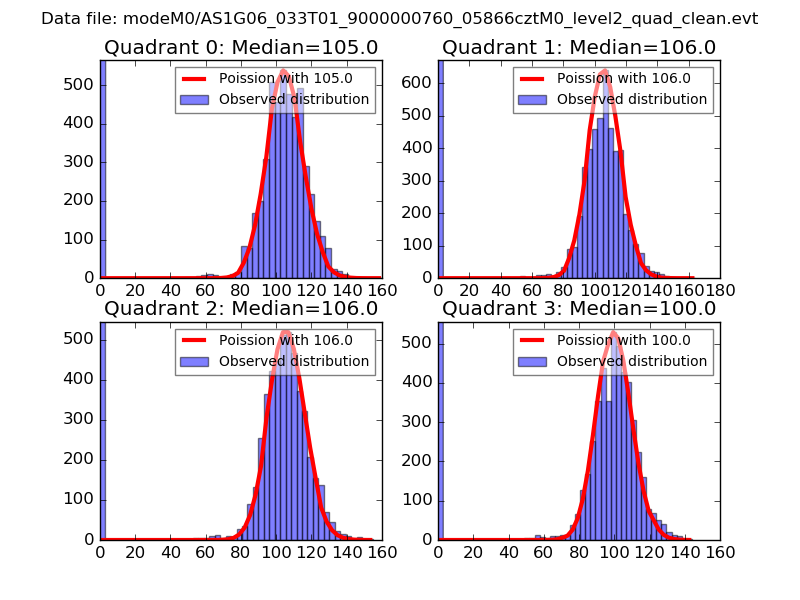 |
 |
| Quadrant-wise count rates Data is divided into 100 sec bins |
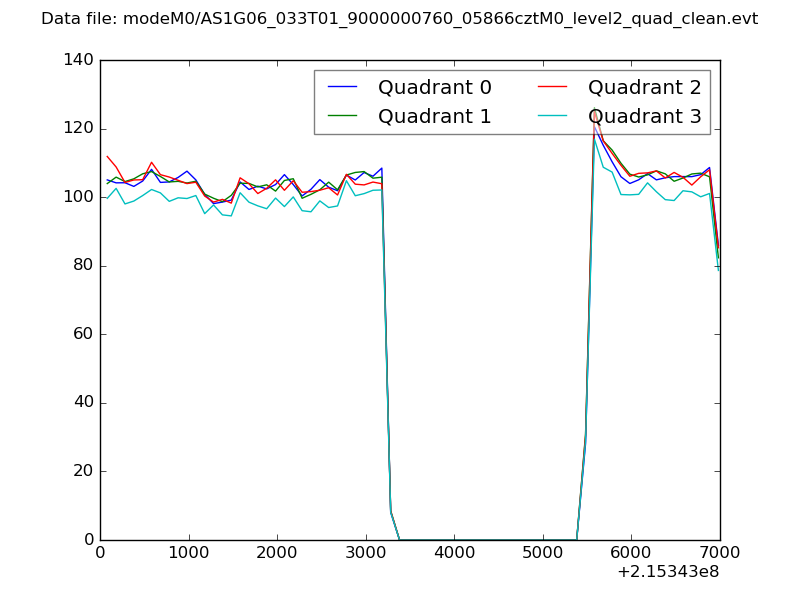 |
|
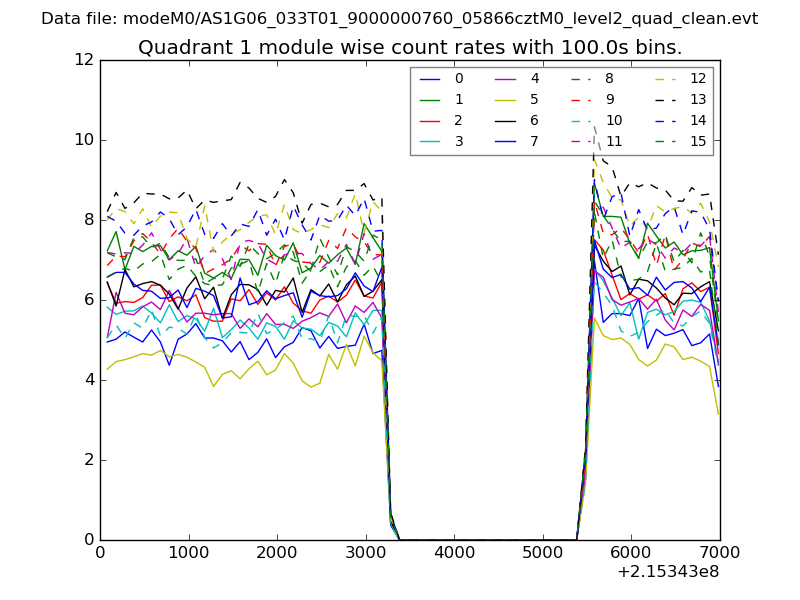
| Module-wise count rates for Quadrant A Data is divided into 100 sec bins |
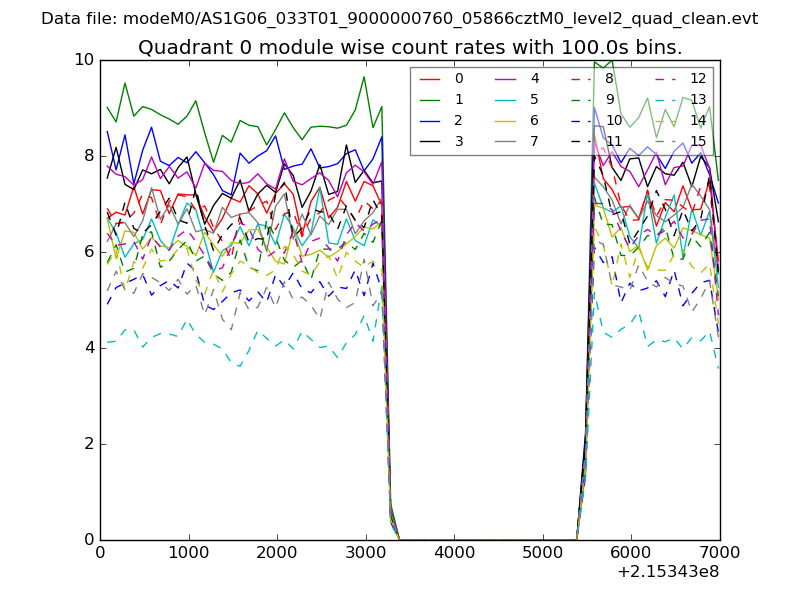 |
 |
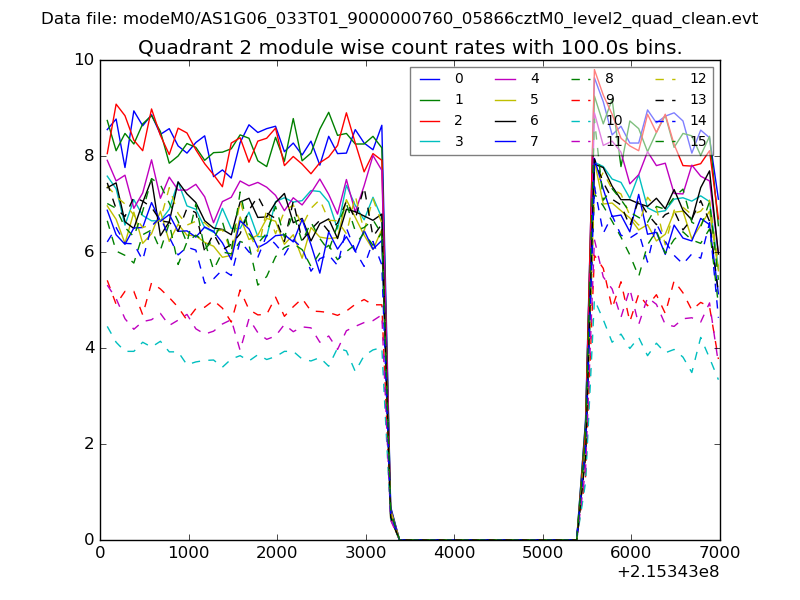
| Module-wise count rates for Quadrant B Data is divided into 100 sec bins |
 |
 |
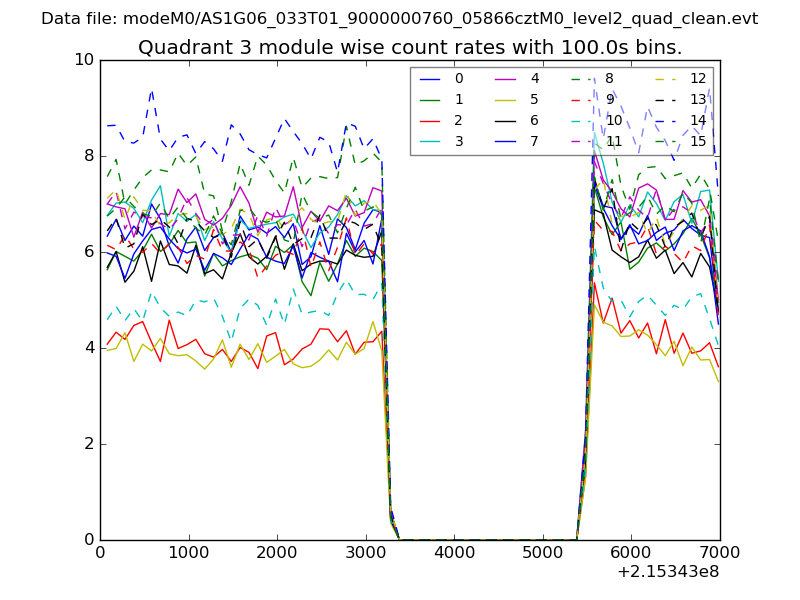
| Module-wise count rates for Quadrant C Data is divided into 100 sec bins |
 |
 |
| Module-wise count rates for Quadrant D Data is divided into 100 sec bins |
 |
 |
| Parameter | Plot |
|---|---|
| CZT HV Monitor | 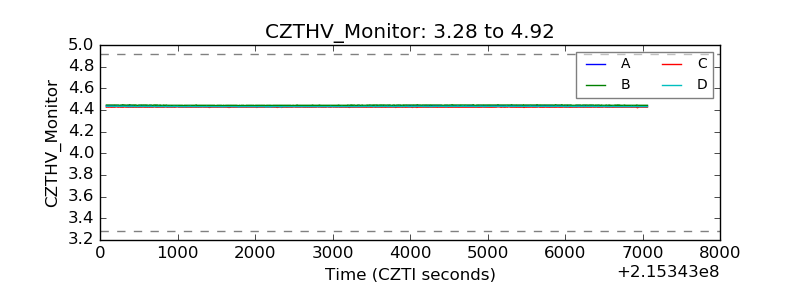 |
| D_VDD | 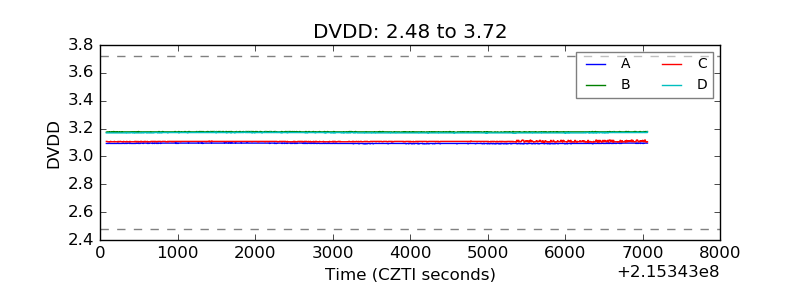 |
| Temperature 1 | 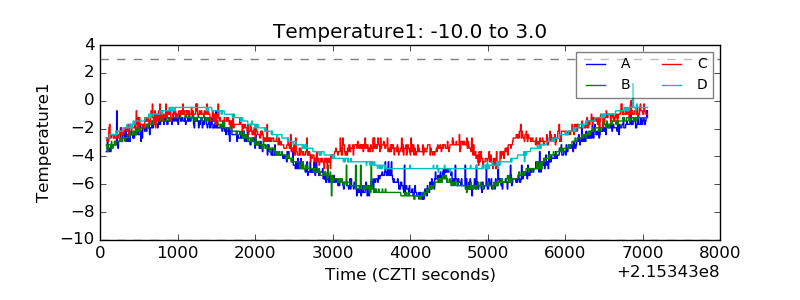 |
| Veto HV Monitor | 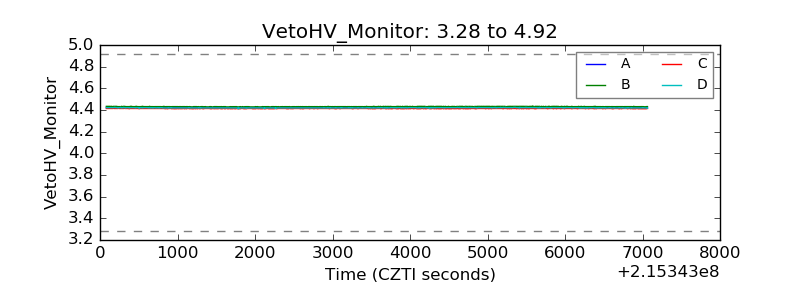 |
| Veto LLD | 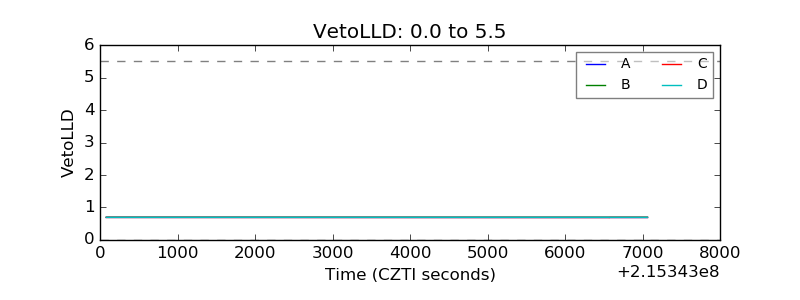 |
| Alpha Counter | 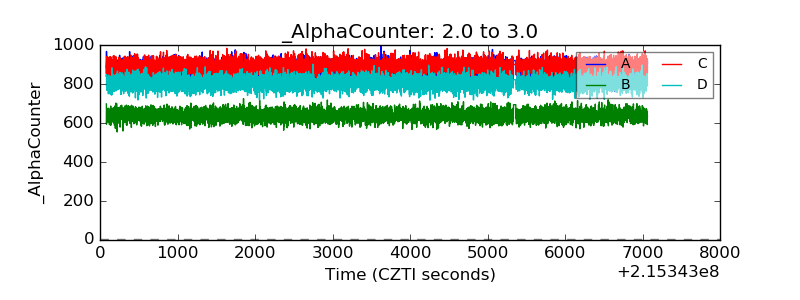 |
| _CPM_Rate | 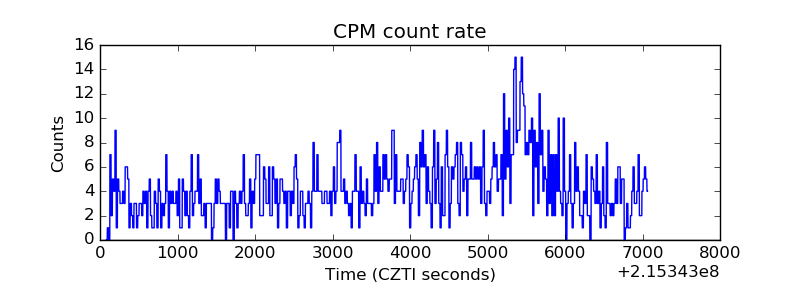 |
| CZT Counter | 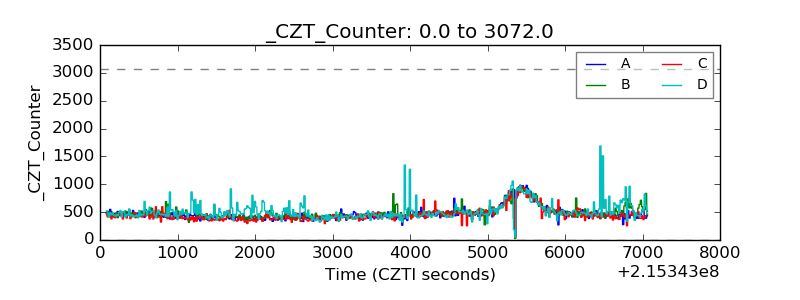 |
| +2.5 Volts monitor |  |
| +5 Volts monitor |  |
| _ROLL_ROT | 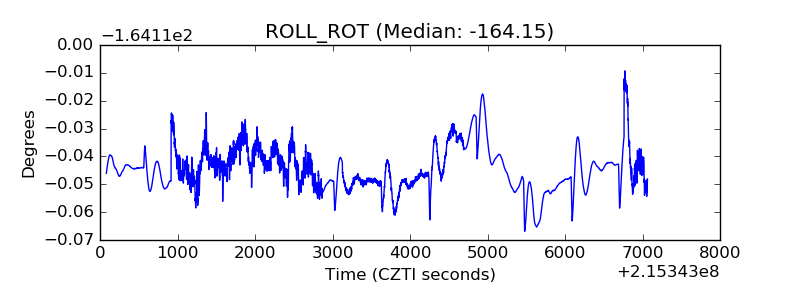 |
| _Roll_DEC |  |
| _Roll_RA | 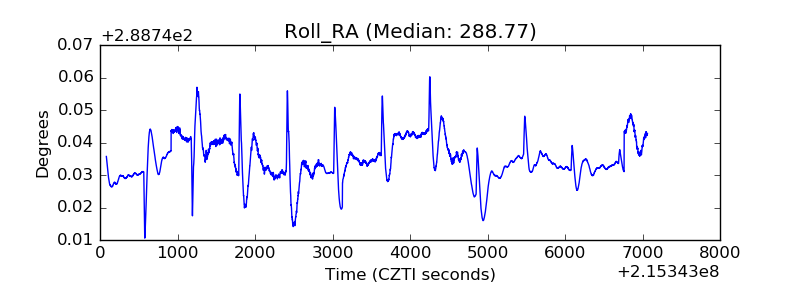 |
| Veto Counter | 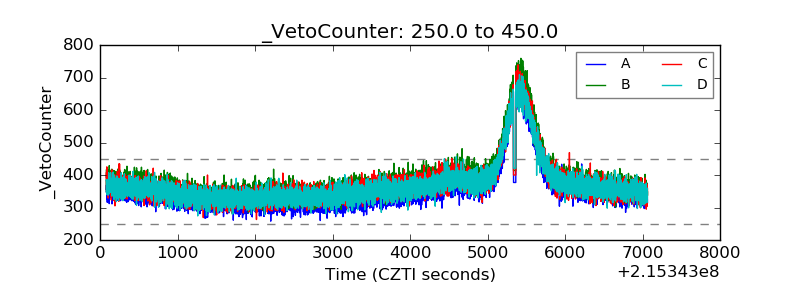 |