| Param | Original file | Final file |
|---|---|---|
| Filename | modeM0/AS1G06_033T01_9000000760_05867cztM0_level2.evt | modeM0/AS1G06_033T01_9000000760_05867cztM0_level2_quad_clean.evt |
| Size (bytes) | 517,757,760 | 87,145,920 |
| Size | 493.8 MB | 83.1 MB |
| Events in quadrant A | 3,441,548 | 540,269 |
| Events in quadrant B | 3,688,281 | 542,016 |
| Events in quadrant C | 3,376,351 | 543,525 |
| Events in quadrant D | 4,676,366 | 503,016 |
| Mode SS | |||
|---|---|---|---|
| Quadrant | BADHDUFLAG | Total packets | Discarded packets |
| A | 0 | 148 | 2 |
| B | 0 | 148 | 0 |
| C | 0 | 148 | 0 |
| D | 0 | 148 | 0 |
| Mode M0 | |||
|---|---|---|---|
| Quadrant | BADHDUFLAG | Total packets | Discarded packets |
| A | 0 | 15553 | 132 |
| B | 0 | 15928 | 147 |
| C | 0 | 15496 | 138 |
| D | 0 | 19093 | 487 |
| Quadrant | Total seconds | Saturated seconds | Saturation percentage |
|---|---|---|---|
| A | 7332 | 220 | 3.000546% |
| B | 7328 | 243 | 3.316048% |
| C | 7330 | 95 | 1.296044% |
| D | 7293 | 366 | 5.018511% |
Noise dominated data is calculated using 1-second bins in cleaned event files. If a bin has >2000 counts, and if more than 50% of those come from <1% of pixels, then it is considered to be noise-dominated and hence unusable.
| Quadrant | # 1 sec bins | Bins with >0 counts | Bins with >2000 counts | High rate bins dominated by noise | Noise dominated (total time) | Noise dominated (detector-on time) | Marked lightcurve |
|---|---|---|---|---|---|---|---|
| A | 7396 | 7388 | 0 | 0 | 0.00% | 0.00% |  |
| B | 7396 | 7391 | 8 | 8 | 0.11% | 0.11% |  |
| C | 7396 | 7394 | 0 | 0 | 0.00% | 0.00% | 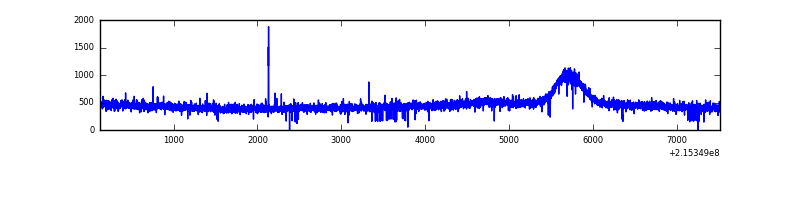 |
| D | 7396 | 7374 | 154 | 154 | 2.08% | 2.09% | 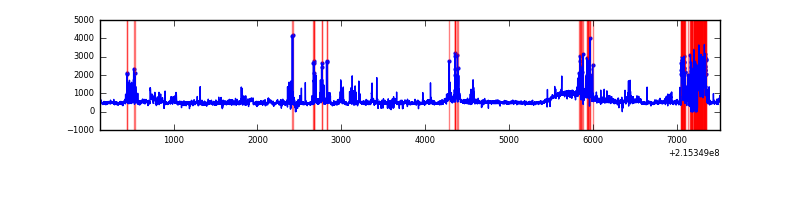 |
Top three noisy pixels from each quadrant. If the there are fewer than three noisy pixels in the level2.evt file, extra rows are filled as -1
| Pixel properties | Quadrant properties | ||||||
|---|---|---|---|---|---|---|---|
| Quadrant | DetID | PixID | Counts | Sigma | Mean | Median | Sigma |
| A | 0 | 50 | 19872 | 102.96 | 888 | 869 | 184.6 |
| A | 12 | 194 | 8680 | 42.32 | 888 | 869 | 184.6 |
| A | 0 | 226 | 8627 | 42.03 | 888 | 869 | 184.6 |
| B | 15 | 204 | 70507 | 394.91 | 894 | 872 | 176.3 |
| B | 4 | 81 | 47900 | 266.7 | 894 | 872 | 176.3 |
| B | 0 | 219 | 32573 | 179.78 | 894 | 872 | 176.3 |
| C | 1 | 16 | 9257 | 41.03 | 861 | 866 | 204.5 |
| C | 13 | 61 | 6911 | 29.56 | 861 | 866 | 204.5 |
| C | 8 | 128 | 3593 | 13.34 | 861 | 866 | 204.5 |
| D | 2 | 152 | 687952 | 3182.75 | 851 | 824 | 215.9 |
| D | 2 | 136 | 292291 | 1350.06 | 851 | 824 | 215.9 |
| D | 11 | 241 | 285394 | 1318.12 | 851 | 824 | 215.9 |
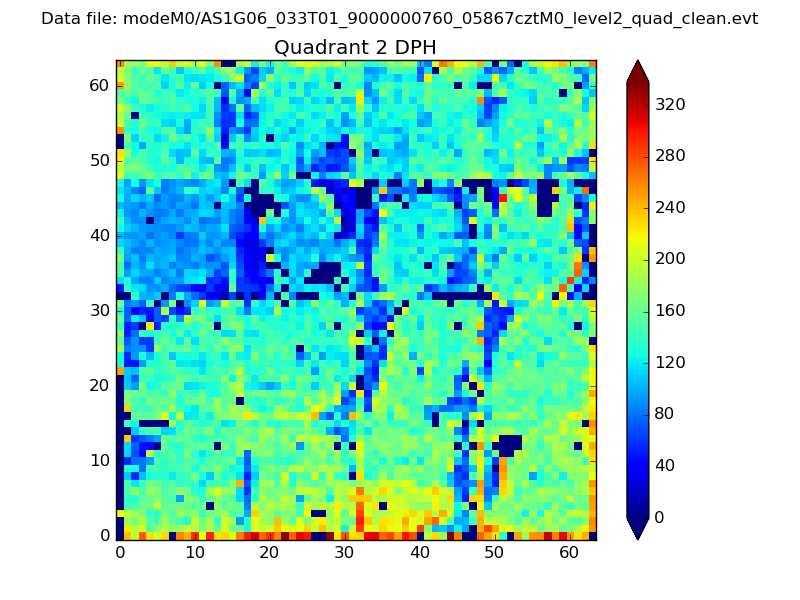
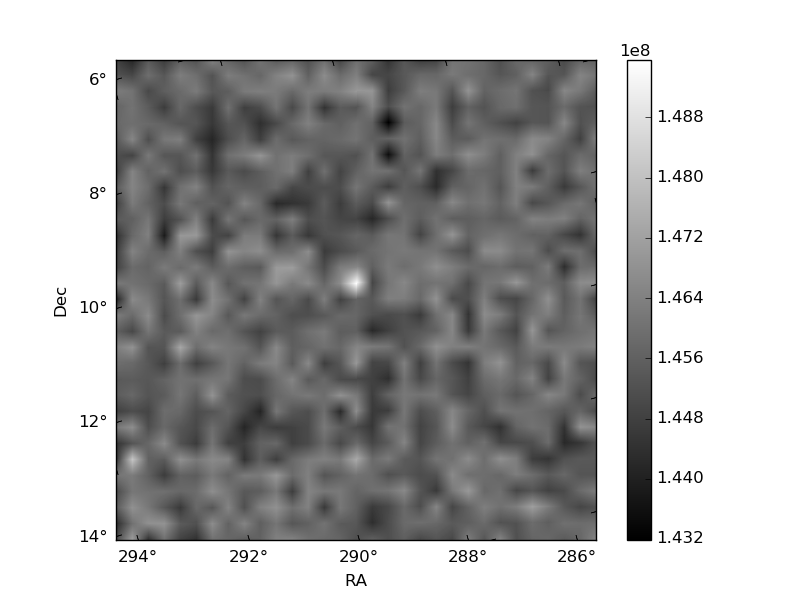
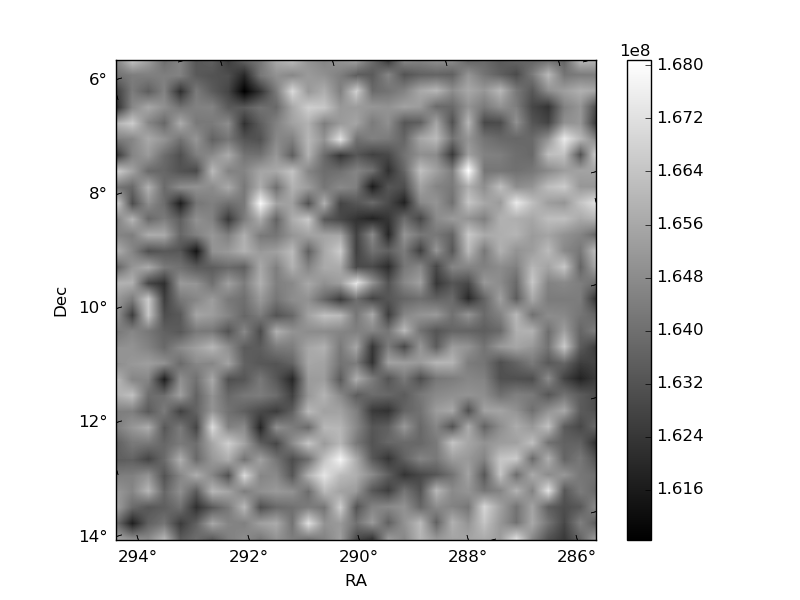
Histogram calculated using DETX and DETY for each event in the final _common_clean file
| Quadrant A | 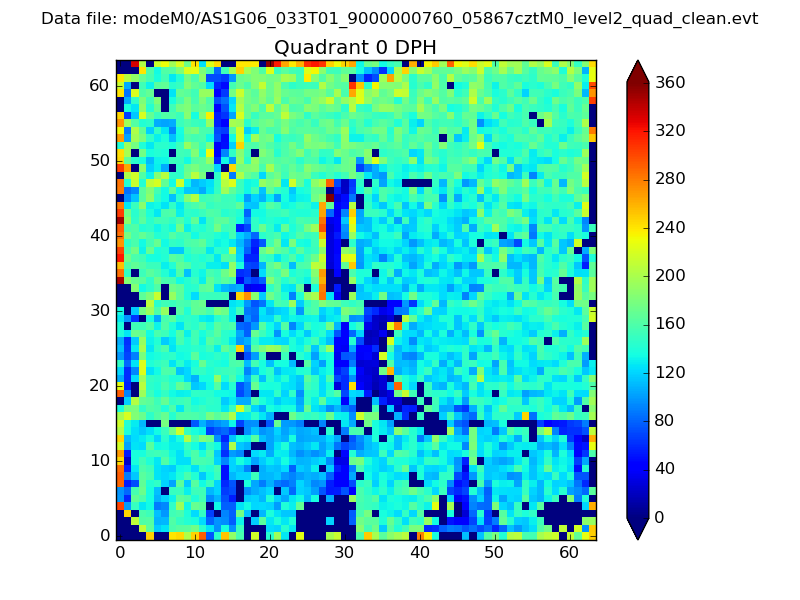 |
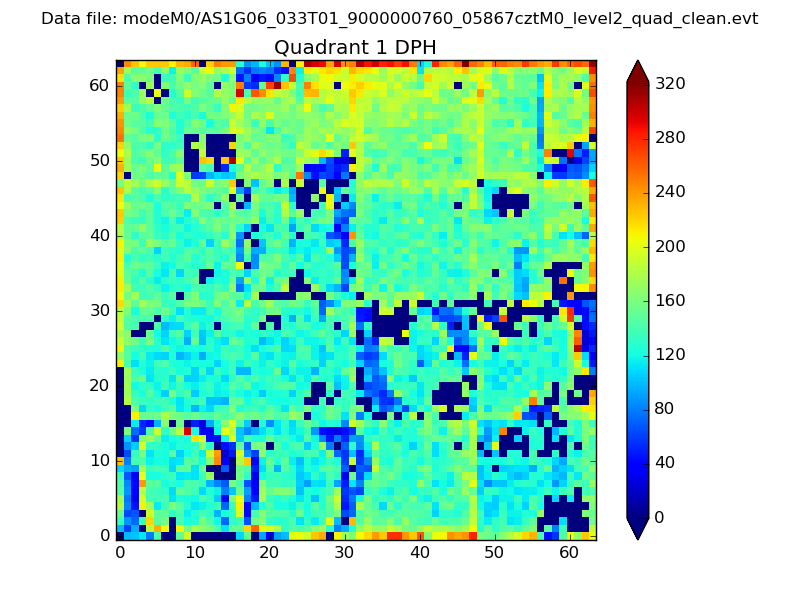 |
Quadrant B |
|---|---|---|---|
| Quadrant D | 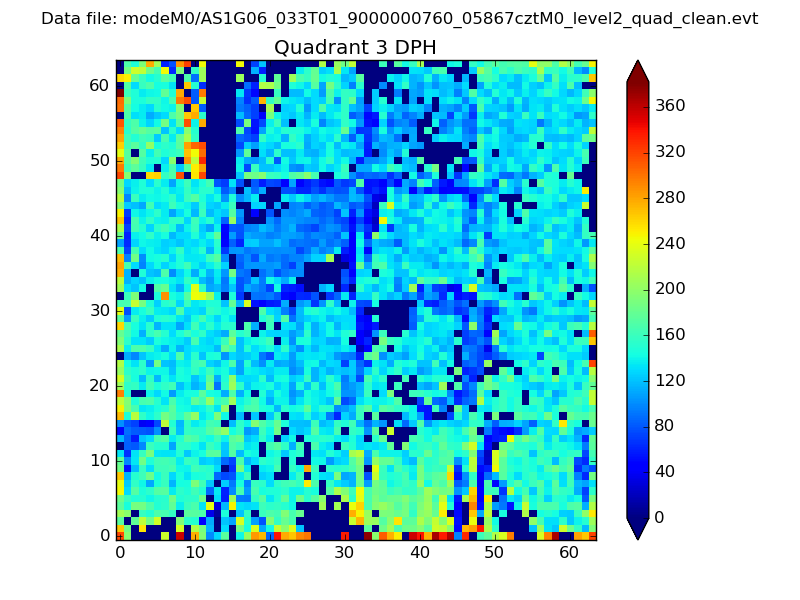 |
 |
Quadrant C |
| Plot type | Count rate plots | Images |
|---|---|---|
| Comparison with Poisson distribution Blue bars denote a histogram of data divided into 1 sec bins. Red curve is a Poisson curve with rate = median count rate of data. |
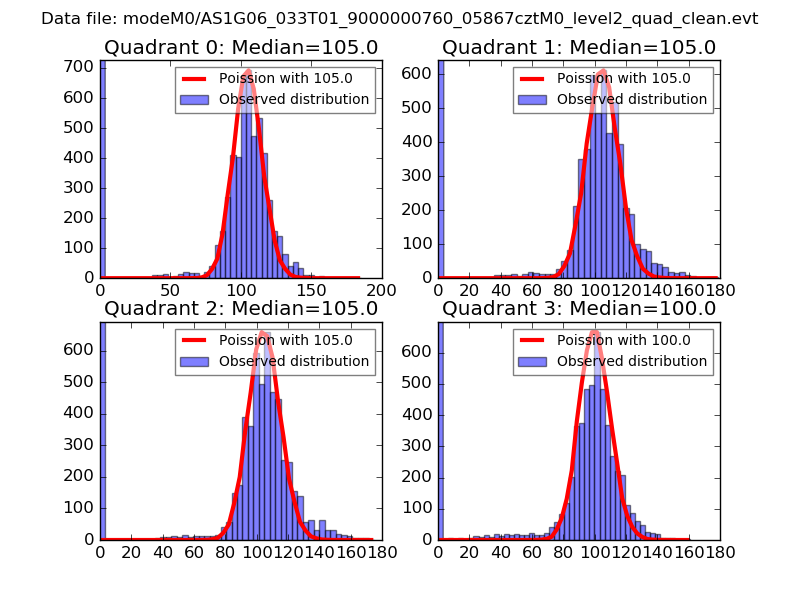 |
 |
| Quadrant-wise count rates Data is divided into 100 sec bins |
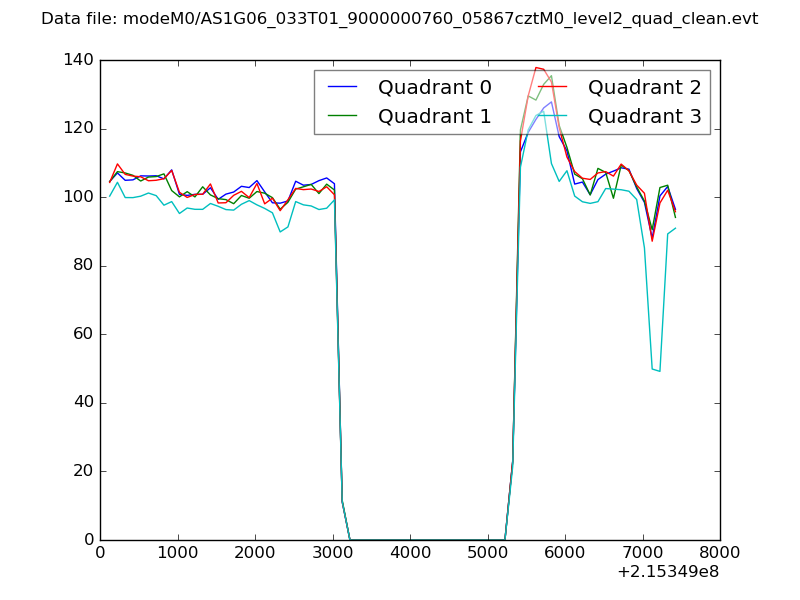 |
|
| Module-wise count rates for Quadrant A Data is divided into 100 sec bins |
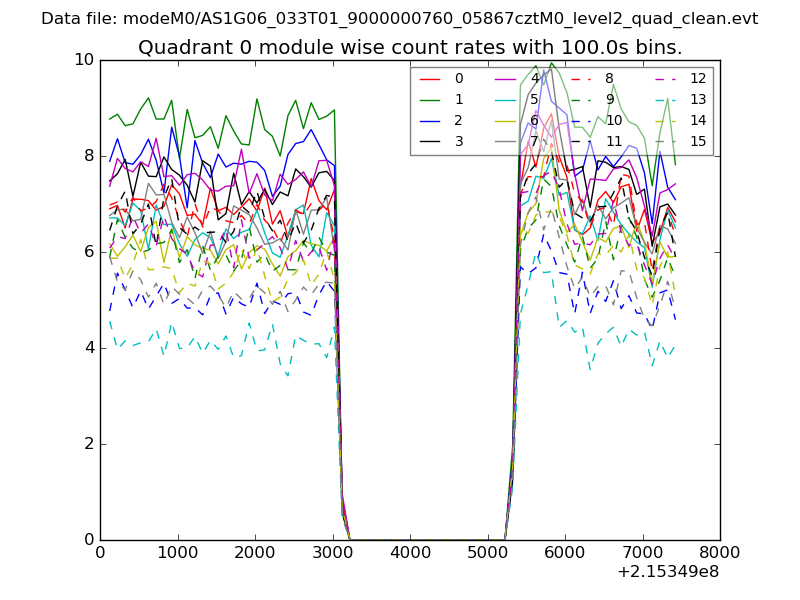 |
 |
| Module-wise count rates for Quadrant B Data is divided into 100 sec bins |
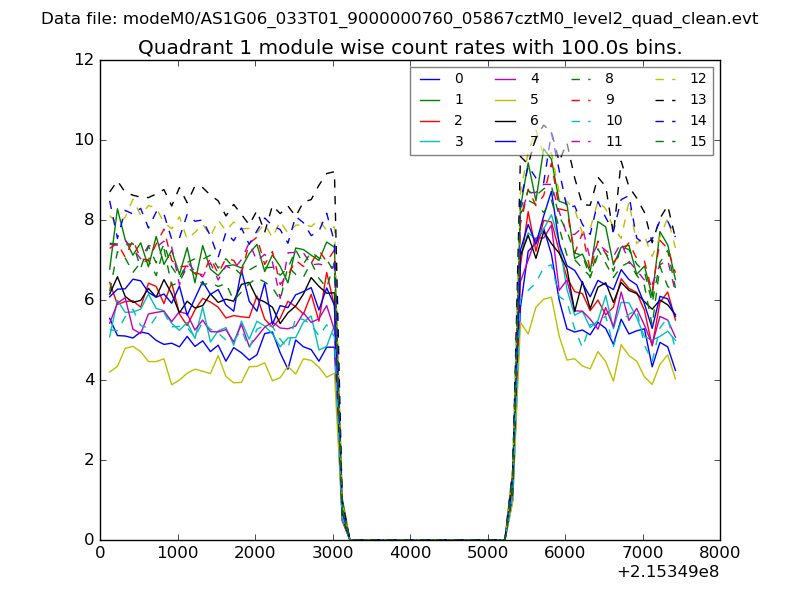 |
 |
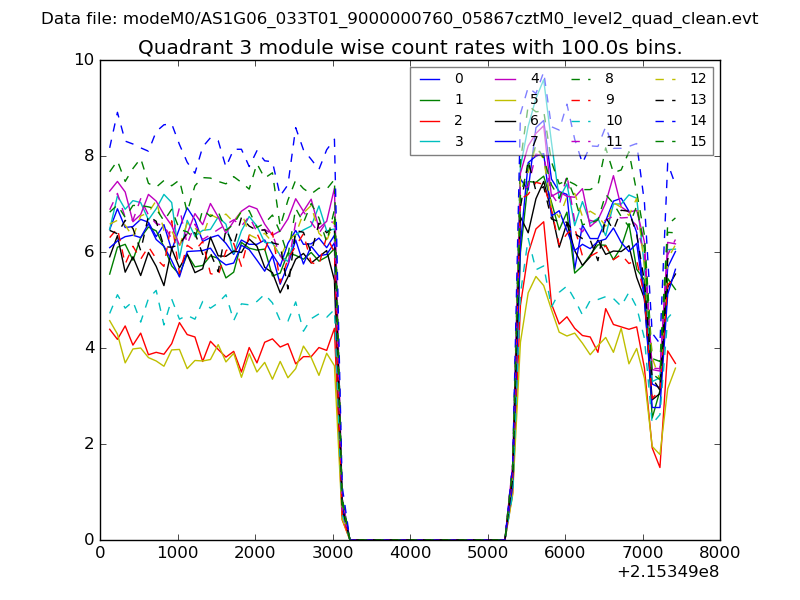
| Module-wise count rates for Quadrant C Data is divided into 100 sec bins |
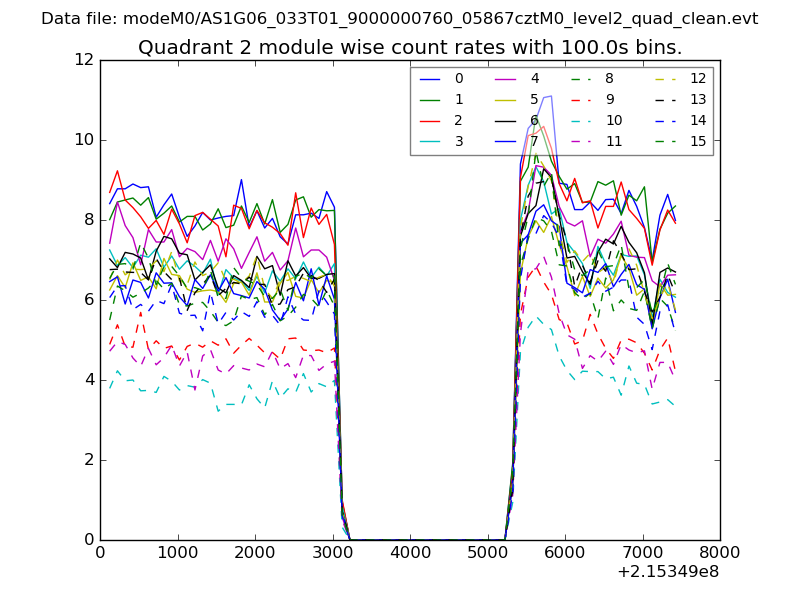 |
 |
| Module-wise count rates for Quadrant D Data is divided into 100 sec bins |
 |
 |
| Parameter | Plot |
|---|---|
| CZT HV Monitor | 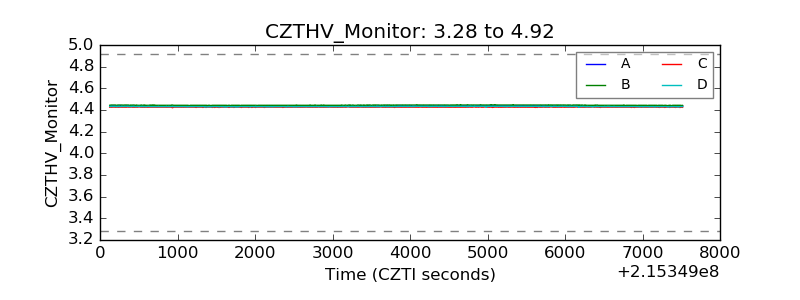 |
| D_VDD |  |
| Temperature 1 | 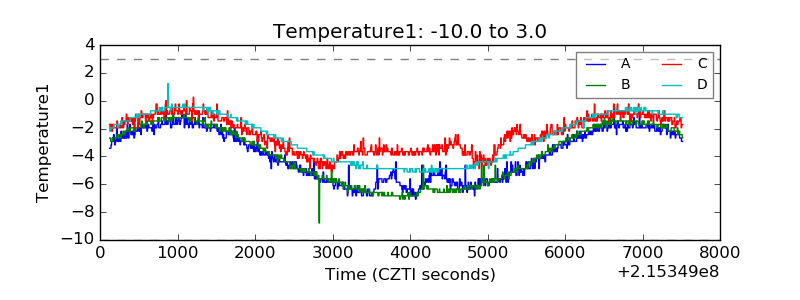 |
| Veto HV Monitor | 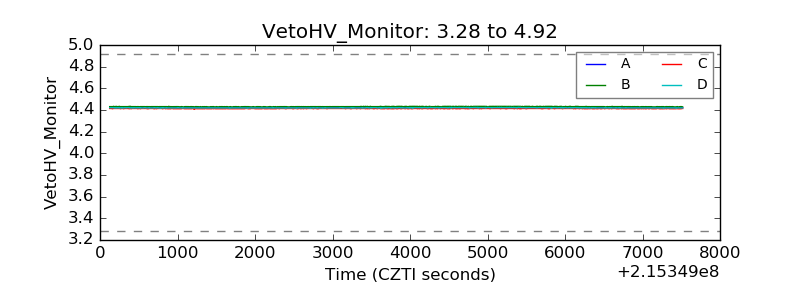 |
| Veto LLD | 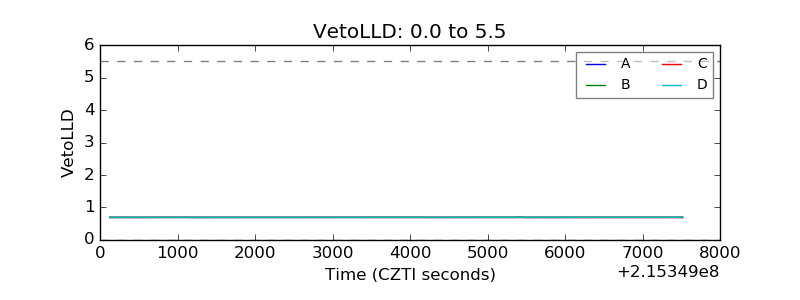 |
| Alpha Counter | 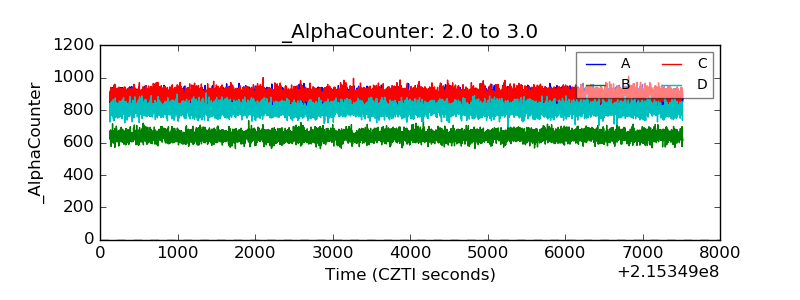 |
| _CPM_Rate | 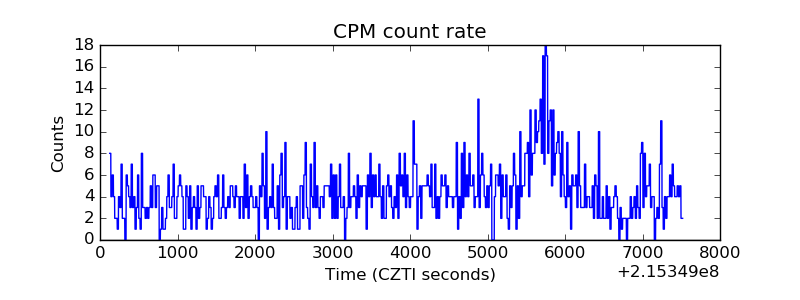 |
| CZT Counter | 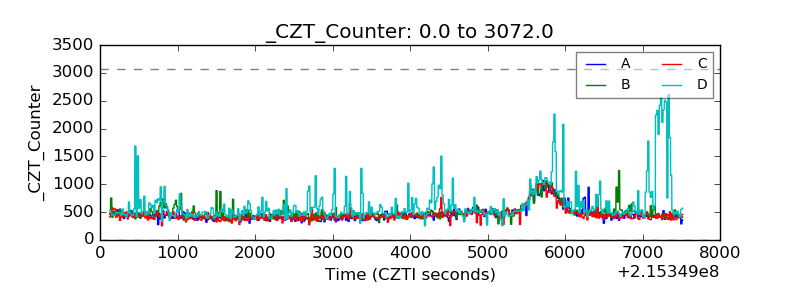 |
| +2.5 Volts monitor |  |
| +5 Volts monitor |  |
| _ROLL_ROT | 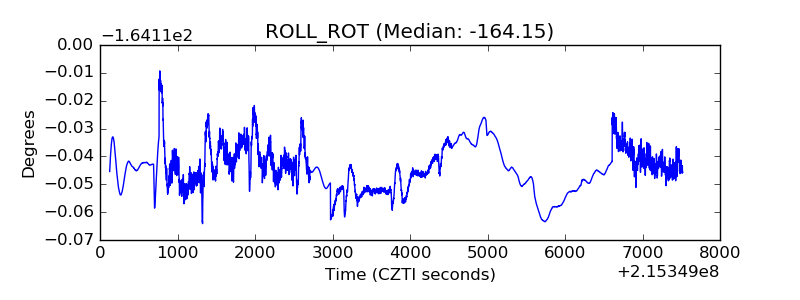 |
| _Roll_DEC | 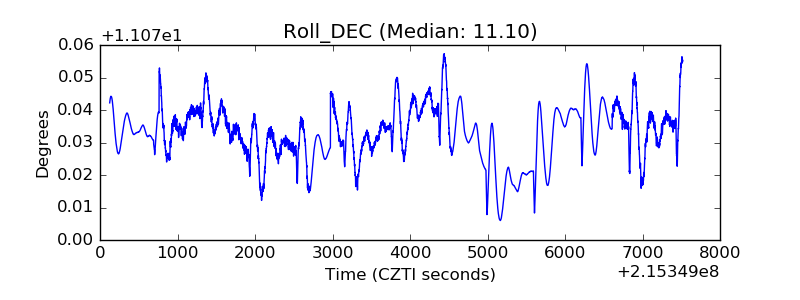 |
| _Roll_RA | 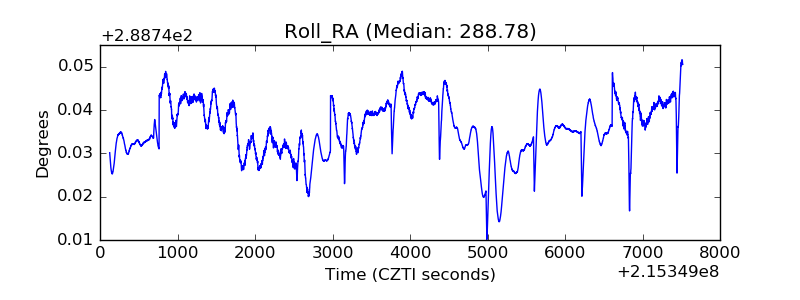 |
| Veto Counter | 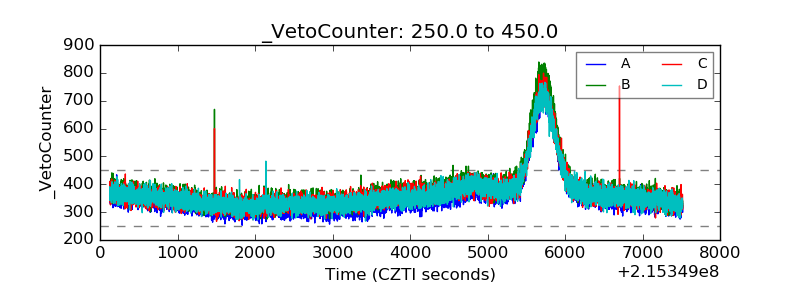 |